


INTRODUCTION
Acid precipitation has been studied in various locations by many workers (Campbell and others 1978; Munger 1982; Winkler 1983; and Barrie and others 1984). The mean acidity of surface snow and deep ice on the ice cap in Ellesmere Island (81 °N and 73 °W) was measured to be pH 5.48 for the Holocene and pH 5.23 for 1954-80 (Koerner and Fisher 1982). Precipitation with relatively high acidity was reported in the northeastern United States by Stensland and Semonin (1982). The concentrations of cloud condensation nuclei in the plumes from coal fired electric power plants were found to be a few times greater than those in the ambient air (Hobbs and others 1980). Flyash particles from coal fired electric power plants in the Tennessee Valley Authority system were of glass, mullite-quartz and magnetic spinel (Hulett and others 1980). Aerosols such as soil particles and solid combustion by-products are as important to a full interpretation of the distribution of acid precipitation as the anthropogenically produced emissions.
This paper presents the results of an investigation of (1) the scanning electron microscope examinations of flyash in fresh snow, from coal fired electric power plants and oil fired heating plants; (2) simultaneous measurements of pH and electrical conductivity of fresh snow and snow cover with flyash by dry fallout; (3) and the reduction of acidity of snow by precipitated alkaline flyash.
MATERIALS AND METHODS
The acidities of snow in Fairbanks, Alaska, and Hanover, New Hampshire, were measured with a combination electrode (Thomas glass electrode with Calomel reference electrode) using an Orion Research Ionanalyzer, which is calibrated with buffer solutions of pH 4.01 and pH 7.00. Electrolytic conductivities (μS m-1) of the snow meltwater were measured with a conductance (model RCM 1581, Thomas Co) bridge model at room temperature (25 °C).
Flyash particles from coal fired electric power plants in Alaska and oil fired heating plants in New Hampshire were examined by scanning electron microscopy to compare with those in fresh snow. To examine chemical species and concentrations of flyash in fresh snow, 20 mL of snow meltwater was filtered through 1 μm polycarbonate membrane filters. The flyash remaining on the filters was coated with gold palladium vapor to a thickness of about 10 mm. The characteristics and elemental compositions were examined with a scanning electron microscope (SEM) and energy dispersive X-ray analyzer (EDXA).
FLYASH FROM CHIMNEYS

Fig. 1. Scanning electron micrograph (SEM) of coal used at electric power plants in Fairbanks, Alaska (a); the elemental composition of the flyash indicates that the coal contains alkali earth metals (b).
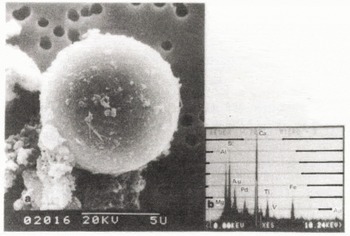
Fig. 2. SEM of flyash from coal fired electric power plant in Fairbanks (a); the elemental composition of the flyash indicates that the flyash contains rich calcium (b).
Emissions of sulfur dioxide and nitrogen oxide from fossil fuel combustion are believed to be the cause of acid precipitation. Characteristics of coal were examined to compare with those of the flyash. A typical scanning electron micrograph of Alaskan coal used at coal fired electric power plants in Fairbanks shows minerals and cracks on the surface (Figure la). The elemental compositions of the minerals were found to be alkali earth metals: Ca 13.0, Mg 6.8, K 5.9, and Na 3.3% by weight (Figure lb). Flyash particles from coal fired electric plants in Fairbanks were irregular and spherical in shape, with 0.2 to 50μm diameters. The elemental compositions of spherical ash were similar to those of irregular ash. When the flyash particles were separated into four kinds (Ca, Si, Al, and Fe rich) the Ca rich flyash was found to be the most common. A typical Ca rich flyash (Figure 2a) is 9 urn in diameter, and the elemental composition (Figure 2b) is Ca 28, Mg 4, Si 22, Al 17, Fe 8, and Ti 7% by weight. The dry fallout of the alkaline flyash could reduce the acidity of the snow (Stensland and Semonin 1982).
Flyash from oil fired heating plants in Hanover was always composed of S rich particles 10 to 80 um in diameter. The sulfur contents in the flyash ranged from 30% to 50% by weight. A typical scanning electron micrograph of the flyash (Figure 3a) shows a spherical shape with porous structure. The major elemental compositions were S 34.9, Si 8.7, and Cl 7.4% by weight, and the minor elements (Na, Mg, Al, K, Ca, Ti, Cr, Fe, Co, and Cu) were less than 5% (Figure 3b). From these measurements, it seems therefore that flyash from oil fired heating plants can be distinguished by elemental composition and morphology from those of coal fired electric power plants.

Fig. 3. SEM of flyash from oil fired heating plants in Hanover, New Hampshire (a); the elemental composition of the flyash indicates that the flyash contains rich sulfur (b).
FLYASH IN FRESH SNOW
Flyash particles act as freezing nuclei during snow crystal formation in the supercooled clouds. Snow crystals scavenge flyash during the precipitation stage in the atmosphere. Four kinds of flyash (Si, S, Al, and Fe-rich) were found in fresh snow in Hanover, New Hampshire. The flyash particles found in the fresh snow were 73.5% Si-rich, 19.3% S-rich, 4.1% Al-rich, and 3.1% Fe-rich. Elemental compositions of typical Si-rich flyash particle (Figure 4) are Si 55, Al 30, K. 7, Ti 3, Fe 2, and Na 1% by weight, which indicates a low content of alkaline metals as compared to that in Alaskan coal.
The flyash particles in the fresh snow samples ranged from 0.2 to 35 μm in diameter. The density of flyash (>1 μm diameter) in the snow ranged from 4 to 600 particles/mL, and the mean density was 392 particles/mL for measurements of 9 snowfalls. The variety of the density depends on a variety of meteorological conditions during snow precipitation. The mean flyash density in snow from New Hampshire is about 100 times higher than that of Greenland snow (Kumai 1966). The chemistry of snow in New Hampshire is much more influenced by fossil fuel combustion than Greenland snow.

Fig. 4. SEM of flyash in fresh snow from Hanover, New Hampshire (a); the elemental composition of the flyash indicates that the flyash contains rich silicon (b).
THE pH AND ELECTRICAL CONDUCTIVITY
Simultaneous measurement of pH and electrical conductivity of snow in Fairbanks, Alaska, and Hanover, New Hampshire, were conducted to investigate the characteristics of flyash in snow and the influence of flyash on acid snow.
Snow cover in Fairbanks
The depth of the snow cover was 30 to 50 cm in early April 1973 in Fairbanks. Thirty-six snow samples (surface to 5 cm in depth) were collected in polyethylene bottles near coal fired electric power plants in the city and the rural area. The pH measurements of snow were carried out at room temperature in April 1973, and the results were plotted vs. distance from the coal fired electric power plant (Figure 5). The acidity of snow increased with the distance from the power plant. The maximum acidity of pH 5.60 (399 μS m-1) was obtained in snow sampled in a rural area about 20 km from the plant. The snow melt-water of pH 5.60 corresponds to pure water with dissolved atmospheric carbon dioxide at 0.03 % by weight. However, snow within I km from the power plant was always alkaline due to the dry fallout of alkaline flyash from the Alaskan coal containing alkali earth metals.

Fig. 5. The pH vs distance of snow from coal fired electric power plant in Fairbanks, Alaska.
Simultaneous measurements were made of pH and electrical conductivity of 36 snow samples in the city and the rural area, and the results show that the acidity decreased with the electrical conductivity (Figure 6). In Fairbanks, the electrical conductivity was increased with concentration of alkaline ions from the alkaline flyash in the snow. A snow sample near the power plant was pH 7.50 with an electrical conductivity of 4,500 μ5 m-1. The acid snow was changed to alkaline snow by alkaline flyash from the power plant.
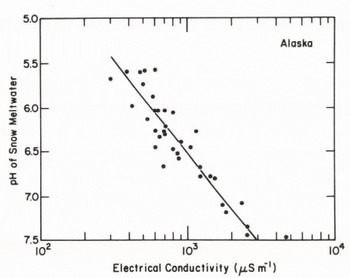
Fig. 6. The pH vs electrical conductivity of snow in a rural area and near a coal fired electric power plant in Fairbanks, Alaska.
Snow cover in Hanover
The depth of the snow cover was 25 to 30 cm in early February 1984 in Hanover, New Hampshire. Alkaline flyash particles (Figure 2) were not found in the Hanover snow. Snow near oil fired heating plants was covered with dense flyash. The flyash particles were spherical in shape with a porous structure, and the main element was sulfur (Figure 3). The pH of the snow was plotted vs. distance (10-500 m) from the oil fired heating plant. The acidity of snow was not changed with distance by sulfur rich flyash from the heating plant. The snow along the roadside was pH 7.29 with an electrical conductivity of 3,000 μs and was apparently influenced by soil and salts spread on the snowy road.
Fresh snow in Hanover

Fig. 7. The pH vs electrical conductivity of snow collected during 1972-73 and 1980-84 in Hanover, New Hampshire.
Measurements of pH and electrical conductivity of 22 snowfalls (207 mm in water equivalent) were conducted during 1972-73, and compared with those of 22 snowfalls (206 mm in water equivalent) during the 1980-84 in Hanover. The amount of snow (207 mm) is about one-third the annual precipitation in New Hampshire. The result shows that the acidities of snow increased with the electrical conductivities (Figure 7). In Hanover, the electrical conductivities were increased with concentration of hydrogen ion in the snow. The pH trend shown by the solid line for snow in 1980-84 is higher than that shown by broken line for snow in 1972-73. This indicates that the acidities of snow in 1980-84 were higher than those of snow in 1972-73. In this period, coal consumption also increased in the United States. The mean hydrogen ion concentration of 22 snowfalls in 1980-84 was calculated to be 10-4 48mol/L, and that of 22 snowfalls in 1972-73 was 10-4 61mol/L.
The acidities of snow ranged from pH 5.45 to pH 3.96, and the electrical conductivities ranged from 240 to 5,500 μS m-1. Each snowfall has different values of pH and electrical conductivity due to the different meteorological conditions such as air-mass source region, wind direction, amount of precipitation, and snow crystal habits. Relatively high acidity of snow was obtained during south winds and lower precipitation rates, and when rimed snow crystals were present. Air masses from the south generally contained higher concentrations of flyash than those from the north in New Hampshire. Rimed snow crystals contained more acid condensation nuclei than those of non-rimed snow crystals. Condensation nuclei are mainly combustion by-products, and are acid nuclei. Relatively low acid snow was obtained from north wind, large precipitation, and non-rimed snow crystals.
In conclusion, it was found that the acidity of snow was reduced by alkaline aerosols, soil minerals, and flyash containing alkali earth metals from coal fired electric power plants in Fairbanks, Alaska.
ACKNOWLEDGEMENTS
This work was supported by Corps of Engineers environmental funding at the Cold Regions Research and Engineering Laboratory, Hanover, New Hampshire.


