1 Introduction
Reference Payne, Bettman and JohnsonPayne et al. (1993) categorise choice procedures as alternative-based search (ABS) and characteristic-based search (CBS) procedures. Given a multi-attributive choice problem, ABS procedures are procedures according to which the decision-maker examines the attributes within alternatives. In contrast, CBS procedures are procedures according to which the decision-maker examines the attributes across alternatives.Footnote 1Examples of ABS procedures include weighted additive models, such as prospect theory (Reference Tversky and KahnemanTversky & Kahneman, 1992), and satisficing (Reference SimonSimon, 1955) and examples of CBS procedures comprise the elimination-by-aspects procedure (Reference TverskyTversky, 1972) and the priority heuristic (Reference Brandstätter, Gigerenzer and HertwigBrandstätter et al., 2006). In this paper we experimentally investigate whether inducing individuals to use ABS or CBS procedures has an effect on the outcome of their decision in the context of risky choice.
In particular, we propose an innovative between-subject experimental design consisting of two tasks. In Task 1, which is common across treatments, we elicit subjects’risk preferences by using the ‘bomb risk elicitation task’ (Reference Crosetto and FilippinCrosetto & Filippin, 2013). In Task 2, we ask subjects to solve a sequence of randomly generated lottery-choice problems by inducing them (in different treatments) to use either ABS or CBS procedures. The novelty of our design lies in the fact that, unlike in experiments studying framing effects, we do not alter the way in which information is presented to subjects.Footnote 2 In contrast, we experimentally manipulate the procedure that subjects use to search by proposing a modification of the well-known mouse-tracing paradigm (Payne et al., 1993). Before outlining the methods employed in our experiment, we discuss the related literature.
Our experiment relates to the literature on judgment and decision making (JDM) in at least two ways. First, the JDM literature on risky choice has investigated what model (or class of models) better explains subjects’ behaviour (e.g. Reference Fiedler and GlöcknerFiedler & Glöckner (2012)). For example, an important debate has concerned whether individuals use heuristics, such as the lexicographic heuristic, or more integrative choice procedures, such as prospect theory, in risky choice, and how this relates to the information search patterns detected via process-tracing paradigms, such as mouse-tracing, eye-tracking, and decision-moving window (Reference Brandstätter, Gigerenzer and HertwigBrandstätter et al., 2006; Reference Glöckner and BetschGlöckner & Betsch, 2008a; Reference Glöckner and HerboldGlöckner & Herbold, 2011; Reference Glöckner and PachurGlöckner & Pachur, 2012; Reference Su, Rao, Sun, Du, Li and LiSu et al., 2013). Our experiment tackles the same broad research question, but from a different perspective, in that it investigates whether inducing subjects to use certain choice procedures has an effect on the outcome of their decision.
Second, from a methodological point of view, the JDM literature has examined whether mouse-tracing methods induce different information search patterns relative to open displays, and prevents individuals from adopting certain decision processes (Reference Glöckner and BetschGlöckner & Betsch, 2008b; Reference Johnson, Schulte-Mecklenbeck and WillemsenJohnson et al., 2008; Reference Norman, Schulte-Mecklenbeck, Glöckner and WittemanNorman & Schulte-Mecklenbeck, 2010; Reference Franco-Watkins and JohnsonFranco-Watkins & Johnson, 2011). For instance, Reference Franco-Watkins and JohnsonFranco-Watkins & Johnson (2011) propose the aforementioned decision-moving window paradigm and compare it with both the eye-tracking and mouse-tracing paradigms in a risky-choice experiment, by pointing out that: ‘choice of the riskier gamble in a pair seemed to increase for the DMW [decision-moving window] relative to MT [mouse-tracing], and to some degree also compared to basic ET [eye-tracking]’.Footnote 3 Our experiment makes use of the mouse-tracing method, but in a different way and for different purposes with respect to the existing literature. First, as discussed above, the aim of this paper is not to investigate the nature of the decision processes naturally followed by individuals, but the impact of the different decision patterns (ABS versus CBS) that we induce subjects to follow. The mouse-tracing method is instrumental to this research question, in that its primary purpose is not to infer information acquisition patterns, but to serve as a treatment variable aimed at inducing different choice procedures. Specifically, different specifications of the mouse-tracing method are used to induce ABS and CBS procedures. Second, the mouse-tracing method is used in both our main treatments. This implies that even though the mouse-tracing paradigm influences the way in which individuals make decisions, it should not invalidate our between-treatment comparison, thanks to the ceteribus paribus condition.
From a methodological point of view, our work also relates to Reference Reeck, Wall and JohnsonReeck et al. (2017), who propose an experiment in which subjects are induced to use integrative vs comparative search strategies when making choices over time. They find that encouraging subjects to search in different ways affects their intertemporal choices.
2 Method
Subjects
A total of 226 subjects were recruited from a university database of students.Footnote 4 The design of the experiment is between-subject. A total of 76 subjects were assigned to the ABS treatment, 72 subjects to the CBS treatment, and 78 subjects to a Baseline treatment, which we describe below. The experiment took place at the Cognitive and Experimental Economics Laboratory (CEEL) of the University of Trento on the 6th of April 2017 (ABS and Baseline), 13th of June 2017 (CBS), 28th of September 2017 (ABS, CBS, and Baseline), 22nd of May 2018 (ABS, CBS, and Baseline), and 13th-14th of November 2018 (ABS, CBS, and Baseline). The software used in this experiment was designed by the authors of the paper and the CEEL manager Mr. Marco Tecilla.
Experimental Design
The experimental design consists of two tasks. Task 1 – which is common across treatments – elicits experimental subjects’risk preferences by using the well-known ‘Bomb Risk Elicitation Task’ (BRET) proposed by Reference Crosetto and FilippinCrosetto & Filippin (2013), which is fully outlined in the supplement.
Task 2, on the other hand, consists of a number of lottery choice problems. Every choice problem in Task 2 is a set of lotteries, which is presented to subjects in one screenshot. Subjects are asked to select their most preferred lottery within a time limit. To induce an ABS procedure, we designed a treatment in which at every choice problem information is hidden and subjects are faced with several buttons – one for each lottery available at that choice problem. In order to access information, subjects have to click the button corresponding to the lottery they intend to explore, and the software automatically reveals the prizes and the corresponding probabilities of that particular lottery only. To explore some other lottery in the same choice problem, subjects have to repeat the same operation by clicking on the button corresponding to the lottery they intend to explore, and the software automatically hides the prizes and corresponding probabilities of the previously explored lottery and shows the prizes and corresponding probabilities of the lottery subjects have subsequently clicked on. Consistently with the idea of an ABS procedure, in this treatment – which we labelled ‘ABS’ – subjects are therefore encouraged to analyse the prizes and the corresponding probabilities of a certain lottery before exploring the next lottery. Figure S1 in the supplement provides an example of a screenshot.
In contrast, to induce a CBS procedure, we designed a treatment in which – just like in the ABS treatment – every choice problem is presented in one screenshot and information is initially hidden. However, unlike in the ABS treatment, subjects are given the opportunity to explore the feasible set of lotteries by uncovering one prize (and its corresponding probability) at a time. Specifically, in order to access information, subjects have to click on the prize and corresponding probability they intend to explore, and the software reveals that prize only (and its corresponding probability) of all lotteries available at that particular choice problem. To explore some other prize-probability pair in the same choice problem, subjects have to repeat the same operation by clicking on the prize-probability pair they intend to explore, and the software automatically hides the previously explored prize-probability pair and shows the prize-probability pair that they have subsequently clicked on. Consistently with the idea of a CBS procedure, in this treatment – which we called ‘CBS’ – subjects are therefore encouraged to examine one prize-probability pair across lotteries before exploring the next prize-probability pair. Figure S2 illustrates an example of a screenshot and remark 1 in the supplement further discusses the features of the CBS treatment.
In both the ABS and CBS treatments subjects are free to explore a choice problem as they wish, subject to the treatment-specific restrictions outlined above. That is, they can explore the pieces of information in the order that they want, by uncovering the same item more than once within the time limit. Unlike in framing experiments, the prizes and corresponding probabilities of the available lotteries in our experiment are framed in the exact same way in the two treatments. Therefore, the only difference between the ABS treatment and the CBS treatment is the way in which subjects are induced to explore the choice problems. We acknowledge that our design does not force a subject assigned to the ABS (resp., CBS) treatment to use an ABS (resp., CBS) procedure. However, we believe that it is reasonable to assume that the ABS treatment makes the use of an ABS procedure more natural than the CBS treatment and, conversely, the CBS treatment makes the use of a CBS procedure more natural than the ABS treatment.
In order to have a third standard of comparison, we designed a third treatment – which we called ‘Baseline’. In the Baseline treatment, subjects can see all the information available at once at any point in time and, as such, they are not restricted in the way in which they explore the feasible set of lotteries. Figure S3 in the supplement provides an example of a screenshot.
Lottery Dataset
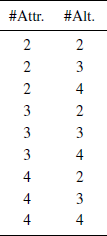
Within each treatment we varied the complexity level of a choice problem, where by complexity we mean both the number of prizes and corresponding probabilities a lottery is made of (attribute-based complexity) and the number of lotteries comprising a choice problem (alternative-based complexity).Footnote 5 In particular, for each complexity dimension, we considered three values (either two, three, or four), so that overall subjects were faced with choice problems of 3 × 3 = 9 different complexity levels (see Table 1). Subjects were asked to solve two choice problems for every complexity level within each treatment (i.e., 9 × 2=18 problems in total) and had 40 seconds at most to solve each choice problem.
Table 1: Attribute-based and alternative-based complexity in the experiment.
One of our objectives was to abstain from making assumptions about the exact shape of the experimental subjects’ risk preferences. For this reason, we constructed a dataset of lotteries that have the property that, for a given mean return, the lotteries exhibit increasing levels of risk. By a lottery L ′ being more risky than some other lottery L, we mean that (i) lotteries L and L ′ have the same mean return and (ii) lottery L ′ is obtained by adding zero-mean noise to L. An implication of this approach is that any risk-averse individual always prefers the safer lottery L over the riskier lottery L ′, irrespective of the extent to which they are risk averse.Footnote 6 Tables S3, S4, and S5 in the supplement display the constructed dataset of lotteries with two, three, and four prizes (and corresponding probabilities), respectively, that we have used in the experiment. All constructed lotteries have an expected value of 6, the minimum prize is 0, and the maximum prize is 12.
Choice-Problem Design
To generate the (eighteen) choice problems of Task 2, for each subject in each treatment lotteries were drawn at random without replacement from the constructed lottery datasets. Furthermore, the lottery datasets used to generate the choice problems were common across treatments. This means that the ex ante probability that a subject faces the very same choice problem at the very same point in the sequence is the same both within and across treatments. This feature of the experimental design rules out the possibility that our results are influenced by order effects, and enables to make meaningful comparisons between treatments.
The way in which the lotteries were arranged on a screenshot was also randomised in all treatments. This means that within each choice problem the – say – safest lottery has an equal chance of being located anywhere on a screenshot. The constructed choice problems had also the property that they contained lotteries with the same number of prize-probability pairs (either two, three, or four).
Importantly, in all treatments of the experiment, the prizes (and the corresponding probabilities) of each lottery were arranged in descending order (i.e., the prize at the top of the list was the highest, the second price from the top was the second highest, and so on). The motivation behind this arrangement is that it simplifies the comparison of the lotteries within a choice problem relative to alternative arrangements, in which prizes are – for instance – randomly ordered. We observe that this feature of the experimental design is compatible with the fact that, as discussed above, lotteries are randomly arranged on a screenshot. We acknowledge that arranging the prizes from the highest to the lowest can potentially make the high prizes more salient due to ordering effects. However, we also note that this feature of the experimental design applies to all our treatments. Therefore, it is not obvious a priori the extent to which this ceteribus paribus condition can affect our results.
Implementation
Subjects were invited to the lab and asked to read the instructions.Footnote 7 Then an experimenter read them loudly. Subsequently, subjects were asked to first carry out Task 1 and then Task 2. In between Task 1 and Task 2, subjects were asked to play a ‘snake-like’ game and were rewarded according to their performance in the game.Footnote 8 After carrying out Task 2, subjects did a Cognitive Reflection Test (CRT), in which they were rewarded 30 euro cents for every correct answer. Finally, subjects completed an anonymous questionnaire, received feedback on their performance in Task 1, snake-like game, Task 2, and CRT, and were paid accordingly. Subjects earned a show-up fee of €3 plus the amount earned in the different tasks. In order to determine the earnings of Task 2, a choice problem was selected at random at the end of the experiment and the corresponding chosen lottery was ‘played’. Subjects could earn between a minimum of €3 to a maximum of €20.
3 Results
Risk Preferences
The analysis of Task 1 reveals that roughly 60% of the experimental subjects are risk-averse and the remaining ones are either risk-lover or risk-neutral, which is comparable with previous results.Footnote 9 Figure 1 displays the full distribution of risk preferences elicited via BRET across treatments.Footnote 10
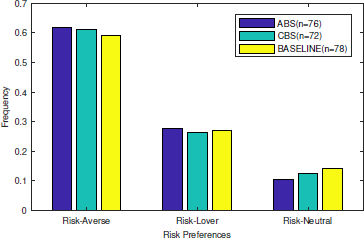
Figure 1: Distribution of the experimental subjects’ risk preferences elicited via BRET across treatments.
Choices
In order to measure the extent to which subjects made risky choices in a choice problem of Task 2, we constructed a choice riskiness index (CRI). Consider a generic choice problem A = {L 0,…,L n} containing n+1 lotteries that a subject faced in our experiment. Suppose that the lotteries in A are indexed so that lottery L i is riskier than lottery L j whenever j < i (i.e., the smaller the subscript of the lottery, the safer the lottery).Footnote 11 Suppose that a subject chooses lottery L k from choice problem A. Then, we defined the CRI associated with this choice as ![]() . We note that the CRI so defined lies in the unit interval and satisfies the following three properties: (i) is equal to zero if the experimental subject chooses the safest lottery available; (ii) is equal to one if the experimental subject chooses the riskiest lottery available; (iii) is increasing in the riskiness of the chosen lottery.Footnote 12
. We note that the CRI so defined lies in the unit interval and satisfies the following three properties: (i) is equal to zero if the experimental subject chooses the safest lottery available; (ii) is equal to one if the experimental subject chooses the riskiest lottery available; (iii) is increasing in the riskiness of the chosen lottery.Footnote 12
Results are summarised in Figure 2. Despite the choice analysis of Task 1 indicates that subjects tend to be averse to risk, they failed to choose the safest lottery 100% of the time, as the average CRI is always strictly greater than zero. The key result, however, is that while the average CRI in the ABS treatment is similar to the average CRI in the Baseline treatment (0.29 and 0.33, respectively), the average CRI in the CBS treatment is evidently larger (roughly 0.47). This reveals that subjects chose in a riskier way in the CBS treatment compared to the ABS and Baseline treatment. A Mann-Whitney test for independent samples indicates that the difference in average CRI is statistically significant at conventional levels (Table S6 in the supplementFootnote 13). Results are confirmed by further robustness checks consisting of a bootstrap analysis of independent samples t-test.
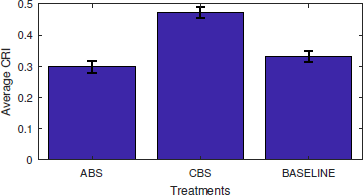
Figure 2: Average choice riskiness measured by CRI across treatments (with standard error mean bars).
We also examine whether subjects’ risk attitudes (elicited via BRET) play a role in influencing the extent to which subjects’s choice behaviour differs across treatments. In particular we decompose our sample into risk-averse and risk-lover subjects and investigate whether there is a treatment effect.Footnote 14 Statistical tests (Tables S7 and S8 in the supplement) reveal that the difference in average CRI between ABS and CBS treatments is significant at conventional levels for both risk-averse and risk-lover subjects, indicating that our results are robust to individual differences in risk attitudes elicited via BRET.
Figure 3 displays average CRI decomposed by complexity. Each point of the horizontal axis is a pair of numbers x, y that captures the complexity level of the corresponding class of choice problems, where x measures attribute-based complexity, and y measures alternative-based complexity, with x, y ∈ {2,3,4}. Figure 3 indicates that the general results outlined above continue to hold. That is, (i) in the CBS treatment subjects chose in a riskier way than in the other treatments; (ii) there is no systematic difference in subjects’ behaviour between ABS and Baseline. In addition, Figure 3 suggests that our findings are generally robust to variations in both attribute-based and alternative-based complexity. The tests (Table S9 in the supplement) confirm this finding by indicating that the difference in CRI between ABS and CBS treatments is statistically significant at choice problems of most complexity levels.

Figure 3: Average choice riskiness measured by CRI across treatments, disaggregated by attribute-based and alternative-based complexity (with standard error mean bars).
Information Search
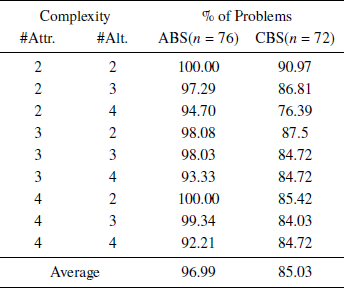
Table 2 reports the percentage of problems at which the experimental subjects looked up all the information available at least once in the ABS and CBS treatments for each complexity level.Footnote 15 Results indicate an overall tendency of subjects assigned to the ABS treatment to explore more information relative to subjects assigned to the CBS treatment. However, this tendency is never dramatically strong, as the average percentages of problems at which subjects fully explored the available information are 96.99% and 85.03% for the ABS and CBS treatments, respectively. This finding rules out the possibility that the results of our choice analysis are driven by subjects disregarding important pieces of information in either treatment. These results are confirmed by a between-treatment analysis of the cumulative percentage of choice problems at which subjects looked up at least a certain portion of the available information (see Tables S10, S11, and S12 in the supplement). We also checked whether there is a statistically significant difference between the frequency with which subjects look up all information available in the ABS and CBS treatments. Statistical tests (Tables S13, S14, and S15 in the supplement) indicate that this is not generally the case.
Table 2: Percentage of problems at which subjects looked up all information – ABS(n = 76) and CBS(n = 72).
The diagrams of Figures 4, 5, and 6 display the average number of lookups per lottery in the ABS treatment for choice problems with two, three, and four lotteries, respectively. Note that – within each diagram – information search data are further decomposed by complexity in terms of the number of prize-probability pairs lotteries are made of. Results indicate that at choice problems comprising two lotteries the number of lookups is evenly distributed between the riskier and the safer lottery and there is no clear pattern (Figure 4). In contrast, at problems comprising three or four lotteries (Figures 5 and 6), the experimental subjects looked up more often the safer lottery. Moreover, the average number of times they looked up a lottery seems to be negatively correlated with the riskiness of the lottery itself. We conducted a Pearson’s Chi-Square goodness-of-fit test aimed at studying the distribution of total lookups across lotteries characterised by different riskiness levels. Specifically, we compared the distribution of total lookups across lotteries with a benchmark consisting of a uniform distribution. The resulting evidence is weakly supportive, in the sense that we could reject the null hypothesis of no difference for certain complexity levels only (Table S16 in the supplement).
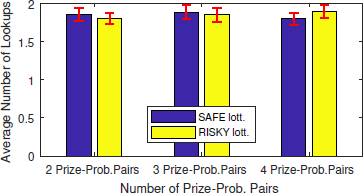
Figure 4: Average number of lookups per lottery (with standard error mean bars) – two-lottery problems, ABS(n = 76)
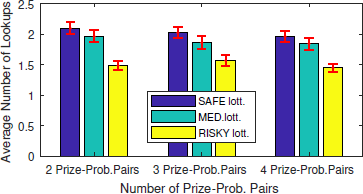
Figure 5: Average number of lookups per lottery (with standard error mean bars) – three-lottery problems, ABS(n = 76)

Figure 6: Average number of lookups per lottery (with standard error mean bars) – four-lottery problems, ABS(n = 76)
The diagrams in Figures 7, 8, and 9, on the other hand, display the average number of lookups per prize-probability pair in the CBS treatment for choice problems with two, three, and four prize-probability pairs, respectively. Note that – within each diagram – information search data are further decomposed by complexity in terms of the number of lotteries available within a choice problem. Results indicate that at choice problems comprising two prize-probability pairs subjects looked up more often the high prize (Figure 7). Figures 8 and 9 suggest that at choice problems comprising three and four prize-probability pairs, subjects looked up more often the second-highest prize, followed by the highest/second-lowest prize, with the lowest prize being explored the least number of times. We conducted a Pearson’s Chi-Square goodness-of-fit test aimed at examining the distribution of the total number of lookups across prize-probability pairs. In particular, like for the ABS treatment, we compared the distribution of the total number of lookups across prize-probability pairs with a benchmark consisting of a uniform distribution. We could reject the null hypothesis of no difference at problems of all complexity levels, indicating that subjects systematically explored more often the highest/second-highest prize (Table S17 in the supplement).

Figure 7: Average number of lookups per prize-prob. pairs (with standard error mean bars) – two-prize problems, CBS(n = 72)
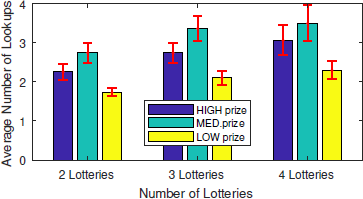
Figure 8: Average number of lookups per prize-prob. pairs (with standard error mean bars) – three-prize problems, CBS(n = 72)
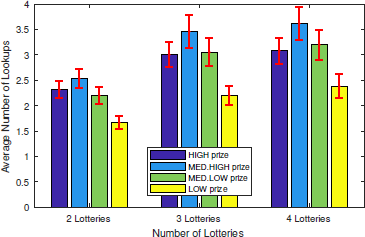
Figure 9: Average number of lookups per prize-prob. pairs (with standard error mean bars) – four-prize problems, CBS(n = 72)
Robustness Checks
Table 3 presents the summary statistics of the individual characteristics of this study’s experimental subjects, such as gender, age, CRT score, and BRET (number of collected boxes). Consistently with existing evidence, we find that female subjects tend to be more risk-averse (Reference Croson and GneezyCroson & Gneezy, 2009) and score worse in the CRT (Reference FrederickFrederick, 2005) than male subjects.Footnote 16 We also detect a positive correlation between BRET and CRT scores implying that subjects that correctly answer relatively many questions in the CRT are less risk-averse, which is also in line with previous results (Reference Cueva, Iturbe-Ormaetxe, Mata-Pérez, Ponti, Sartarelli, Yu and ZhukovaCueva et al., 2016)Footnote 17, and identify no age effects (see Table S18 in the supplement).Therefore, a potential issue in our experiment could given by the fact that subjects in the ABS treatment chose in a safer way than subjects in the CBS treatment, simply because of gender imbalances across treatments. Statistical tests (Tables S19 and S20 in the supplement) confirm that the differences in CRI between ABS and CBS treatments are statistically significant at 1% level for both female and male subjects, respectively, indicating that our results are robust to gender effects.
Table 3: Experimental subjects’ individual characteristics – Descriptives.

4 Discussion
We conduct a between-subject lottery-choice experiment aimed at examining whether inducing individuals to use ABS or CBS procedures has an effect on the outcome of their decision, by implementing a modification of the mouse-tracing paradigm. By controlling for risk preferences and CRT, we find that inducing characteristic-wise search systematically makes individuals choose riskier options. Our results are robust to variations in the complexity of the choice problem and gender effects. The information search analysis reveals that subjects (i) consistently look up all the available information when induced to use both ABS and CBS procedures, (ii) tend to look up more often the safest lottery when induced to use an ABS procedure, and (iii) systematically look up more often the best outcomes when induced to use a CBS procedure.
By combining the choice and information search analyses, the following picture tends to emerge. When not induced to search in any particular way, subjects typically use a compensatory procedure. A compensatory (resp., noncompensatory) choice procedure is a procedure according to which individuals make (resp., avoid) tradeoffs between different characteristics (Reference Payne, Bettman and JohnsonPayne et al., 1993). This observation is supported by the fact that (a) there is no systematic difference in the way in which subjects choose in the ABS and Baseline treatment, (b) subjects tend to look up more often the safer lotteries in the ABS treatment, which indicates that subjects explore information in a way that is consistent with their risk preferences elicited via BRET, and (c) existing JDM literature shows that individuals tend to rely on compensatory choice procedures when dealing with risky choice (Reference Birnbaum and LaCroixBirnbaum & LaCroix, 2008; Reference Ayal and HochmanAyal & Hochman, 2009; Reference Glöckner and HerboldGlöckner & Herbold, 2011).Footnote 18 In contrast, when subjects are induced to use CBS procedures, their behaviour evidently changes in terms of both information search and choice. In particular, inducing characteristic-wise search makes the best outcomes more salient, which is evidenced by the fact that subjects systematically explored more often the highest/second-highest prizes in the CBS treatment. Given that in our experiment the best outcomes are associated with the riskiest lotteries, subjects end up choosing riskier options. Therefore, unlike in the ABS treatment, in the CBS treatment subjects’ information search and choice behaviour is consistent with a noncompensatory procedure, such as the ‘max−max’ rule.
To the best of our knowledge, our experimental design is novel and, therefore, our results are necessarily exploratory. We can nonetheless draw a few conclusions from our experiment. First, if the extent to which individuals make risky choices can be manipulated by inducing them to search in certain ways – like our experiment indicates -, then our results are of significant importance to the design of decisions that involve risk. For example, the JDM literature on framing has shown that manipulations of the reference point typically result in preference reversals (Reference KühbergerKühberger, 1998). Our results complement this literature by indicating that – likewise – manipulating the procedure that subjects use to search may result in subjects making riskier/safer choices.
Second, in rational and boundedly rational models of choice, the way in which attention is distributed over prizes and probabilities is an implication of the choice procedure used by the decision-maker. For example, for a decision-maker using a weighted additive model, the prizes (and corresponding probabilities) approximately receive an equal amount of attention. In contrast, alternative classes of models, such as drift diffusion models (Reference Krajbich, Armel and RangelKrajbich et al., 2010), assume that attention is a primitive element that ‘plays an active role in constructing the decision’ (Reference Orquin and Mueller LooseOrquin & Mueller Loose, 2013). From a conceptual point of view, our experiment provides evidence in support of the latter view, because it directs subjects’ attention by inducing them to search in certain ways, and shows that such manipulation effectively influences choices.
Third, online shopping websites, such as comparison shopping websites and product configurators, induce consumers to use certain choice procedures. For example, a comparison shopping website typically requires consumers to specify a set of desirable attributes that their favourite product should possess. Consistently with a CBS procedure, the comparison shopping website shortlists the set of available products by eliminating all those alternatives that do not meet the specified requirements. Given that our experiment provides evidence that inducing individuals to use certain choice procedures has an effect on the outcome of their decisions, our findings may be relevant to economists, policy-makers, and financial regulatory bodies too (Reference Thaler and SunsteinThaler & Sunstein, 2008).
Our work can be extended in at least three ways. First, as discussed in the methods section, in all treatments of our experiment, prizes (along with corresponding probabilities) are arranged in descending order. In the light of the interpretation offered above, this feature of the experimental design may have made the high prizes more salient in the CBS treatment leading subjects to make riskier choices (because in our experiment high prizes are associated with riskier lotteries). One way of verifying whether this interpretation is correct would be to re-run the same experiment by manipulating such ordering. For example, an intriguing modification could be to arrange the prizes in ascending order. It could well be the case that subjects still use a noncompensatory procedure in the CBS treatment, but – instead of using a max−max-like rule – they switch to a max−min-like rule, because arranging the prizes from the lowest to the highest makes the low prizes more salient and, therefore, subjects end up choosing the safest options.
Second, we would like to run further variations of our experiment, such as changing the risk-preference elicitation method and implementing a within-subject design. In particular, as far as the latter modification is concerned, it would be interesting to investigate whether inducing subjects to go through both treatments reduces the magnitude of the identified effect (Reference DruckmanDruckman, 2001).
Third, as discussed above our experiment has relevant policy applications to online retailing. For example, the UK Financial Conduct Authority states: ‘Price comparison websites have changed the way consumers shop for insurance and the way firms design, price and distribute their products. They can save people time and provide them with more choice – however, we want to be sure that consumers aren’t being misled into believing they are buying the best product when they may not be.’ (Financial Conduct Authority, 2013). Given the real-world importance of our results, we intend to investigate whether inducing individuals to use certain choice procedures affects the outcome of their decisions in the context of a field experiment.


