


Daily nutrient intake has been correlated with muscle enzyme activities in animals (Cassar-Malek et al. Reference Cassar-Malek, Hocquette, Jurie, Listrat, Jailler, Bauchart, Briand and Picard2004) and man (Helge & Kiens, Reference Helge and Kiens1997), and with intramuscular fat and glycogen contents in animals (Pethick & Rowe, Reference Pethick and Rowe1996; Gondret et al. Reference Gondret, Lebas and Bonneau2000). Regulation of muscle oxidative enzyme activities and muscle composition also depends on the supply of individual macronutrients (Hocquette et al. Reference Hocquette, Ortigues-Marty, Pethick, Herpin and Fernandez1998; Geelen et al. Reference Geelen, Blázquez, Geelen, Sloet van Oldruitenborgh-Oosterbaan and Beynen2001; Gondret & Lebret, Reference Gondret and Lebret2002). Apart from variation in daily nutrient supply, within-day variation in the supply of different nutrients (i.e. synchrony) may induce these effects. Asynchronous absorption patterns can be induced by either a separated intake of protein and carbohydrates in time (e.g. dissociated diets) or by supplying ingredients with different kinetics of digestion and absorption. In preruminants, for example, asynchronous absorption of glucose and amino acids may result from differences in passage behaviour of clotting v. non-clotting dietary ingredients (Guilloteau et al. Reference Guilloteau, Toullec and Grongnet1986; Verdonk et al. Reference Verdonk, Gerrits, Beelen, Jansman, Lobley, White and MacRae1999). Applying a theoretical approach, we separated the intake of glucose and amino acids within the day (i.e. across meals) in heavy preruminant calves (Van den Borne et al. Reference Van den Borne, Verstegen, Alferink, Giebels and Gerrits2006b ). Surprisingly, and in contrast to similar investigations in pigs (JJGC Van den Borne, JW Schrama, MJW Heetkamp, MWA Verstegen and WJJ Gerrits, unpublished results), increased separation of the amino acid and glucose availability within a day decreased whole body heat production ( − 9 %), and increased whole body fat deposition (+59 %), in heavy preruminant calves (Van den Borne et al. Reference Van den Borne, Verstegen, Alferink, Giebels and Gerrits2006b ). Muscle energy metabolism may contribute to these changes as it accounts for about 20 % of the daily heat production in growing farm animals (Ortigues et al. Reference Ortigues, Martin, Durand and Vermorel1995). Therefore, muscle energy metabolism may help to spare energy in case of an asynchronous supply of protein and lactose. Effects of nutrient synchrony on the energy metabolism and composition of muscles may also have implications for muscle function, meat quality and development of metabolic disorders in calves.
The regulation of muscle energy metabolism is well documented (e.g. Hocquette et al. Reference Hocquette, Ortigues-Marty, Pethick, Herpin and Fernandez1998). In non-growing man, oxidative enzyme activities in muscle are positively correlated with whole body heat production (Zurlo et al. Reference Zurlo, Nemeth, Choksi, Sesodia and Ravussin1994; Doucet et al. Reference Doucet, Tremblay, Simoneau and Joanisse2003). It is not known if a similar relationship exists in growing animals and if increased oxidative enzyme activities in muscle are associated with increased whole body heat production. In addition, it is unknown to what extent the demand for energy in muscle, i.e. for physical activity, drives the activity of the enzymes and hence regulates muscle energy metabolism in farm animals.
The aim of this study was therefore to gain insight in the regulation of whole body heat production by assessing the effects of nutrient synchrony and physical activity on muscle enzyme activities and muscle composition in heavy preruminant calves. Results on whole body protein and energy utilization have been presented elsewhere (Van den Borne et al. Reference Van den Borne, Verstegen, Alferink, Giebels and Gerrits2006b ). It is hypothesized that oxidative enzyme activities decrease and intramuscular fat content increases with decreasing nutrient synchrony in preruminant calves. Oxidative enzyme activities in skeletal muscle were expected to correlate with whole body heat production.
Materials and methods
Animals, housing and experimental treatments
Thirty-six male, preruminant calves of the Holstein Friesian breed were used. The experimental treatments consisted of six degrees of nutrient synchrony (SYN 1 to 6) at each of two meal sequences (SEQ A and B) in a 6 × 2 factorial arrangement. The experiment was originally designed to study effects of SYN and SEQ on nutrient utilization (Van den Borne et al. Reference Van den Borne, Verstegen, Alferink, Giebels and Gerrits2006b ). Two identical respiration chambers were available and calves were studied in eighteen trials of two calves each. Individual calves of approximately 130 kg body weight (BW) were assigned to an experimental treatment. The degree of nutrient synchrony was varied by a step-wise exchange of protein and lactose between the two daily meals (on a calculated digestible energy basis) which resulted in an equal distribution of digestible energy intake within a day (Table 1). Calves at SYN 1 received two identical meals daily. Calves at the most asynchronous treatment, SYN 6, received 85 % of the daily protein supply in one meal and the remaining 15 % in the other meal. A high protein meal was fed in the morning and a high lactose meal was fed in the evening for calves at SEQ A. For calves at SEQ B, this sequence was reversed. Allocation of calves to SYN and SEQ was balanced in time across trials.
Table 1 Experimental treatments; division of the nutrient intake (g/kg BW0·75) over two daily meals
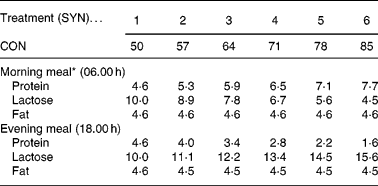
CON, contribution of the high protein meal to the daily protein supply (50 % = two identical, balanced meals; 100 % = all daily protein in one meal); SYN, degree of nutrient synchrony.
* Treatments are presented for meal sequence A. For meal sequence B, the nutrient intake in the morning and evening meal was reversed.
Calves were fed the experimental diets for five weeks. During the first four weeks of study, calves were individually housed in cages (1·85 × 0·75 m) in a climate-controlled stable. Then they were moved to the respiration chambers where whole body heat production was measured during one week. The experiment complied with the Dutch law regarding the use of experimental animals.
Diets and feeding
Calves were fed according to their metabolic BW (BW0·75), adjusted daily for a projected daily gain of 1000 g. Metabolizable energy requirements for maintenance (MEm) were assumed to be 460 kJ/d per kg BW0·75 (Van Es et al. Reference Van Es, Nijkamp, Van Weerden, Van Hellemond, Blaxter, Kielanowski and Thorbek1967; Gerrits et al. 1996), and the feeding level was 2·0 × MEm. Two basal milk replacers were produced for the most asynchronous treatment (SYN 6). All other experimental treatments were realized by mixing the basal milk replacers in the appropriate ratio to create the experimental contrast presented in Table 1. The detailed nutrient and ingredient composition of the basal milk replacers are given by Van den Borne et al. (Reference Van den Borne, Verstegen, Alferink, Van Ass and Gerrits2006b ). Briefly, diets included whey protein concentrate, lactose and coconut and soya oil as main ingredients. Diets provided on a daily basis 20·5 % crude protein, 20·8 % crude fat and 44·9 % lactose. Daily intakes of all nutrients and dietary ingredients were similar between treatments. Milk replacer was reconstituted with water (140 g/l) and supplied at a temperature of about 40°C in a bucket. Roughage was not provided. Calves were fed individually at 06.00 h and 18.00 h, and were allowed 15 min to consume the meal. Feed intake was measured twice daily and BW was measured weekly throughout the experiment. Average daily gain and feed conversion ratio were calculated over the 5 week experimental period.
Measurement of whole body heat production and physical activity
During the fifth week of the study, gas exchange (O2, CO2 and CH4) was continuously measured during 7 d in 6 min intervals by indirect calorimetry for estimation of whole body heat production. From the gaseous exchange, heat production (Htot) was calculated according to the formula of Brouwer (Reference Brouwer and Blaxter1965) and the RQ was calculated as the CO2 production divided by the O2 consumption. Posture of calves was measured every minute by IR beam interruption. Physical activity was recorded with a radar–Doppler device according to the method described by Wenk & Van Es (Reference Wenk and Van Es1976). From these measurements, heat production associated with physical activity (Hact) and heat production corrected for physical activity (Hcor) were separately estimated (Van den Borne et al. Reference Van den Borne, Verstegen, Alferink, Giebels and Gerrits2006a ). The kinetics of whole body heat production were described by calculation of the hourly means of Htot, Hcor and Hact for each calf. The circadian maximum and minimum were defined for each calf as the highest and lowest hourly means within a day, respectively. The amplitudes of Htot, Hcor and Hact were subsequently calculated as the difference between the circadian maximum and minimum for each calf. For calculating circadian means of heat production by the formula of Brouwer (Reference Brouwer and Blaxter1965), the nitrogen excretion was assumed to be constant throughout the day.
Measurement of muscle composition and enzyme activities
After five weeks on the experimental treatment, calves were transported to the slaughterhouse (20 min) and killed at 13.00 h (i.e. 7 h after the morning meal) by stunning and exsanguination. Within 15 min post-slaughtering, samples of the M. Rectus Abdominis (RA; oxido-glycolytic muscle) and M. Semitendinosus (ST; glycolytic muscle) were removed. The samples of skeletal muscle were immediately trimmed of visible fat and connective tissue. Samples were then cut into pieces, immediately frozen in liquid N2 and stored at − 80°C pending analyses. Samples for crude fat analysis (about 30 g for each muscle) were not frozen in liquid N2, but ice-chilled and subsequently stored at − 20°C pending analyses.
Protein (Bradford, Reference Bradford1976) and DNA (Labarca & Paigen, Reference Labarca and Paigen1980) contents were measured in muscle homogenates. Activity of the oxidative enzyme citrate synthase (CS; EC 4.1.3.7), which is involved in the substrate flux through the tricarboxylic acid cycle, was determined in sonicated homogenates by measuring the rate of initial reaction at 412 nm by means of the DTNB (5·5′-dithiobis(2-nitrobenzoate)) method as described by Shepherd & Garland (Reference Shepherd and Garland1969). Activity of the oxidative enzyme cytochrome-c-oxidase (COX; EC 1.9.3.1), which is involved in the substrate flux through the respiratory chain, was determined in sonicated homogenates by measuring the oxidation of reduced cytochrome-c as described by Van Hinsberg et al. (Reference Van Hinsberg, Veerkamp and Bookelman1978). Activities of CS and COX were expressed in μmol CoA liberated per min per g protein and in μmol cytochrome-c oxidized per min per g protein at 25°C respectively. Activity of the glycolytic enzyme lactate dehydrogenase (LDH; EC 1.1.1.2.7), which catalyzes the formation of lactate from pyruvate, was determined as described by Ansay (Reference Ansay1974). LDH activity was expressed in μmol NADH oxidized per min per g protein. Glycogen content was measured by the method of Carroll et al. (Reference Carroll, Longley and Roe1955). Briefly, glycogen was extracted from the tissue by homogenization with 5 % trichloroacetic acid solution, precipitated from the extract by 95 % ethanol and determined with the anthrone reagent in a colorimeter at 620 nm. Fat content was measured in muscle tissue after freeze-drying according to ISO 6492 (International Organization for Standardization, 1999). Ratios for CS:LDH, COX:LDH (relative enzyme activities), protein:DNA (indicator for muscle fibre size) and COX:CS (indicator for the biochemical properties of the mitochondria) were calculated.
Statistical analysis
The effects of nutrient synchrony and the interaction between nutrient synchrony and meal sequence on muscle traits and whole body energy metabolism traits were analysed by linear regression analysis, using the general linear model procedure of the SAS statistical software package version 9.1 (Statistical Analysis Systems Institute, Cary, NC, USA). The degree of nutrient synchrony was included as a regressor (Default 1).
where Y ij = dependent variable over the whole period, μ = average intercept, β1 = effect of degree of nutrient synchrony, expressed as percentage of the daily protein intake in the high protein meal, β2i = interaction between degree of nutrient synchrony and meal sequence i, S i = fixed effect of meal sequence i, X j = degree of nutrient synchrony (expressed as percentage of the daily protein intake in the high protein meal) for calf j, ɛ ij = error term, i = 1, 2, and j = 1, …, 18.
Pearson correlation coefficients were calculated for relationships between muscle energy metabolism traits within each muscle, for each trait between the two muscles and between muscle energy metabolism traits and whole body energy metabolism traits. Traits for the two muscles were compared by pairwise comparisons.
Results
Animal performance
Two calves were excluded from analysis, because of feed refusals or illness. The initial BW of the calves was 128 (sem 1·7) kg and average daily gain during the 5 week experimental period was 885 (sem 27·1) g. Average daily gain was lower (P < 0·05) for calves at SYN 5 and 6 (729 and 815 g respectively) than for calves at SYN 1–4. Calves at SYN 1–4 had a similar daily gain (on average 945 g). Feed intake did not differ between treatments and consequently the feed to gain ratio was higher (P < 0·01) for calves at SYN 5 and 6 (2·56 and 2·48 respectively) than for calves at the other treatments (on average 2·02). However, calves at the two most asynchronous treatments had a lower nutrient digestibility. The consequently lower digestible nutrient intake in calves at SYN 5 and 6 complicated interpretation of the results from SYN 1 to 6. Linear regression was therefore also performed for SYN 1 to 4 (n 22) separately, because calves at those treatments had identical digestible nutrient intakes.
Muscle enzyme activities
In RA, activities of COX and CS increased (P = 0·048) and tended to increase (P = 0·075), respectively, with decreasing nutrient synchrony (SYN 1–4; Table 2). Ratios of enzyme activities were not affected by nutrient synchrony. In ST, enzyme activities were not affected by nutrient synchrony (Table 3). The sequence of the high protein and high carbohydrate meals did not affect enzyme activities.
Table 2 Effects of nutrient synchrony on muscle enzyme activities and muscle composition in M. Rectus Abdominis of heavy preruminant calves (Values are means for treatments with their standard errors; n 5 per treatment for SYN 1 and 2, and n 6 per treatment for SYN 3–6)
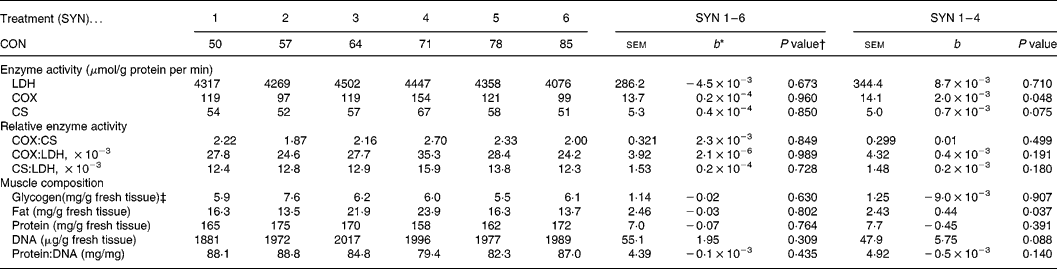
CON, contribution of the high protein meal to the daily protein supply (50 % = two identical, balanced meals; 100 % = all daily protein in one meal); SYN, degree of nutrient synchrony; LDH, lactate dehydrogenase; COX, cytochrome-c-oxidase; CS, citrate synthase.
* Regression coefficient (y = a+b × x), representing the change in response parameter per % increase of the contribution of the high protein meal to the daily protein supply.
† Probability for test if the regression coefficient (b) equals 0. Effects of meal sequence and interactions between meal sequence and degree of nutrient synchrony were non-significant and were therefore excluded from the model.
‡ An interaction between CON and the meal sequence on muscle glycogen content was found (P = 0·023).
Table 3 Effects of nutrient synchrony on muscle enzyme activities and muscle composition in M. Semitendinosus of heavy preruminant calves (Values are means for treatments with their standard errors; n 5 per treatment for SYN 1 and 2, and n 6 per treatment for SYN 3–6)

CON, contribution of the high protein meal to the daily protein supply (50 % = two identical, balanced meals; 100 % = all daily protein in one meal); SYN, degree of nutrient synchrony; LDH, lactate dehydrogenase; COX, cytochrome-c-oxidase; CS, citrate synthase.
* Regression coefficient (y = a+b × x), representing the change in response parameter per % increase of the contribution of the high protein meal to the daily protein supply.
† Probability for test if the regression coefficient (b) equals 0. Effects of meal sequence and interactions between meal sequence and degree of nutrient synchrony were non-significant and were therefore excluded from the model.
‡ An interaction between CON and the meal sequence on muscle glycogen content was found (P = 0·007).
Muscle composition
Intramuscular fat content increased in RA (P = 0·037) with decreasing nutrient synchrony at an identical digestible nutrient intake (Table 2), but nutrient synchrony did not affect intramuscular fat content in ST (Table 3). The fat content was substantially higher (P < 0·001) in RA (18·9 mg/g tissue) than in ST (6·5 mg/g tissue). The sequence of the high protein and high carbohydrate meals did not affect intramuscular fat content.
Glycogen content in both muscles was not affected by nutrient synchrony (Tables 2 and 3), but a positive correlation between glycogen content in RA and ST was found (r 0·72; P < 0·001). Glycogen content averaged 6·24 mg/g in RA and 7·01 mg/g in ST. An interaction between SEQ and SYN was found for intramuscular glycogen content in both muscles (P < 0·05), indicating that glycogen content was higher after feeding the high protein diet than after the high lactose diet. The difference in glycogen content between meal sequences was more pronounced at SYN 2 (3·08 mg/g in RA and 6·08 mg/g in ST) and SYN 3 (4·63 mg/g in RA and 4·96 mg/g in ST) than at the other treatments.
Whole body heat production
Average heat production and Hcor decreased with decreasing nutrient synchrony (P < 0·05), while the RQ increased (P = 0·028; Table 4). A detailed description of whole body energy partitioning and protein deposition is presented and discussed elsewhere (Van den Borne et al. Reference Van den Borne, Verstegen, Alferink, Giebels and Gerrits2006b ). The maxima of the circadian patterns of Htot and Hcor decreased with decreasing nutrient synchrony (P < 0·05), but the maximum of the circadian pattern of Hact was not affected by nutrient synchrony. The amplitudes of the circadian patterns of Htot, Hcor and Hact were not affected by SYN. The sequence of the high protein and high carbohydrate meals did not affect any of the traits of whole body energy metabolism.
Table 4 Effects of nutrient synchrony on whole body energy metabolism (kJ/d per kg BW0·75) in heavy preruminant calves (Values are means for treatments with their standard errors; n 5 per treatment for SYN 1 and 2, and n 6 per treatment for SYN 3–6)
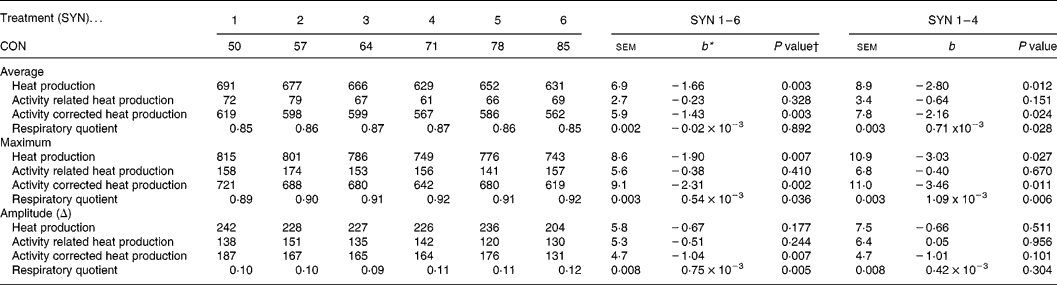
CON, contribution of the high protein meal to the daily protein supply (50 % = two identical, balanced meals; 100 % = all daily protein in one meal); SYN, degree of nutrient synchrony.
* Regression coefficient (y = a+b × x), representing the change in response parameter per % increase of the contribution of the high protein meal to the daily protein supply.
† Probability for test if the regression coefficient (b) equals 0. Effects of meal sequence and interactions between meal sequence and degree of nutrient synchrony were non-significant and were therefore excluded from the model.
Correlations within muscle
In both muscles, CS and COX activities were positively correlated (r 0·35–0·36; P < 0·05). Intramuscular fat content showed a positive correlation (r 0·49; P < 0·01) with COX (and COX:LDH) in RA (data not shown).
Correlations between muscle energy metabolism and whole body energy metabolism
The decreased Htot and Hcor with decreasing nutrient synchrony did not correspond with the increased (or unaffected) oxidative enzyme activities in muscle. In accordance, simple correlation analysis showed that average Htot, Hcor and Hact were not correlated with enzyme activities in RA (Table 5) and ST (data not shown). Intramuscular fat content in RA was negatively correlated with average Htot and Hcor.
Table 5 Pearson correlation coefficients between oxidative enzyme activities and muscle composition in M. Rectus Abdominis and whole body energy metabolism traits in heavy preruminant calves (n 22)
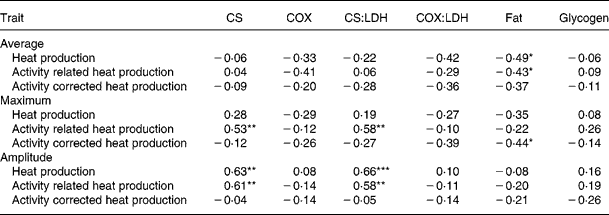
LDH, lactate dehydrogenase; COX, cytochrome-c-oxidase; CS, citrate synthase.
* P < 0·05; ** P < 0·01; *** P < 0·001.
The maximum of Hact and the amplitude of Htot and Hact increased with increasing CS activity in RA in preruminant calves, resulting in positive correlations (Table 5). In ST, oxidative enzyme activities were not related to the maxima and amplitudes of heat production traits (data not shown).
Discussion
Animal performance
Feeding more than 71 % of the daily protein in one meal and more than 68 % of the daily lactose in the other one (i.e. SYN 5–6) induced diarrhoea, which was indicated by a lower faecal dry matter content, a lower faecal pH and a lower nutrient digestibility (Van den Borne et al. Reference Van den Borne, Verstegen, Alferink, Giebels and Gerrits2006b ). The lower daily gain and higher feed to gain ratio for calves at SYN 5 and 6 were therefore likely due to a decreased digestible nutrient intake. Comparison of calves at SYN 1–4 allows studying the effects of nutrient synchrony at identical intakes of digestible nutrients. Therefore, this discussion focuses on treatments SYN 1–4.
Effects of nutrient synchrony on muscle enzyme activities
Although the quantity (Brandstetter et al. Reference Brandstetter, Picard and Geay1998; Cassar-Malek et al. Reference Cassar-Malek, Hocquette, Jurie, Listrat, Jailler, Bauchart, Briand and Picard2004) and the composition (Helge & Kiens, Reference Helge and Kiens1997; Geelen et al. Reference Geelen, Blázquez, Geelen, Sloet van Oldruitenborgh-Oosterbaan and Beynen2001; Cuvelier et al. Reference Cuvelier, Cabaraux, Dufrasne, Clinquart, Hocquette, Istasse and Hornick2006) of the daily feed supply are known to affect oxidative and glycolytic enzyme activities in muscles, this study is one of the first to describe the effect of within-day distribution of nutrient availability on muscle metabolism. Ortigues-Marty et al. (Reference Ortigues-Marty, Hocquette, Bertrand, Martineau, Vermorel and Toullec2003) found increased oxidative enzyme activities in muscle (ST) of preruminant calves when skimmed milk protein was replaced by soluble wheat and whey proteins. Feeding soluble wheat and whey proteins resulted in larger circadian fluctuations of the amino acid availability compared with skimmed milk protein. Therefore, it was suggested that a transiently high amino acid availability may require an increased capacity of oxidative enzymes in muscle to provide energy for protein synthesis when amino acids are available (Ortigues-Marty et al. Reference Ortigues-Marty, Hocquette, Bertrand, Martineau, Vermorel and Toullec2003). However, potential reasons for the affected oxidative capacity in the study of Ortigues-Marty et al. (Reference Ortigues-Marty, Hocquette, Bertrand, Martineau, Vermorel and Toullec2003) also include a lower intake of the skimmed milk diet than of the wheat and whey protein diet and the use of different dietary ingredients with different kinetics of fatty acid absorption (Petit et al. Reference Petit, Ivan and Brisson1988; Cruywagen et al. Reference Cruywagen, Brisson, Tremblay and Meissner1990; Ortigues-Marty et al. Reference Ortigues-Marty, Hocquette, Bertrand, Martineau, Vermorel and Toullec2003).
A decreased nutrient synchrony (i.e. increased circadian fluctuations in nutrient supply) also increased oxidative enzyme activities in RA in the current study (Table 2), but not in ST. Separating the availability of amino acids and glucose may have required temporarily high oxidative enzyme activities to provide energy for protein synthesis (see Ortigues-Marty et al. Reference Ortigues-Marty, Hocquette, Bertrand, Martineau, Vermorel and Toullec2003) or to oxidize excessively available amino acids or glucose. As net protein utilization was unaffected and fat deposition was increased (Van den Borne et al. Reference Van den Borne, Verstegen, Alferink, Giebels and Gerrits2006b ), temporarily increased rates of glucose and/or amino acid oxidation should be accompanied by decreased oxidation rates of oxidation during the remainder of the day.
It is noteworthy that nutrient synchrony only affected muscle enzyme activities in an oxidative muscle (RA), but not in a glycolytic muscle (ST). This corresponds with previous studies which demonstrated a higher response of oxidative (mitochondria-rich) than glycolytic muscles to nutrient supply (Cassar-Malek et al. Reference Cassar-Malek, Hocquette, Jurie, Listrat, Jailler, Bauchart, Briand and Picard2004; Jurie et al. Reference Jurie, Ortigues-Marty, Picard, Micol and Hocquette2006).
Effects of nutrient synchrony on muscle composition
Intramuscular fat content was almost threefold higher in RA than in ST, which agrees with the generally described higher fat content in oxidative than in glycolytic muscles (Gondret et al. Reference Gondret, Mourot and Bonneau1998; Hocquette et al. Reference Hocquette, Jurie, Ueda, Boulesteix, Bauchart and Pethick2003). The increased intramuscular fat content in RA with decreasing nutrient synchrony corresponds to an increased whole body fat deposition in these calves (Van den Borne et al. Reference Van den Borne, Verstegen, Alferink, Giebels and Gerrits2006b ) indicating that the extra fat is at least partly deposited in muscles. Intramuscular fat generally develops after abdominal, intermuscular and subcutaneous fat deposition (Vernon, Reference Vernon and Christie1981), which suggests that nutritional regulation of partitioning of fat into muscle is unlikely in relatively young animals (approximately 18 weeks of age). On the other hand, fat deposition in muscle may have been selectively stimulated by the increased glucose supply after a high lactose meal. Smith & Crouse (Reference Smith and Crouse1984) showed that glucose provides only 1–10 % of the acetyl units to in vitro lipogenesis in subcutaneous adipose tissue of steers, but 50–75 % of the acetyl units in the intramuscular adipocytes. This may be true for preruminants as well, thus providing an explanation for the effect of nutrient synchrony on intramuscular fat content of RA. However, care should be taken in extrapolating these results to the in vivo situation of preruminants, as they absorb much larger amounts of long-chain fatty acids and monosaccharides (glucose and galactose) than mature ruminants.
The intramuscular glycogen content was higher in both muscles after the high protein diet than after the high lactose diet, but interpretation of this interaction between SYN and SEQ on glycogen content is complicated by its non-linearity. The lower glycogen content when protein and carbohydrate intakes are further separated may be explained by a lower insulin response in more asynchronously fed calves (T Vicari, JJGC Van den Borne, WJJ Gerrits, Y Zbinden and JW Blum, unpublished results). This corresponds with human studies in which the insulin response as well as muscle glycogen accumulation was higher after a mixed protein and carbohydrate meal than after a carbohydrate meal (Zawadzki et al. Reference Zawadzki, Yaspelkis and Ivy1992; Van Loon et al. Reference Van Loon, Saris, Kruijshoop and Wagenmakers2000), but does not explain the low muscle glycogen content at the most synchronous treatment treatments.
Correlations within muscle
Cytochrome-c-oxidase activity was positively correlated with muscle composition in RA (i.e. intramuscular fat) in the current study. This relationship between an oxidative enzyme and muscle fat content in RA seems paradoxical, but similar results were obtained in growing rabbits (Gondret et al. Reference Gondret, Hocquette and Herpin2004) and steers (Hocquette et al. Reference Hocquette, Jurie, Ueda, Boulesteix, Bauchart and Pethick2003). A high fat deposition and a high fatty acid oxidation can go together as the result of a high fatty acid flux. Although the fat intake with the two daily meals did not differ between treatments, the degree of nutrient synchrony may have (temporarily) increased the fatty acid flux by affecting the kinetics of fat digestion and/or the partitioning of fatty acids to individual tissues.
Correlations between muscle enzyme activities and whole body energy metabolism
In human subjects, positive correlations between muscle enzyme activities and 24 h heat production or sleeping metabolic rate were found (Zurlo et al. Reference Zurlo, Nemeth, Choksi, Sesodia and Ravussin1994; Doucet et al. Reference Doucet, Tremblay, Simoneau and Joanisse2003). In the present study, however, average whole body heat production was not correlated with enzyme activities in RA and ST. Our initial hypothesis that the decreased whole body heat production with decreasing nutrient synchrony is associated with decreased muscle oxidative enzyme activities therefore has to be rejected. Oxidative enzyme activity in RA was positively correlated with the circadian maximum and amplitude of Hact in growing calves. A similar correlation was found with Htot, which can be explained by the high contribution of variation in Hact to variation in Htot.
The high feeding level in preruminant calves may explain why oxidative enzyme activity in muscle showed a better relationship with within-day variation in Hact than with average Htot. Apart from muscle, several other tissues contribute to whole body heat production. Feeding large amounts of nutrients results in a high diet-induced heat production predominantly caused by portal drained viscera and liver (Ortigues et al. Reference Ortigues, Martin, Durand and Vermorel1995). This may also explain the different results in growing calves and non-growing man. The diet-induced heat production usually contributes for 30 to 35 % to Htot in growing farm animals (Collin et al. Reference Collin, Van Milgen, Dubois and Noblet2001; Le Bellego et al. Reference Le Bellego, Van Milgen, Dubois and Noblet2001; Van Milgen et al. Reference Van Milgen, Noblet and Dubois2001), but only for 5 to 15 % to Htot in adult human subjects (Westerterp, Reference Westerterp2004). Consequently, the overall contribution of Hact and muscle energy metabolism to average Htot is likely to be higher in man than in calves. The individual housing conditions in the current study restricted the physical activity of calves, whereas calves under practical circumstances are housed in groups. Although group-housing only marginally increased Hact compared with individual housing as shown in pigs (Rijnen, Reference Rijnen2003), this may have contributed to the lack of correlation between oxidative enzyme activity and Htot in this study.
Oxidative enzyme activities in muscle were not correlated with the average Hact but only with the circadian fluctuations in Hact (maximum and amplitude) in preruminant calves. This may be explained by the measurement of enzyme activity, which truly reflects the maximum enzyme activity rather than the enzyme activity in vivo. Variation in fatty acid oxidation, for example, is not necessarily associated with variation in oxidative enzyme activities in muscle (Piot et al. Reference Piot, Veerkamp, Bauchart and Hocquette1998). Enzyme activities depend not only on the capacity of enzymes to convert substrates into new (co or end) products, but also on the availability of substrates. The availability of substrates for oxidative enzymes within a day is affected by nutrient supply, but also by particular energy requiring processes like physical activity. It can therefore be expected that the maximum oxidative enzyme activity is regulated by the kinetics of substrate availability rather than by the daily average substrate availability. Although the major aim of this study was to determine effects of variation in nutrient supply on muscle energy metabolism, it appeared that variation in Hact was positively correlated with CS activity in RA.
The positive correlation between physical activity and CS activity in muscle corresponds with results obtained in man (Rimbert et al. Reference Rimbert, Boirie, Bedu, Hocquette, Ritz and Morio2004), rats (Spangenberg et al. Reference Spangenberg, Augustsson, Dahlborn, Essén-Gustavsson and Cvek2005), pigs (Petersen et al. Reference Petersen, Henckel, Maribo, Oksbjerg and Sørensen1997) and steers (Jurie et al. Reference Jurie, Ortigues-Marty, Picard, Micol and Hocquette2006). Similarly, muscle CS activity was 23 % higher in group-housed calves than in individually housed calves (Ortigues-Marty et al. Reference Ortigues-Marty, Hocquette, Bertrand, Martineau, Vermorel and Toullec2003) which likely relates to increased physical activity. Previous studies have, however, not related the muscle enzyme activity to in vivo energy expenditure. Therefore, the current study is one of the first to relate CS activity in muscle to heat production associated with physical activity (and hence to contractile activity in muscle tissue).
Conclusions
From the results of the present study it was concluded that a decreased nutrient synchrony increased oxidative enzyme activity and intramuscular fat content in the oxidative muscle RA of preruminant calves. This indicates that the within-day distribution of macronutrient availability can affect muscle composition and properties which may have consequences for muscle function and meat quality. However, the decrease in whole body heat production with increasing separation of protein and lactose intake could not be explained by a decrease in oxidative enzyme activities in muscle.
In human subjects, muscle enzyme activities relate to whole body energy expenditure. Consequently, enzyme activities can be used as predictors for energy expenditure. Our data indicate that this relationship is present only for the activity associated component of energy expenditure in growing preruminant calves. Therefore, this relationship loses significance when subjects are fed at higher intake levels. Consequently, muscle enzyme activities are probably useless as an indicator for whole body energy expenditure in rapidly growing animals.
Acknowledgements
The financial support of the Netherlands Organisation for Scientific Research (NWO), the Product Board Animal Feed, Orffa Nederland Feed BV and Tate & Lyle is gratefully acknowledged. We thank Sven Alferink, Meijke Booij, Koos van der Linden (Wageningen University) and David Chadeyron (INRA) for their technical assistance.


