Introduction
Since the beginning of the 1980s, the glaciers of the Austrian Alps have been very markedly in retreat, and several have completely disappeared (e.g. Reference BöhmBöhm, 1994). Consequently, a number of studies have focused on the reaction of glacier behaviour to climate change, especially in the light of a predicted anthropogenic climate warming. In the Austrian part of the Alps, for instance, this was done by a study of Reference Kuhn, Obleitner, Nachtnebel and NachtnebelKuhn and others (1993). Three different approaches have been widely used to investigate the Austrian glacier-climate relation: combined mass-balance-ice-flow models (Reference GreuellGreuell, 1989; Reference SchlosserSchlosser, 1997), models of equilibrium-line altitude (Reference Kuhn and OerlemansKuhn, 1989) and temperature-sum methods (Reference SteinackerSteinacker, 1979; Reference HammerHammer, 1994). Reference Greuell and BöhmGreuell and Böhm (1998) showed the importance of the glacier wind structure for modelling of the climate-glacier relation using the example of Pasterzenkees.
Data from nearby climate stations are often used for climate-glacier models and mass-balance reconstructions. However, few investigations address the homogeneity of climate-data series. It was shown by Reference Auer, Böhm and SchönerAuer and others (1999) that non-climatic changes (inhomogeneities like station relocations, changes of instrument, etc.) in climate series are often of the same order of magnitude as or even exceed the true climate signal. A useful summary of statistical methods for homogenization of climate time series can be found in Hungarian Meteorological Service (1997).
Some features of a comparison of air-temperature and precipitation records with glacier-front variations and mass-balance reconstructions of the eastern Alps were shown by Reference Kuhn, Schlosser and SpanKuhn and others (1997). They found that glacier activity since 1860 has been generally homogeneous throughout the Alps. Inconsistent behaviour of individual glaciers within certain periods results from regional precipitation patterns or from the occurrence of two or more advances within a short time interval, causing certain glaciers to spend their ice reserves in the first advance.
Introducing time series of atmospheric circulation data into the investigation of the climate-glacier relation provides important additional information for understanding glacier behaviour. Such a first approach was demonstrated by Reference Hoinkes, Schram and ThamsHoinkes (1967) for the European Alps. Most recently a study of Reference Hodge, Trabant, Krimmel, Heinrichs, March and JosbergerHodge and others (1998) showed teleconnections between the mass balance of three glaciers in western North America and El Nino-Southern Oscillation as well as Pacific oscillation variability.
Climate Variability in Austrian Eastern Alps Singe Beginning of the Instrumental Observation Period
Climate variability in the Austrian eastern Alps since the end of the 19th century is recorded by several Alpine climate stations. However, very few of these records were checked for homogeneity. Those used in this study, from the climate stations at Sonnblick (3105 m), Zugspitze (2960 m), Santis (2500 m) and Villacher Alpe (2140 m) (for locations see Fig. 1), were carefully homogenized within the Austrian long-term climate (ALOCLIM) project (Reference Auer, Böhm and SchönerAuer and others, 1999, in press).
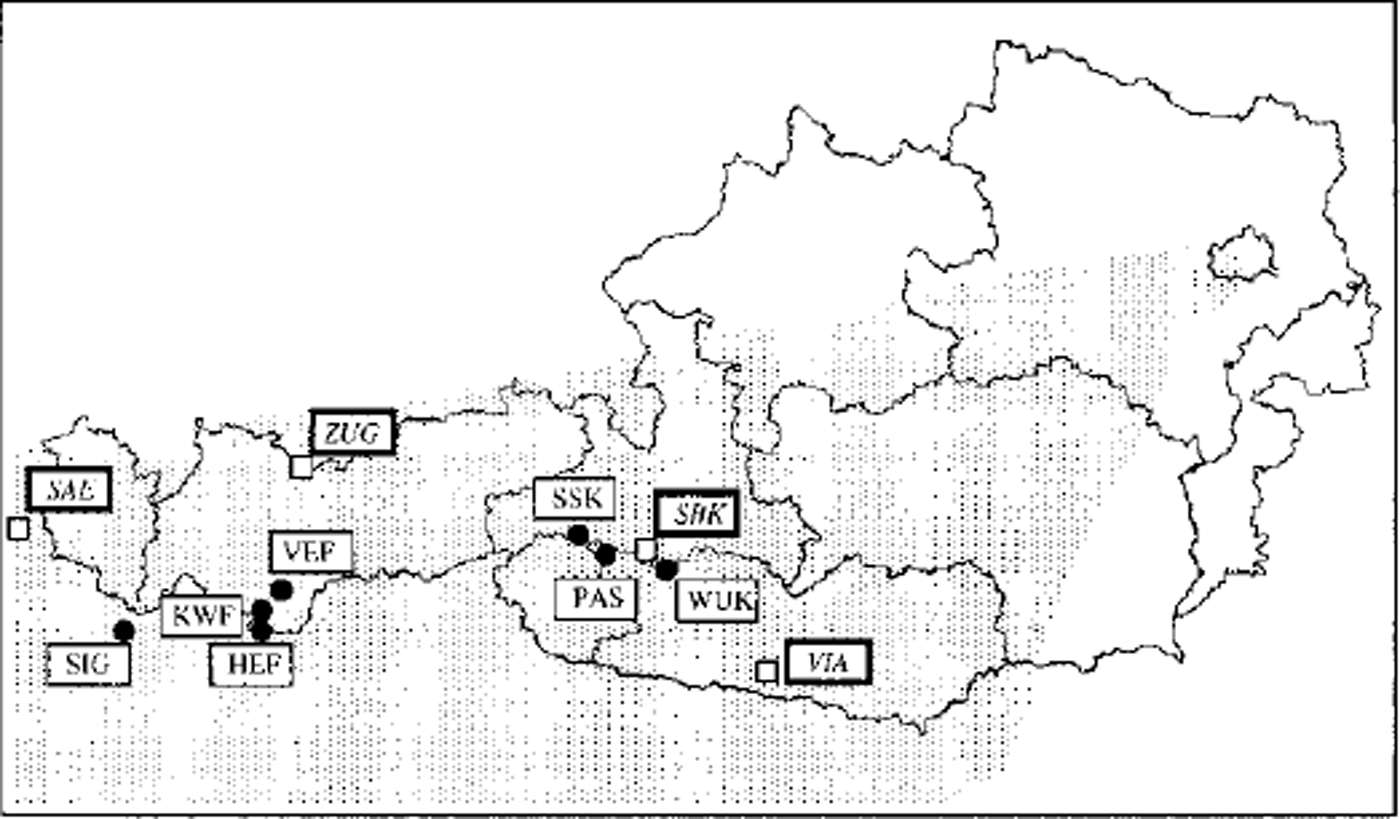
Fig. 1. Map of Austria and the glacier sites, as well as the climatological stations used for this study. The shaded area marks the area of the Alps (climate stations: SAE, Santis; ZUG, Zugspitze; SBK, Sonnblick; VIA, Villacher AlPe; glacier sites: SIG, Silvrettagletscher; VEF, Vernagtferner; KWF, Kesselwandferner; HEF, Hintereisferner; SSK, Stubacher Sonnblickkees; PAS, PasterZe; WUK, Wurtenkees; Jamtalferner, Vermuntgletscher and Ochsentalergletscher are close to Silvrettagletscher).
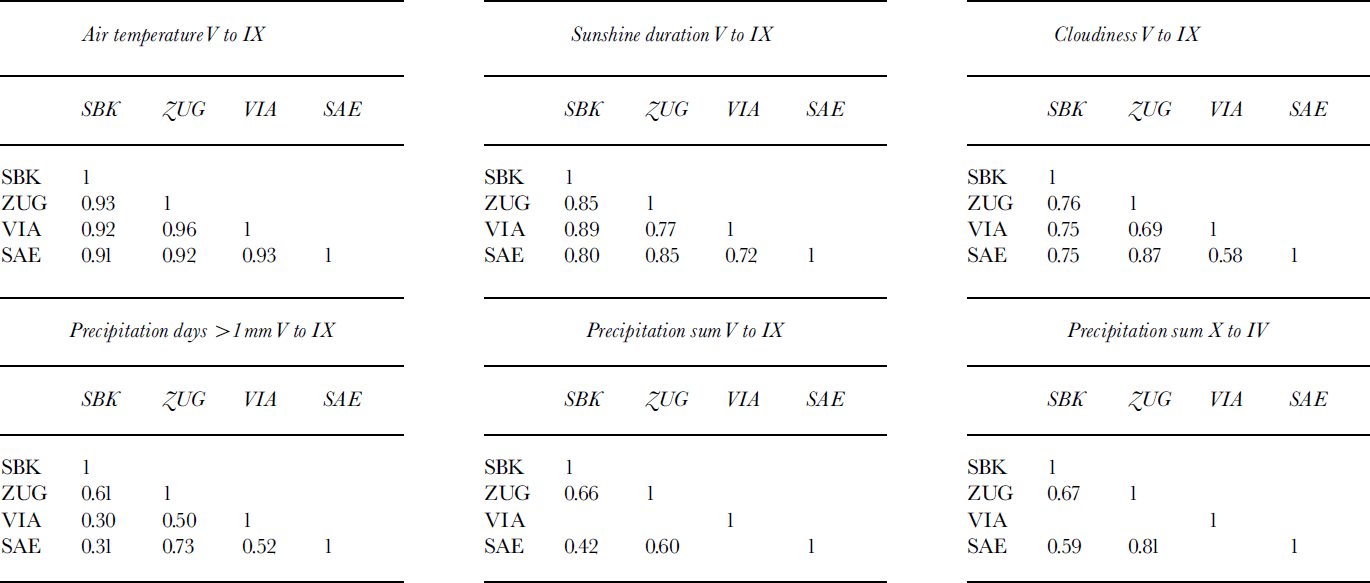
For statements about climate variability by means of time series of climate stations, the areal representativity has to be investigated first. This is shown for six different climate elements by the Pearson’s coefficient of correlation of the four mountain stations in Table 1. Only climate elements with higher influence on glacier mass balance were selected for this comparison. Correlation is very high for air temperature and quite high for sunshine duration and cloudiness. For precipitation elements the correlation is weaker, but a surprisingly good accordance can be found if one takes into account problems of high-alpine precipitation measurement and local precipitation variability.
Table 1. Pearson’s coefficient of correlation between four different eastern Alpine mountain stations for climate elements with higher influence on glacier mass balance (period of investigation 1961–90; critical value for coefficient of correlation at 99% level of significance = 0.46)
Long-term series of climate elements described above are shown in Figure 2. For simplification, only time series of Sonnblick are shown for air temperature, sunshine duration, cloudiness and precipitation elements (note that all values are computed for the summer period (May-September) except for precipitation sums). To characterize continentality we use the difference between July and January temperatures and the difference between mean maximum and mean minimum air temperature. The following climate sub-periods can be derived from Figure 2:
-
(a) more maritime, cooler period around 1910 (decreased air temperature and sunshine duration, increased cloudiness and number of days with precipitation)
-
(b) more continental, warmer period around 1945 (increased air temperature and sunshine duration, decreased cloudiness and number of days with precipitation)
-
(c) rather maritime, cooler period between about 1960 and 1980 (decreased air temperature and sunshine duration, increased cloudiness, decreasing trend of number of days
-
(d)warm, sunny period since the beginning of the 1980s, with a maximum value of continentality around 1985 (strikingly high air temperature and sunshine duration, increasing trend of number of days with precipitation and of winter precipitation amount).

Fig. 2. Time series of climate elements at Sonnblick with higher importance for glacier mass balance. Continentality is described by the difference between July and January temperatures, as well as the difference between mean maximum and mean minimum temperature (curves are shown as single seasons and 20year low-pass filtered values).
These climate sub-periods agree very well with documented glacier-front variations of the Austrian Alps (Reference PatzeltPatzelt, 1985,Reference Patzelt1998).
Glacier Mass-Balance Measurements in the Austrian Alps
Continuous measurements of glacier mass balance were initiated in Austria in 1952 at Hintereis- and Kesselwandferner (Ötztal Alps, Austria). By 1997, mass-balance series were available for ten glaciers within or close to Austria (Fig. 1; Table 2). The westernmost glacier used for this study, Silvrettagletscher, is located in Switzerland close to the Austrian border. Nine glaciers are investigated by a fixed-date system, and one glacier (Stubacher Sonnblickkees) is measured according to the stratigraphic system (Reference Ostrem and BrugmanØstrem and Brugman, 1991). The results of the mass-balance measurements are summarized in Figure 3 by curves of the specific net balance. The figure indicates very clearly that year-to-year changes occur simultaneously for all glaciers. This finding will be confirmed by the coefficient of correlation between the mass balances of individual glaciers (Table 3) within the period 1983–97. Similar results were found for several Swiss glaciers by Reference Müller-Lemans, Funk, Aellen and KappenbergerMüller-Lemans and others (1995). However, correlation between the most widely separated glacier sites (Wurtenkees and Silvrettagletscher) drops below the level of significance.

Fig. 3. Specific net balances often eastern Alpine glaciers (data are available from the World Glacier Monitoring Service, Zürich, with exception of Pasterze at http://www.geo.unizh.ch/wgms/). with precipitation, remarkable maximum of winter precipitation around 1965)
Table 2. Ongoing mass-balance measurements in the Austrian eastern Alps including one glacier site from Switzerland (Silvrettagletscher)
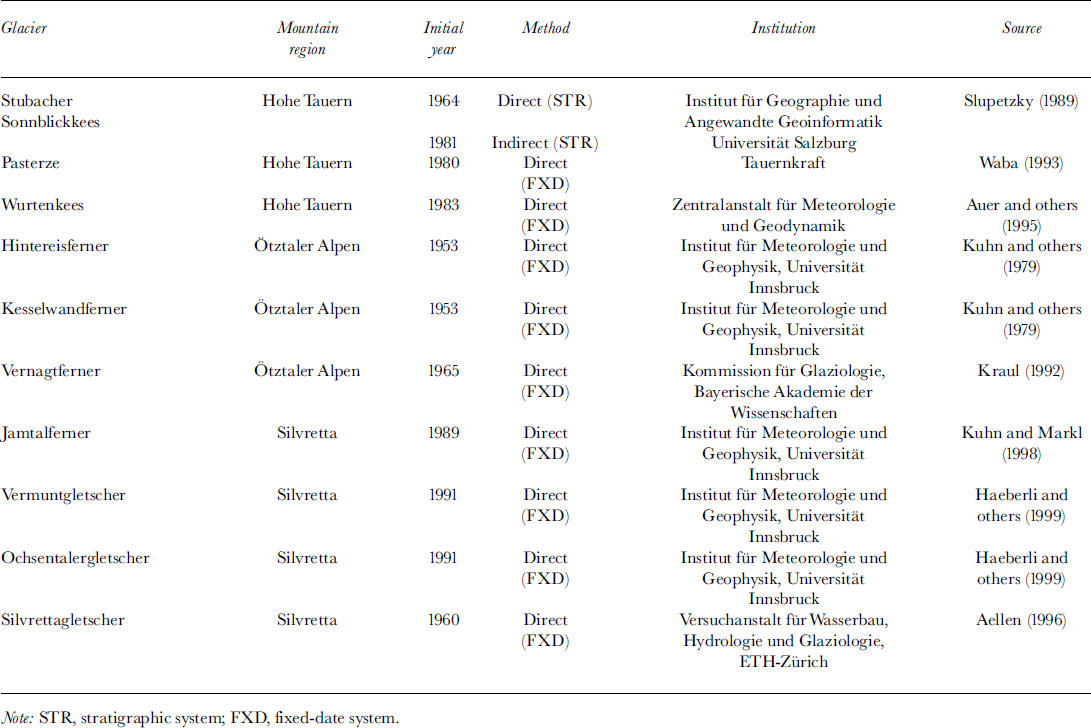
Table 3. Pearson’s coefficient of correlation between specific net balances of seven eastern Alpine glacier sites for the l5 year period 1983–97 (critical value for coefficient of correlation at 95% level of significance = 0.51)
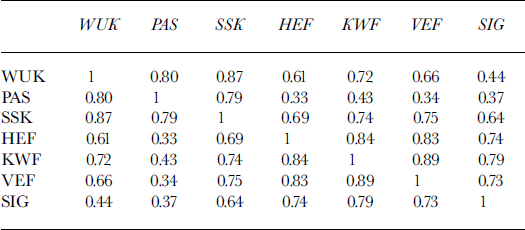
In spite of the high correlation between mass balances of all investigated glaciers, the glacier-front variations can be very different even for adjacent glaciers (see the well-known example of Kesselwand- and Hintereisferner (Reference Kuhn, Markl, Kaser, Nickus, Obleitner and SchneiderKuhn and others, 1985)). An additional consideration is that the period of correlation computation falls into a period of almost exclusively negative mass balances. Compared to the alpine summer temperature signal (Table 1) the mass-balance signal is more variable within the area of the Austrian Alps (Table 3).
Three different sub-periods can be derived from the period of direct mass-balance measurements for the Austrian eastern Alps:
Period of negative to slightly positive mass balances up to 1964
Period of positive to slightly negative mass balances between 1965 and 1981
Period of negative to slightly positive mass balances since 1982
These three mass-balance sub-periods are also reflected in the eastern Alpine glacier behaviour documented by front-position measurements of the Österreichischer Alpenverein (Reference PatzeltPatzelt, 1998).
Eastern Alpine Glacier Reaction to Climate Variability
The climate changes observed in the instrumental records generally coincide very well with periods of advance or retreat of Austrian glaciers (period of retreat prior to 1900; period of advance, 1910–25; period of strong retreat, 1930–64; period of advance between 1965 and the beginning of the 1980s; period of strong retreat since then). Both periods of advance were associated with a more maritime climate, with decreased temperature and sunshine duration as well as increased cloudiness and summer precipitation. In contrast, periods of glacier retreat are more continental, with increased air temperature and sunshine duration as well as decreased cloudiness and summer precipitation.
A more detailed evaluation of the climate-glacier relation is possible for the period of direct mass-balance measurements. The difference in mean mass balance between the period 1965–81 (positive mass-balance period) and the period 1982–97 (negative mass-balance period) ranges from 490 mm (Silvrettagletscher) to 900 mm (Stubacher Sonnblickkees). This change in mass balance results from a shift in summer temperature of about 0.7–1.0°C (Zugspitze, Sonnblick and Säntis). Consequently, an increase by 1°C is equivalent to a change in specific net balance of 500–1100 mm. For the same two periods no change in winter precipitation was measured. However, a decrease (1200–1035 mm) in summer precipitation was measured at Sonnblick. No significant trend was measured for the same periods at Zugspitze. The high west-to-east difference of change in mass balance between the periods 1965–81 and since 1982 can be explained by the difference in the length of the positive mass-balance period, which seems to have lasted longer in the western part of the eastern Alps (see Fig. 3).
To extend information about mass balance to the period prior to direct measurements, we searched for a long-term record of indirect mass-balance measurement. Most widely used in the literature is the temperature-sum method for reconstruction of mass-balance data (e.g. Reference SteinackerSteinacker, 1979; Reference KraulKraul, 1992; Reference HammerHammer, 1994). However, the quality of this method strongly depends on the climate regime during the calibration period. In particular, a model calibrated for a period of negative mass balance is not necessarily sufficient for reconstruction of periods with positive mass balance. Therefore, we required an alternative index more specifically linked to glacier mass balance.
For the eastern part of the eastern Alps such data are available from the snow-depth network at Goldbergkees and Kleines FleiBkees. These measurements started in 1928 on a monthly basis and were homogenized within the ALOCLIM project. It is evident from Figure 4 that snow depths at 1 October ("Firnrest") and 1 May are good approximations for specific net balance and specific winter balance, respectively of nearby Wurtenkees. We argue that snow height is a useful approximation for the mass balance of Wurtenkees since the location of the snow stakes is representative, and mean snow density is very constant in time. A similar method of mass-balance determination has been used for Claridenfirn (Reference Müller and KappenbergerMüller and Kappenberger, 1991).
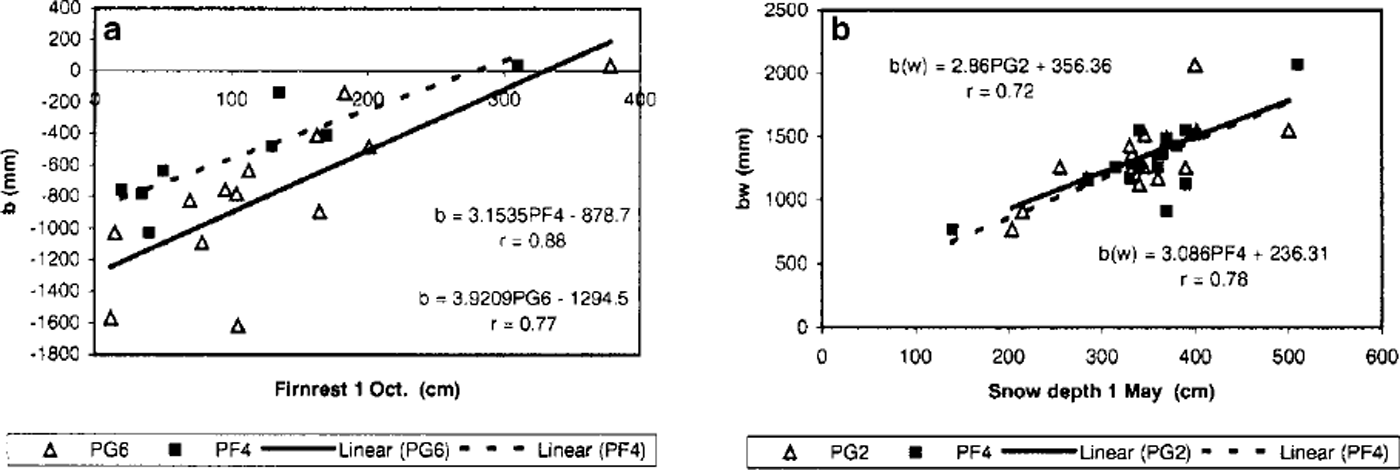
Fig. 4. (a) Relation between snow depth on 1 October (Firmest) and specific net balance of Wurtenkees. (b) Relation between snow depth on 1 May and specific winter balance of Wurtenkees. PG2, PG6 and PF4 denote three different snow stakes at Gold-bergkees and Kleines Fleifβkees in the vicinity of the Sonnblick Observatory.
The continental or maritime character of a climate region determines the relation between mass-balance and climate elements (e.g. Reference Gunther and WidlewskiGunther and Widlewski, 1986). Maritime glaciers have an increased correlation to winter accumulation, and a decreased correlation to summer temperature. The opposite can be found for continental glaciers. If the continental/maritime character of a region changes in time, the sensitivity of mass balance for certain climate elements should also change. This is illustrated in Figure 5 for the glaciers of the Sonnblick region by means of the snow-depth measurements. In Figure 5a, the sensitivity of glacier mass balance to continentality is shown by the correlation of a 15 year moving window of summer temperature at Sonnblick to specific net balance (Firnrest, 1 October). Figure 5b shows the correlation of a 15 year moving window of specific winter balance (snow depth at 1 May) to specific net balance (Firnrest, 1 October). The figure clearly illustrates that the period of positive mass balance (1965–81) is determined to a higher degree by winter accumulation, whereas the periods of negative mass balance (before 1965 and since 1982) are much more correlated to summer temperature. Results as shown above are based on the very rare situation of availability of detailed and longterm mass-balance measurements (winter and annual balance), as well as carefully homogenized climatological data and snow-depth measurements. The Sonnblick region and its observatory are certainly one of the very rare examples of such high-quality datasets.
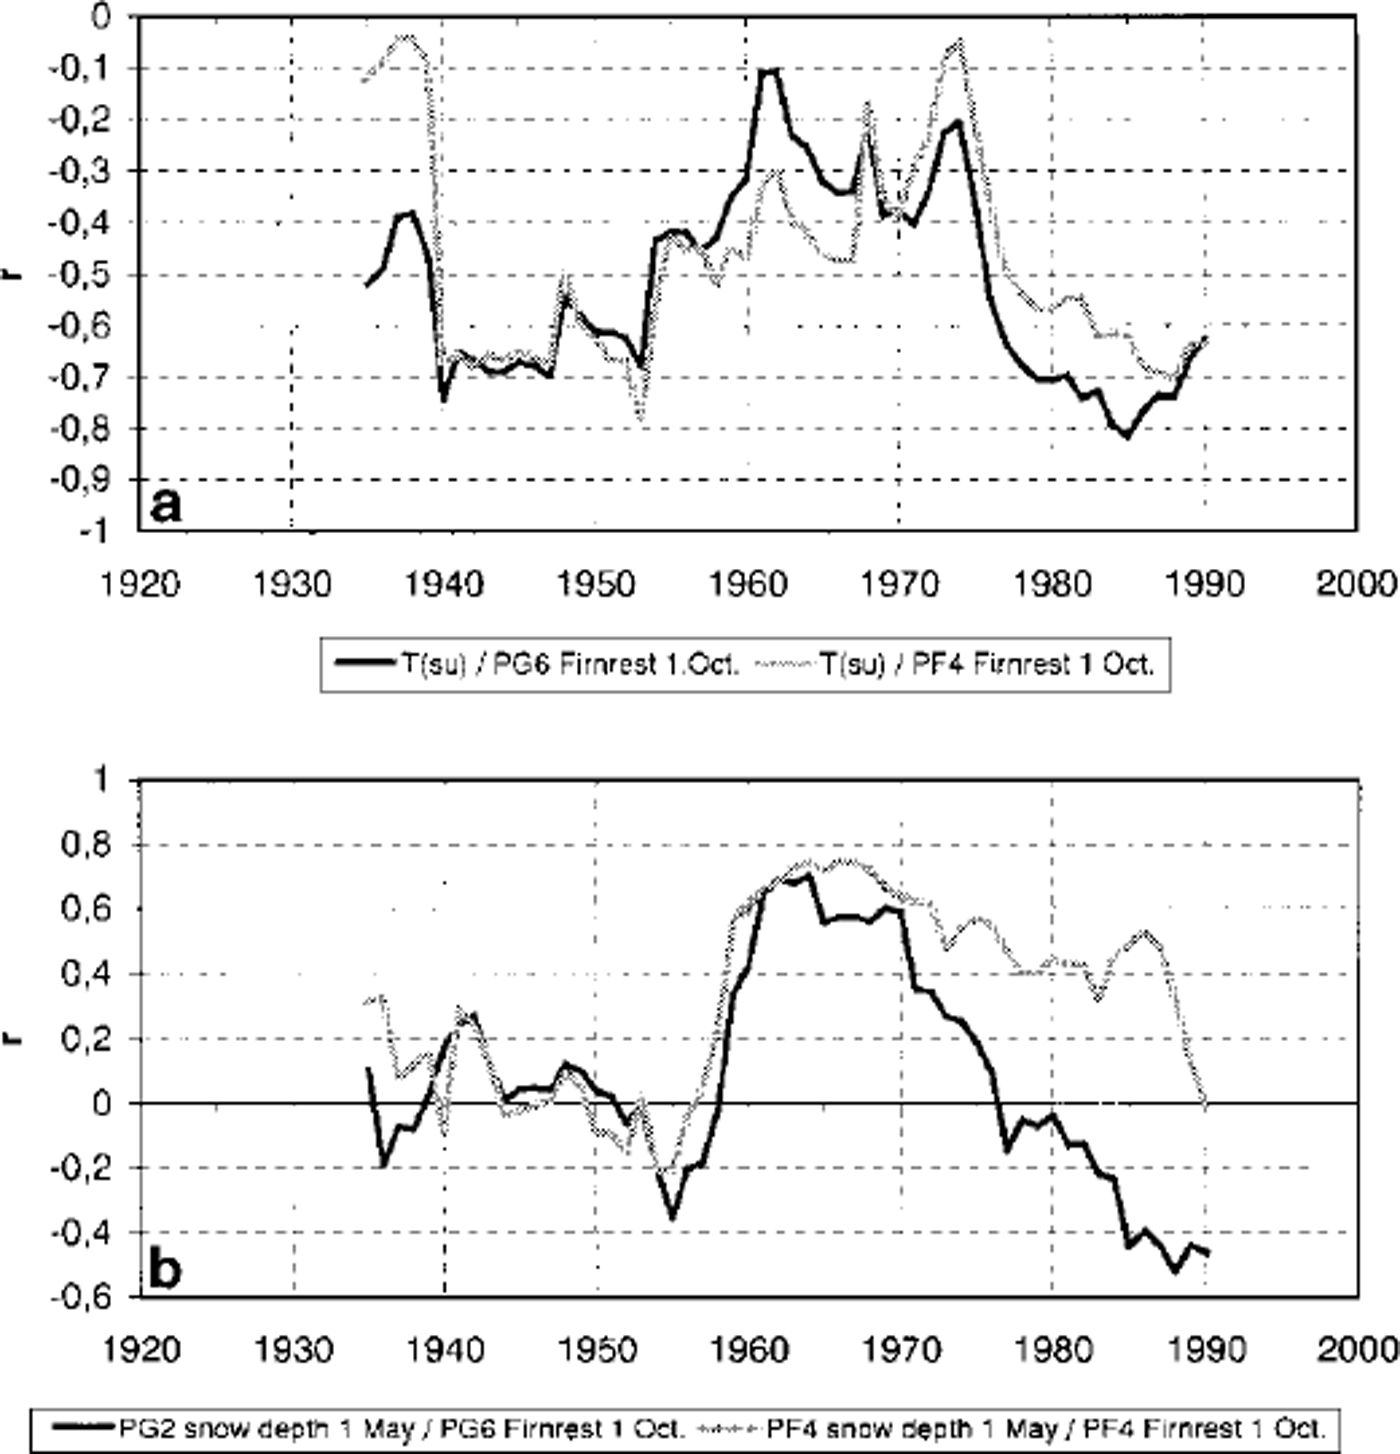
Fig. 5. Sensitivity of specific net balance to summer temperature and winter accumulation under changing continental^ for the Sonnblick region, (a) 15year moving-window correlation of specific net balance (Firnrest, 1 October) to summer temperature. (b) 15year moving-window correlation of specific net balance (Firnrest, 1 October) to winter accumulation (snow depth,! May).
Effects of Changing Atmospheric Circulation on Eastern Alpine Glacier Mass Balance
As a result of global climate warming, glacier mass balance does not react solely to a certain shift in air temperature, humidity, cloudiness, etc. In fact, a shift of European temperature distribution alters the weather patterns over the Alps, which in turn results in a changed temperature and precipitation regime. A variety of different methods are used to classify atmospheric-circulation or weather patterns. The group of weather-type classifications such as the system of Reference SchueppSchüepp (1979) for the European Alps is often biased due to subjective interpretation. The group of oscillation indices used for the North Atlantic Oscillation index (NAOI; Reference HurrelHurrel, 1995) is most widely used for central Europe. Several authors use gridded sea-level pressure fields derived from climate-station data to describe changes of atmospheric circulation. With this method Reference Wanner, Rickli, Salvisberg, Schmutz and SchueppWanner and others (1997) found a significant increase of the zonal circulation type over the Alps during winter, and a decrease of the Azores high during summer since the 1970s. Moreover, the number of convective weather types increased and the number of ad-vective weather types decreased in the same period.
These findings concerning winter-circulation variability coincide very well with the development of the NAOI. As shown by Auer and others (in press), winter NAOI is well correlated to Austrian winter temperature (Fig. 6). However, due to the low advection potential, correlation is weak between summer temperature of Austria and summer NAOI. Consequently, during negative mass-balance periods for which glacier mass balance depends on summer temperature, the influence of NAOI is weak. In contrast to the negative mass-balance periods positive mass-balance periods are also influenced by winter precipitation (shown above). If NAOI is low, the zonal circulation mode is weakened and the meridional one is increased. This results in a higher amount of winter precipitation from northwesterly to northerly weather types for the Alps. Therefore NAOI can influence Alpine glacier mass balance by changing winter accumulation. This is evident in Figure 6. The positive mass-balance period 1965–81 is determined by a negative winter NAOI and a much higher amount of winter precipitation.
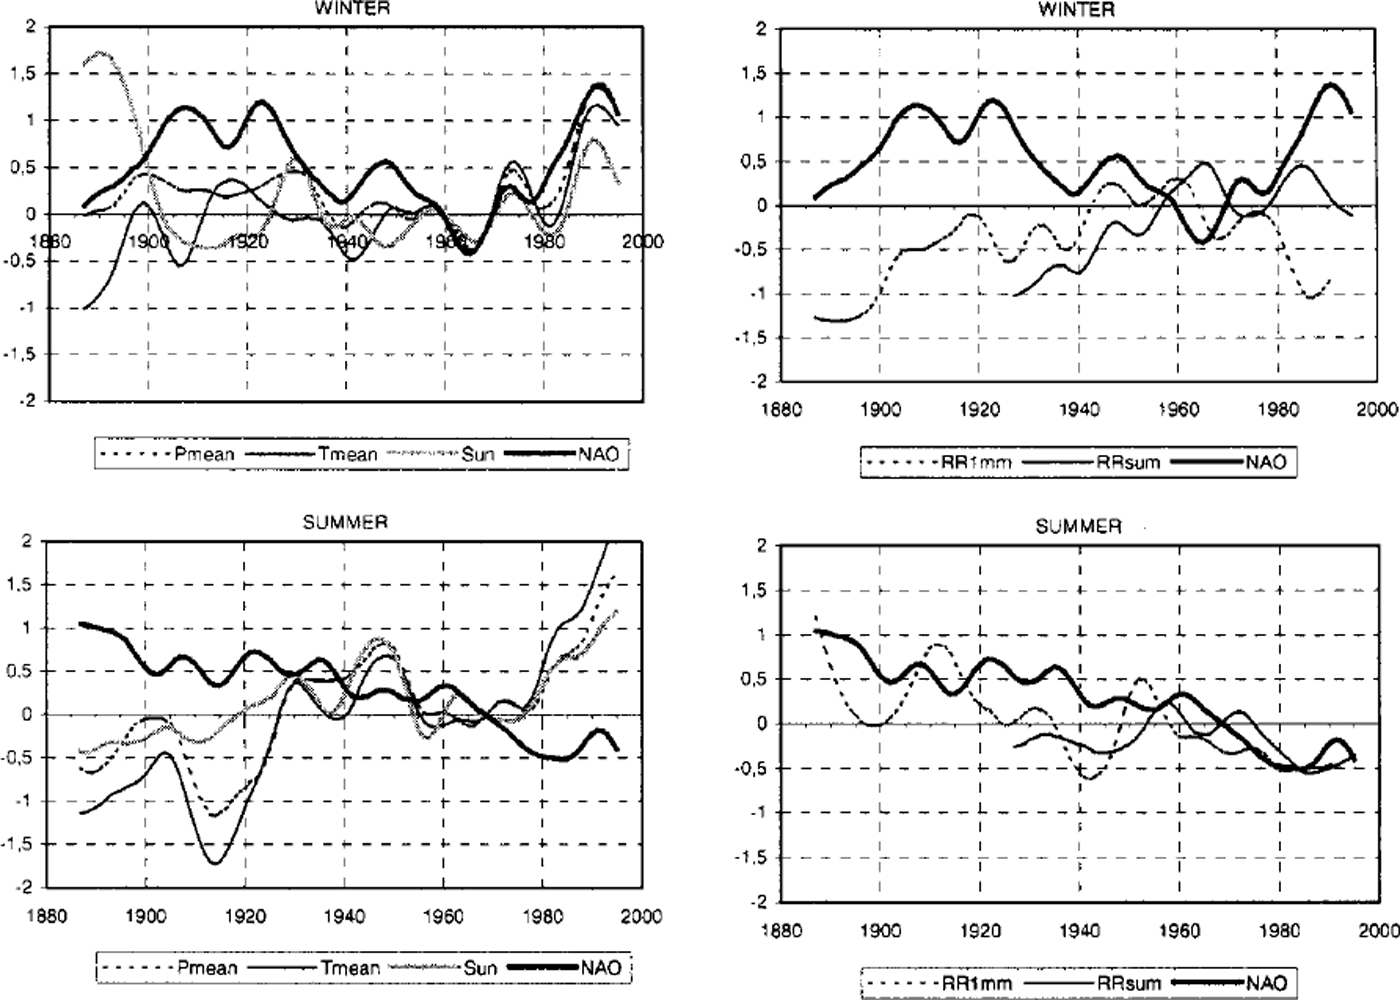
Fig. 6. Comparison of NAOI with climate records of Sonnblick separated for winter season (December-February) and summer season ( June-August). Curves are 20year low-pass filtered values normalized to the MAO reference period 1951–80 (Pmean = air-pressure mean; Tmean = air temperature mean; Sun = sunshine duration; RRlmm = number of days with precipitation >lmm; RRsum = precipitation sum).
Conclusions
From the investigation of a homogenized climate dataset and measured mass-balance data in the Austrian part of the eastern Alps we conclude that:
-
(1) Periods of glacier advance are more maritime and cooler, with reduced sunshine duration and an increased precipitation sum. Periods of retreat are more continental and warmer with increased sunshine duration and reduced precipitation sum.
-
(2) Measured mass balances of nine Austrian glaciers are well correlated. However, for the most distant glacier sites within the Austrian Alps (Silvretta and eastern part of Hohe Tauern) correlation drops below the level of significance.
-
(3) A difference of –900 to –500 mm specific net balance between the more positive period (1965–81) and the more negative period (since about 1982) was associated with a shift in summer temperature of 0.7–1.0°C and more or less unchanged winter precipitation amount.
-
(4) For the eastern part of the eastern Alps, mass balance can be parameterized by snow-depth measurements which date back to 1928.
-
(5) More negative mass-balance periods show a high correlation to summer temperature and no correlation to winter accumulation. Positive mass-balance periods are highly correlated with winter accumulation and less correlated with summer temperature.
-
(6) Variations in winter accumulation related to the intensity of the NAO can have a significant impact on glacier mass balance in the Austrian Alps. The positive mass-balance period 1965–81 was characterized by negative winter NAOI values which caused an increase of the meridional circulation mode and a more intense northwesterly to northerly precipitation regime. Due to the increased influence of winter accumulation on specific net balance during this period, the effect of NAO can be an important contribution to glacier mass balance.
Acknowledgements
The ALOCLIM project was funded by the Austrian Ministry of Sciences and Transport and by the Ministry of Environment, Youth and Family Affairs. We also want to thank the Swiss and German Weather Services for data disposal. Mass-balance data of Pasterze were provided by P. Kirchlechner of Tauernkraft. We thank M. Kuhn and R. Sailer for useful comments and improvements.


