


1 Introduction
From a benefit-cost perspective, policing policies can be examined in a narrow sense such as what the benefits and costs are of adding an extra police officer to the force or preventing an additional aggravated assault. There is a small but growing literature that provides such estimates, which are a critical input to benefit-cost analyses.Footnote 1 They can also be examined in a broad context in the sense of what a community wants its bundle of policing policies and outcomes to be. This broad context has sometimes been examined in the context of organized discussions within a community (e.g., focus groups) and by standard survey research questions (e.g., do you favor police using sobriety check points?). However, as Cohen, Rust and Steen (Reference Cohen, Rust and Steen2006) show, failure to get the public to make tradeoffs including taking budget constraints into account can lead to very misleading impressions of what the public would like to see happen with respect to crime prevention and treatment of offenders. Such an approach does not force members of the public to make tradeoffs where at least one aspect of the tradeoffs involves monetary costs that allows conversion of public preferences for broad policing options into monetary terms.
In this conceptual paper, we examine how to get the public to make tradeoffs in such a way as to be able to cast preferences in monetary terms in a way consistent for use in benefit-cost analyses. The example we use involves reducing the rate of a particular crime in two different ways, where the value of the crime reduction can depend on how that reduction is achieved.Footnote 2 We propose a modern discrete choice experiment (DCE) approach (Louviere, Hensher & Swait, Reference Louviere, Hensher and Swait2000; Carson & Czajkowski, Reference Carson, Czajkowski, Stephane and Daly2014; Holmes, Adamowicz & Carlsson, Reference Holmes, Adamowicz, Carlsson, Patricia, Boyle and Brown2017) popular in environmental and health policy analysis, marketing, and transportation research. The first two examples in the criminal justice literature are Atkinson et al. (Reference Atkinson, Bradford, Carson, Louviere, Mourato, Philens, Terlich and Wei2010), who in a study for the British Ministry of Justice, look at tradeoffs between different attributes of criminal sentences such as the length of time in jail and drug treatment and cost to the taxpayer, and Picasso and Cohen (Reference Picasso and Cohen2017), who look at tradeoffs between (a) different types of crime, (b) different ways to reduce crime, and (c) cost in Argentina. The approach we propose is particularly well suited to situations where the overall policy of interest can be properly viewed as a bundle of connected attributes and there is interest in monetizing the difference between alternative policies that vary the levels of these attributes. We further show how the DCE approach can be used to identify heterogeneity in preferences for broad policing policies and identify segments based on attitudes, demographics, past experience, or geography in the population of interest that hold distinctly different beliefs about the nature of the tradeoffs they would be willing to make.
A DCE preference elicitation format is one of the most common ways (Carson & Louviere, Reference Carson and Louviere2011) to implement preference questions in the context of a contingent valuation survey. Discrete choice experiments range from the canonical single binary choice question (SBC) recommended by the NOAA Blue Ribbon Panel on Contingent Valuation (Arrow et al., Reference Arrow, Solow, Portney, Leamer, Radner and Schuman1993) to variants of best–worst scaling (Louviere, Flynn & Marley, Reference Louviere, Flynn and Marley2015). Each has different properties with respect to the incentives respondents face in answering questions and the amount of preference information collected (Carson & Groves, Reference Carson and Groves2007, Reference Carson, Groves and Jeff2011). We discuss implementing these different DCE preference elicitation formats in various contexts with an eye to understanding how survey responses to them can help to inform policymakers about how the public would like to be policed.
2 A stylized example
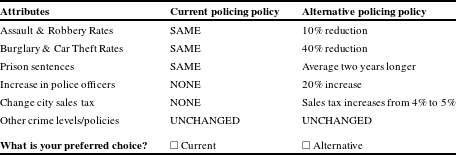
It is useful to start with a stylized example. Most benefit-cost analyses are performed relative to a status quo baseline. Construction of this status quo baseline is one of the first and major steps in setting up a constructed market where people can make choices between the status quo and one or more possible alternative options. It is impossible to fully specify all of the attributes of the status quo and possible alternativesFootnote 3 , but one can concentrate on the main ones of interest that differ between the status quo and possible alternatives and try to hold all other attributes constant. In this example, a survey respondent is asked to make an SBC between the status quo policing policy, which offers the current set of crime attribute levels and no increase in cost, and an alternative, which will decrease the levels of some crime rates. This will be done by (a) increasing the size of the police force, and (b) changing policing policy to include frequent interception of people and cars using stop and frisk tactics and sobriety check points. If implemented, these changes will entail an increase in the sales tax rate paid by the city’s households. Our stylized choice question is displayed in Table 1.
This SBC question is known to be incentive compatible (Carson & Groves, Reference Carson and Groves2007; Carson, Groves & List, Reference Carson, Groves and List2014) in the sense that truthful preference revelation is the dominant strategy if the survey results will have some influence on the government’s decision and two additional conditions hold: (1) the choice represents a take-it-or-leave decision that does not influence other public decisions, and (2) the payment mechanism is coercive in the sense that payment cannot be avoided if the alternative policing policy is put into place. The SBC format has the same incentive properties as a vote on a binding ballot proposition or an advisory vote like Brexit. When there is a single well-defined policy option versus the current status quo, and policymakers wish to know if the switch to the alternative policy is supported by a majority of the public, this single question provides that information. The response to this SBC question is substantially more informative than traditional survey questions that do not force respondents to make a clear choice involving the relevant tradeoff.
For a benefit-cost analysis, the analyst needs to know the public’s willingness to pay (WTP) for the policy option. To determine the benefits of the new policy alternative, it would be necessary to offer statistically equivalent subsamples of the population different cost amounts for the alternative policy. Doing so traces out the percentage of the population willing to pay different amounts in a manner akin to a dose response experiment in biology.Footnote 4 The area under this curve is WTP expressed in terms of Hicksian compensating surplus, which is the appropriate measure of economic welfare for an imposed policy change (Just, Hueth & Schmitz, Reference Just, Hueth and Schmitz2008). It is difficult to trace out the entire WTP function since a rational respondent, when offered an implausibly low or high cost amount, should substitute in their expected cost (Carson & Groves, Reference Carson and Groves2007). There are also statistical issues related to parametric and nonparametric estimation of the WTP function and the cost amounts used, for which there is a large literature providing guidance (Carson & Hanemann, Reference Carson, Hanemann, Karl and Vincent2005).
Table 1 Single binary choice question.

Typically, an introductory section introduces the policy question, helps to place it in context, and explains that responses to the survey will be considered by decision makers. Before presenting Table 1, the attributes in that table and their levels are described in substantial and substantive detail to ensure common understanding across respondents. In contrast to many marketed goods, considerable effort needs to go into representing the key attributes of a policy and the levels that its attributes can vary over. Attributes and associated levels are often depicted both verbally and visually. Usually, the language the public uses differs from that used by experts. Focus groups and one-on-one cognitive interviews are standard tools for designing a survey instrument that will be well understood by the lay public. Any description of a policy change, including the description of the status quo, is necessarily an abstraction, and it is important that this information does not overwhelm respondents, and policymakers see the choice scenario presented as a fair representation of the policy decision. Thus, involving key interest groups in the design of the choice scenarios can help in getting buy-in in terms of acceptance of the usefulness of survey results for policymaking.
3 Exploring a change in a noncost attribute
With a sufficiently large sample and appropriate experimental design, it is possible to trace out the full WTP response surface as a function of both tax and nontax attribute levels. Conceptually, the easiest way to think about this is a binary shift in one nontax attribute, which would require random assignment of respondents to the two levels of this attribute as well as random assignment to the cost levels. For instance, in Table 2, it would be possible to use longer prison sentences rather than aggressive stop and frisk/sobriety check points as a means of reducing the specified crime levels. This is akin to the external scope test popular in the environmental economics literature, except that there is no a priori expectation as to the direction, if any, that the WTP estimate should move with the change in the attribute level. Statistical comparison of the WTP estimates from the choice scenarios in Tables 1 and 2 can be undertaken using both nonparametric and parametric approaches, and it is also possible to determine whether respondents with different demographic characteristics respond in different ways to the two choice scenarios.
There are interesting variants of the choice scenario in Table 1 that do not require the stop and frisk attribute level to be formally changed. For instance, it would be possible to show statistically equivalent random samples short videos of stop and frisk tactics implemented in two different ways.Footnote 5 The statistical test between the scenarios with the different stop and frisk videos would reveal whether the public’s WTP differs depending on how stop and frisk is presented/implemented. Again, it would possible to determine which demographic groups are most sensitive to the two different depictions.
Table 2 Single binary choice question substituting increased prison sentences.
4 More informationally efficient approaches
An SBC with a coercive payment mechanism like a tax is known to have good incentive properties for truthful preference revelation involving public goods, which is an underlying consequence of the SBC elicitation format not collecting much preference information from each respondent. This makes it expensive to use when there is interest in obtaining WTP estimates for several different policing options and understanding what attributes of those policies are responsible for any estimated differences in WTP measures.
It is possible to stack the choice sets in Tables 1 and 2 (as well as other similar tables) to form what is known as a sequence of paired comparisons. Truthful preference revelation is optimal if respondents answer the questions independently. This does not always happen, but the increase in the information obtained often more than offsets the amount of bias or noise that the sequence of paired comparisons format can introduce (Day et al., Reference Day, Bateman, Carson, Dupont, Louviere, Morimoto, Scarpa and Wang2012).Footnote 6 There is a long-standing debate over whether “learning” about preferences occurs in a sequence of choice tasks or whether there is learning about how to behave strategically. These lead to very different notions about how to treat preference estimates that appear to be divergent across the sequence of questions. Under strong but reasonable conditions, Carson and Groves (Reference Carson, Groves and Jeff2011) argue that estimates of marginal WTP for tradeoffs between attributes in sequences of choice sets are likely to be unbiased because strategic behavior typically involves appearing more (or less) price sensitive. This cancels out when one looks at marginal tradeoffs such as comparing stop and frisk versus increased prison sentences, as discussed earlier, even if the estimate of the total WTP for a policy option is biased.Footnote 7
Table 3 Single multinomial choice question.
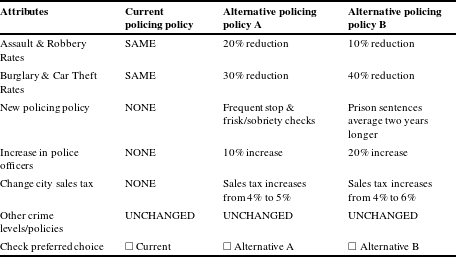
Another way to obtain more information is to offer a respondent the status quo and two (or more) alternative options.Footnote 8 This type of question, known as a single multinomial choice (SMC) question, is shown in Table 3. With three choice alternatives, there are effectively two binary comparisons. This expands with the number of choice alternatives, but the choice sets get harder for respondents to answer, particularly if there is a sizeable number of attributes. This risks having respondents take shortcuts and ignore alternatives or attributes. One can stack different tables (similar to Table 3), where each table forms a choice set. This sequence of multinomial choice tasks is common in DCE applications. When coupled with a reasonably efficient experimental design, it allows estimation of a wide range of tradeoffs with very good precision with sample sizes that are feasible for many policy analysis efforts.Footnote 9
Table 4 Best–worst choice task.

Another popular DCE variant is a best–worst choice (BWCHOICE) task (Louviere et al., Reference Louviere, Flynn and Marley2015). It takes the SMC question in Table 3 and adds a second line asking the respondent for their least preferred option. Table 4 displays this variant of a DCE. With three options, Table 4 will collect a complete ranking of alternatives; hence, it is considerably more efficient in terms of information on preferences collected in an SMC. With more than three alternatives, the best–worst format can be used iteratively, removing the best and worst alternatives each time, until the complete set is ranked. It is common to ask a sequence of BWCHOICE questions that provide less than a full ranking. This still produces significantly more statistical information about preferences than a sequence of SMC tasks. All of the DCE formats discussed thus far can be viewed as extensions of the basic binary discrete choice questions and hence all share the same underlying utility framework. A variety of parametric and nonparametric statistical techniques exist to summarize the preference information from DCEs.
A different variant of a BWCHOICE question can be useful when there is interest in how favorably the attributes of a new policing policy are viewed. Table 5 displays the alternative policing option attributes from Table 1 in this form, where a respondent is asked what the best and worst characteristics of the alternative to the status quo are. Like Table 4, the best and worst characteristics can be dropped and the question repeated with the remaining characteristics. Table 5 choice task questions can also be stacked in a sequence and an experimental design again can be used to vary the attribute levels systematically. This makes it possible to determine when respondents will switch their rank orderings. Another useful aspect of this DCE format is that it is amenable to the use of a reasonably large number of attributes and has been used to look at quality of life tradeoffs in cities, among many other applications (Louviere & Carson, Reference Louviere and Carson2016).
Table 5 Best–worst choice task focused on attribute level attractiveness.

5 Analysis of WTP for policing alternatives and identification of preference heterogeneity
If all that is desired is an estimate of the public’s WTP for a specific policing alternative, there are a variety of parametric and nonparametric estimators available (Carson & Hanemann, Reference Carson, Hanemann, Karl and Vincent2005; Hensher, Rose & Greene, Reference Hensher, Rose and Greene2015) that allow analysts to estimate this. Nonparametric approaches are popular because they are robust to distribution assumptions that can have a large influence on estimates from discrete choice models in general. These can be coupled with assumptions that ensure that the direction of any bias in the WTP estimate is known. More commonly used are variants of the conditional logit model that serve as the workhorse statistical technique for discrete choice models (Hensher et al., Reference Hensher, Rose and Greene2015). In that framework, with a linear utility model, WTP for a marginal change in the level of the
 $k$
th attribute is
$k$
th attribute is
 $-\unicode[STIX]{x1D6FD}_{k}/\unicode[STIX]{x1D703}$
, where
$-\unicode[STIX]{x1D6FD}_{k}/\unicode[STIX]{x1D703}$
, where
 $\unicode[STIX]{x1D6FD}_{k}$
is the estimated coefficient on the
$\unicode[STIX]{x1D6FD}_{k}$
is the estimated coefficient on the
 $k$
th attribute and
$k$
th attribute and
 $\unicode[STIX]{x1D703}$
is the estimated coefficient on the tax cost variable, which is used to scale the preference parameter on the attribute into monetary terms.
$\unicode[STIX]{x1D703}$
is the estimated coefficient on the tax cost variable, which is used to scale the preference parameter on the attribute into monetary terms.
It has become increasingly clear that public preferences toward policing policies are not homogeneous. This heterogeneity is reflected in the estimates of the preference parameters
 $\unicode[STIX]{x1D6FD}_{k}$
and the scale parameter
$\unicode[STIX]{x1D6FD}_{k}$
and the scale parameter
 $\unicode[STIX]{x1D703}$
. The simplest variant of heterogeneity occurs when different people have the same preference parameters but differ in terms of the precision of the scale parameter in which they make choices. The frequently used random parameter (mixed) logit model allows the estimated
$\unicode[STIX]{x1D703}$
. The simplest variant of heterogeneity occurs when different people have the same preference parameters but differ in terms of the precision of the scale parameter in which they make choices. The frequently used random parameter (mixed) logit model allows the estimated
 $\unicode[STIX]{x1D6FD}_{k}$
coefficients to follow a prespecified distribution (typically normal or lognormal), whereby both a mean and a standard deviation are estimated rather than a single point estimate (Train, Reference Train2009). There are two drawbacks of the mixed logit model from the perspective of evaluating policing policy options. The first is that the distributions for the individual
$\unicode[STIX]{x1D6FD}_{k}$
coefficients to follow a prespecified distribution (typically normal or lognormal), whereby both a mean and a standard deviation are estimated rather than a single point estimate (Train, Reference Train2009). There are two drawbacks of the mixed logit model from the perspective of evaluating policing policy options. The first is that the distributions for the individual
 $\unicode[STIX]{x1D6FD}_{k}$
that are computationally tractable are single peaked, which effectively rules out extreme polarization which would be characterized by bimodal or more extreme multimodal distributions. The second is that there is likely to be considerable heterogeneity in the scale component, which can be confounded with variability in the
$\unicode[STIX]{x1D6FD}_{k}$
that are computationally tractable are single peaked, which effectively rules out extreme polarization which would be characterized by bimodal or more extreme multimodal distributions. The second is that there is likely to be considerable heterogeneity in the scale component, which can be confounded with variability in the
 $\unicode[STIX]{x1D6FD}_{k}$
. (The “scale component” is the inverse of the error variance, and is perfectly inversely correlated with the model parameter estimates in all limited dependent variable models, of which choice models are one type.) The generalized multinomial logit model allows for both scale heterogeneity and heterogeneity in the preference parameters (Fiebig, Keane, Louviere & Wasi, Reference Fiebig, Keane, Louviere and Wasi2010). Technically, the heterogeneity can be made a function of covariates such as age or education, but such models tend to be poorly behaved.
$\unicode[STIX]{x1D6FD}_{k}$
. (The “scale component” is the inverse of the error variance, and is perfectly inversely correlated with the model parameter estimates in all limited dependent variable models, of which choice models are one type.) The generalized multinomial logit model allows for both scale heterogeneity and heterogeneity in the preference parameters (Fiebig, Keane, Louviere & Wasi, Reference Fiebig, Keane, Louviere and Wasi2010). Technically, the heterogeneity can be made a function of covariates such as age or education, but such models tend to be poorly behaved.
It is also possible to estimate models with a formal latent class (segmentation) structure. In such models, individuals are probabilistically assigned to latent classes that differ in terms of their preference parameters. Demographic and other covariates are often used to achieve better identification of the different classes, and statistical techniques exist for determining the appropriate number of latent classes. Recent work has further allowed preferences within a latent class to follow a random parameter distribution (e.g., Wasi & Carson, Reference Wasi and Carson2013). In general, latent class models are often easy to interpret in terms of group membership and preference differences, which makes them popular in marketing. Moreover, by extension, they are likely to be easier to explain to policymakers.
There also are models that allow one to estimate individual-level parameters if respondents face a rich enough set of choice tasks (Louviere, Reference Louviere, Stephane and Daly2013). These models can be estimated using a classical or Bayesian framework. With estimates of individual-level preference parameters in hand, it is possible to use a variety of statistical techniques, including regression models, to determine how differences in the parameter estimates are associated with individual demographic and other characteristics of respondents making the choices.
Various decision support systems, including visualization approaches, are available to help policymakers to understand the nature of the preference information collected. It is possible to display how WTP estimates change as the attributes of policy alternatives change, and to display how these change by attitudinal, demographic, geographic, and prior experience covariates.Footnote 10 The key challenge with respect to policing policies is to find the covariates that drive differences in the policing policy choices made by respondents and to understand why. Often this will be a challenging task which requires considerable development work with the public, interest groups, and police. An understanding of these relationships, however, can be the key to the development of measures that help the adopted polices to gain widespread acceptance in the community.
6 Concluding remarks
The DCE approaches laid out in this paper have the ability to collect information about the public’s preferences for policing policies. This information can be expressed in terms of monetized economic welfare measures to facilitate comprehensive benefit-cost analysis. The main contribution of this paper is to show how to go beyond the usual characterization of the monetized benefits of reducing the level of a specific type of crime to asking the question of whether those benefits differ depending on how the outcome is achieved. For example, members of the public may have a very different WTP to reduce the level of street robberies if accomplished by a heavy community police presence than if accomplished by aggressive stop and frisk tactics. Traditionally, economic analysis has ignored method and process issues in benefit-cost analysis; however, this has never been appropriate when those methods and processes create externalities of their own. Nowhere is this more apparent than in the national debate currently going on with respect to how American cities should be policed.Footnote 11
The collection of preference information from a large random sample of the population of interest also allows analysts to compare whether different segments of the population defined on attitudes, demographics, past experience, and/or geography have substantively different preferences for specific policing policy changes. Such information can be as important to policymakers as standard economic welfare measures used in benefit-cost analyses. Being able to quantify these in monetary terms allows more precise comparisons than standard Likert type rating scales often used in surveys to assess public preferences for different groups and statistical techniques readily allow for controlling for income and setting it at a common level if desired.
Acknowledgments
The authors wish to thank the editor, referees, and Barry Friedman for helpful comments which substantially improved the paper.


