


Introduction
For decades, large-scale hydroelectric developments have been promoted as a green alternative to meet the world’s growing energy demands (Bilgen et al. Reference Bilgen, Kaygusuz and Sari2004, Burrier Reference Burrier2016). While most of these dams are concentrated in the developed world, the Neotropics, with their expansive rivers and watersheds, have emerged as a new frontier for hydropower development (Anderson et al. Reference Anderson, Pringle and Rojas2006, Winemiller et al. Reference Winemiller, McIntyre, Castello, Fluet-Chouinard, Giarrizzo and Nam2016). In the Amazon basin alone, c. 412 dams are operational, under construction or proposed (Little Reference Little2014).
Hydroelectric facilities impose significant social-ecological costs, including explosions during construction, altered river flows and changes in sediment transport (Dugan et al. Reference Dugan, Barlow, Agostinho, Baran, Cada and Chen2010, Poff & Zimmerman Reference Poff and Zimmerman2010, Winemiller et al. Reference Winemiller, McIntyre, Castello, Fluet-Chouinard, Giarrizzo and Nam2016). The creation of reservoirs entails deforestation, flooding, shoreline erosion and water diversion, all of which can impact ecosystems (Barbarossa et al. Reference Barbarossa, Schmitt, Huijbregts, Zarfl, King and Schipper2020). Additionally, reservoirs favour a few lentic generalist fish species (Agostinho et al. Reference Agostinho, Gomes, Santos, Ortega and Pelicice2016) whilst thwarting overall downstream fish migration (Pelicice et al. Reference Pelicice, Pompeu and Agostinho2015). Dams hinder animal migration upstream and contribute to species invasion (Grill et al. Reference Grill, Lehner, Lumsdon, MacDonald, Zarfl and Liermann2015, Hahn et al. Reference Hahn, Martins, Nunes, Machado, Lopes and da Câmara2022), endangering endemic species dependent on fast-flowing waters (Lees et al. Reference Lees, Peres, Fearnside, Schneider and Zuanon2016). Hydropower development also contributes to greenhouse gas emissions, contradicting claimed environmental benefits. Reservoirs produce emissions of methane (CH4) through plant decomposition lasting for decades, and downstream emissions occur during water passage through turbines and spillways (Deemer et al. Reference Deemer, Harrison, Li, Beaulieu, DelSontro and Barros2016). Evidence of some long-term floodplain forest loss downstream will certainly contribute to more CH4 emissions, although the magnitude of these has yet to be calculated (Resende et al. Reference Resende, Schöngart, Streher, Ferreira-Ferreira, Piedade and Silva2019).
The environmental and physical impacts of dams are closely linked to their social, cultural, economic and health-related impacts on surrounding communities. Hydropower projects often result in population influx, primarily of men (Bro et al. Reference Bro, Moran and Calvi2018), leading to increased living costs and straining urban infrastructure such as that related to water, sewage, healthcare, education and prison (Marin & Oliveira Reference Marin and Oliveira2016). Dam construction and operation, by affecting fish movement, habitats (Pelicice et al. Reference Pelicice, Pompeu and Agostinho2015, Agostinho et al. Reference Agostinho, Gomes, Santos, Ortega and Pelicice2016), nutrient dynamics and reproductive timing due to unnatural water flows (Fearnside Reference Fearnside2014), can affect fish diversity, which is important for subsistence economies. As a consequence, local food sources are disrupted, contributing to food insecurity, especially in regions where fish consumption represents a vital protein source (Dugan et al. Reference Dugan, Barlow, Agostinho, Baran, Cada and Chen2010, Isaac & de Almeida Reference Isaac and de Almeida2011).
Linking the impacts of controlled river flows to food security is challenging due to the variability in subsistence practices (Fauchald et al. Reference Fauchald, Hausner, Schmidt and Clark2017) and adaptive fishing strategies (Huntington et al. Reference Huntington, Begossi, Gearheard, Kersey, Loring and Mustonen2017). Accurate dam impact assessment therefore requires consideration of dynamic subsistence practices, adaptive responses and long-term monitoring (Shaffer et al. Reference Shaffer, Milstein, Yukuma, Marawanaru and Suse2017), a difficult task that is hardly ever done properly and/or independently analysed (Doria et al. Reference Doria, Athayde, Marques, Lima, Dutka-Gianelli and Ruffino2018), particularly during dam implementation. Mega-dam studies often infer impacts based on expected biodiversity loss (Ziv et al. Reference Ziv, Baran, Nam and Levin2012) or assess socioecological effects post-implementation (Hallwass et al. Reference Hallwass, Lopes, Juras and Silvano2013, Owusu et al. Reference Owusu, Obour and Nkansah2017), missing initial and probably more significant human subsistence changes.
Yet, recognition of the social-ecological impacts and costs of hydroelectric dams is increasing globally, leading to the removal of several dams in the USA and Europe (Poff & Hart Reference Poff and Hart2002). In the developing world, new dam proposals now face greater scrutiny, with social-ecological mitigation measures sometimes imposed in the short, medium and long term, although their effectiveness is often insufficient (Schapper et al. Reference Schapper, Unrau and Killoh2020). One reason for this is the disproportionate impacts on marginalized groups, including poor and minority communities that are heavily reliant on natural resources (Baird & Shoemaker Reference Baird and Shoemaker2007, Hanna et al. Reference Hanna, Langdon and Vanclay2016). This is evident amongst many First Nations in Canada (Windsor & McVey Reference Windsor and McVey2005), ethnic groups in Thailand and Laos (Foran & Manorom Reference Foran, Manorom, Molle, Foran and Kakonen2009) and Indigenous and riverine groups in Brazil (Diamond & Poirier Reference Diamond and Poirier2010), which often lack political voice and are disproportionately impacted by dam projects.
With two-thirds of the Amazon rainforest and numerous large, free-flowing rivers, Brazil has become a focus for hydropower development (Winemiller et al. Reference Winemiller, McIntyre, Castello, Fluet-Chouinard, Giarrizzo and Nam2016). The magnitude and visibility of such projects have historically been used to mobilize politicians across the political spectrum (Burrier Reference Burrier2016), but their social, ecological and local food security impacts have also often been downplayed across this vast region that combines extreme poverty and a strong dependence on natural resources. This study examines the case of the Belo Monte Dam to investigate whether and how it has affected the food security of vulnerable Amazonian populations throughout its construction and initial years of operation (2012–2021). Bids for its construction were opened in 2011. In 2016, the dam began operating, although its full operation, with all 18 turbines functioning, occurred only at the end of 2019. To maintain its economic viability, particularly during the dry season, 77% of the Xingu River’s stretch (a 100–km region known as the ‘Volta Grande’) had to be diverted, changing the local environment. Belo Monte Dam is highly controversial due to its low energy production, which is estimated to be 69% lower than its capacity (Hernandez Reference Hernandez2012), and its social-ecological effects on a previously relatively pristine area inhabited by Indigenous and riverine communities. Belo Monte Dam has significantly affected fish diversity (Fitzgerald et al. Reference Fitzgerald, Perez, Sousa, Gonçalves, Py-Daniel and Lujan2018), with effects varying by region and time elapsed since construction (Keppeler et al. Reference Keppeler, Andrade, Trindade, Sousa, Arantes and Winemiller2022). However, its effects on fish-dependent riverine groups remain unclear. Thus, our main hypothesis was that the dam’s construction and operation have led to reductions in fish consumption amongst riverine communities, with the extent of these changes varying depending on community location. Communities closer to Belo Monte Dam, particularly those near regions where river flow has been extensively reduced, were expected to experience more pronounced declines in fish consumption, including less frequent consumption and smaller amounts of fish being consumed.
Materials and methods
Belo Monte Dam is a ‘run-of-the-river’ (ROR) facility, generating power from a flowing river and having a reservoir with limited capacity for water storage. In comparison to other dams, Belo Monte Dam has a different engineering architecture, using the huge natural bend made by the Xingu River before it reaches the quaternary soils of the Amazon plains. It uses an initial smaller dam that creates a reservoir to divert water into a 20-km artificial channel, which, in turn, directs the water to the main, larger dam that is responsible for generating the majority of the electricity (Fig. 1).

Figure 1. Map of the study region showing the regions that were sampled and analysed separately. The colours represent the limits of each region: blue = reservoir (the area farther away from Altamira and dam 1 corresponds to the rural part of the reservoir, whereas the area closer to Altamira corresponds to the urban area of the reservoir); violet = de-watered reach; orange = downstream – rural; pink = downstream – urban. Numbers 1 (Pimental Dam) and 2 (Belo Monte Dam) represent the locations of the two dams, which are connected by an artificial channel. HPP = hydroelectric power plant; IL = Indigenous lands.
Because of the significant changes in river flow, particularly in the Volta Grande region, the Brazilian National Waters Agency (ANA) proposed a hydrograph (Table 1) that would involve alternate years of 4000 (hydrograph A) and 8000 m3/s (hydrograph B) of water flow in April – the peak of the flooding season. Historical flow in the region between 1931 and 2008, however, was 20 000 m3/s. A strong El Niño in 2015 (before the turbines started working) caused the water flow in April to drop to c. 10 000 m3/s, leading to severe negative impacts on fishing and navigation (Pezzuti et al. Reference Pezzuti, Zuanon, Ribas, Sawakuchi, Lopes and Carneiro2022). Prolonged droughts, as caused by this particular El Niño, decrease the availability and diversity of food resources for fish, which can affect fish diet and behaviour depending on how selective they are (Pereira et al. Reference Pereira, Tencatt, Dias, de Oliveira and Agostinho2017). Ultimately, an El Niño can affect fish growth and reproduction and the composition and structure of the fish assemblage (Alves et al. Reference Alves, Andreotti, Agostinho and Gomes2021).
Table 1. Historical mean monthly discharge of the Xingu River at Belo Monte and the projected hydrographs proposed (‘consensus hydrograph’) to be tested for 6 years. Hydrographs A and B are proposed to be used in alternate years.

The establishment of the dam affected at least 52 000 people; 40 000 had to be relocated, mostly due to the reservoir construction, while 12 000 people were directly affected but remained in the region (Francesco Reference Francesco2021).
Data sources
Data on fish consumption collected from 2012 to 2021 in five fishing communities located in the northern Brazilian state of Pará, in the eastern Amazon basin, along the Xingu River (Fig. 1), were obtained from a database provided by the Brazilian Environmental Agency (IBAMA). The database includes raw data and reports of the monitoring programmes on Belo Monte Dam. Sampling is part of the licensing agreement established by IBAMA (Alfredsen et al. Reference Alfredsen, Amundsen, Hahn, Harrison, Helland and Martins2022). The area affected by Belo Monte Dam, both directly and indirectly, requires continuous monitoring to ensure compliance with environmental obligations and mitigation measures, assessment of the long-term impacts of the dam and gathering of data for future projects. The area affected is determined through environmental impact assessments and ongoing technical analyses. The monitored human communities include those directly impacted (e.g., where reservoirs were created or significant river flow was diverted) and indirectly affected downstream, below the point where river flow normalizes. Indigenous communities are assessed separately under a different protocol. A consulting team hired by the operating company carried out the sampling. If significant changes in people’s diet occur, the government can demand mitigation actions from this company.
This database contains information from 2012 through to 2021 on whether fish were consumed or not (which we treat as ‘fish presence’ throughout the manuscript), fish species consumed (data on particular species being consumed improved after 2015), fish consumption per household in kilograms and the number of individuals sharing each meal. The last variable may not reflect the average family size, as extended families could be dining together. Data were collected through daily forms completed by the person responsible for meal preparation or a literate household member in each case. The data collection spanned 7 consecutive days within a single month for each season (rising water, high water, receding water and low water seasons). Not all seasons were sampled in certain years: 2012 excluded the rising and high water seasons, 2014 excluded the receding water season and 2015 and 2016 excluded the rising water season. The number of meals sampled per year varied from 729 (in 2014) to 4174 (in 2021), with an average of 2849 meals per year. Variation in meals sampled was probably due to families dropping out or joining the research effort along the way.
We organized the data around five distinct regions: (1) ‘reservoir rural’ (rural communities near the reservoir in Altamira municipality, the main urban settlement in the region); (2) ‘reservoir urban’ (urban communities near the reservoir in Altamira); (3) ‘de-watered reach’ (Ilha da Fazenda community); (4) ‘downstream urban’ (the urban region of Vitória do Xingu municipality and Belo Monte neighbourhood, downstream from the dam; restored river flow); and (5) ‘downstream rural’ (the rural region between Porto de Moz and Vitória do Xingu municipalities, also downstream from the dam; normalized river flow). These regions capture the variability expected in river levels, from the lowest in the de-watered reach, to downstream regions and urban and rural communities closest to the reservoir, where water levels were the highest. We assume that the sampled individuals fished in or near their respective regions, as it would be unlikely for them to venture farther away due to factors such as distance, time and costs. It is also possible that people consumed purchased fish in some meals, an event that is more likely to occur in urban areas than rural zones.
Considering that the data were collected by a household member and not by a researcher, only vernacular fish names were provided. Many correspond to multiple species previously identified by the consulting team. For instance, tucunaré (peacock bass) includes Cichla melaniae, Cichla monoculus and Cichla pinima, but specific species in meals could not be determined. Hence, tucunaré is categorized as Cichla spp.
River level information came from the Brazilian National Water Agency (http://www.snirh.gov.br/hidroweb) for the downstream area (used for both the rural and urban sections), the reservoir (used for the rural and urban sections) and the de-watered region.
Statistical analyses
We divided our analytical framework into two steps. First, we used a time-series approach to check whether changes in fish consumption were related to the dam construction (prior to the reservoir filling and turbine operation), operation and/or the 2015–2016 El Niño-induced drought. Second, we investigated factors that could affect fish consumption, hypothesizing that a reduction in river level (discharge) would, by affecting fish, reduce both instances of fish in meals (i.e., fish presence) and per capita fish consumption.
In step 1, we used the ‘strucchange’ package (Zeileis et al. Reference Zeileis, Kleiber, Krämer and Hornik2003) in R software (R Development Team 2022) to assess changes in normalized per capita fish consumption (g fish/person) over time. This test for structural changes examined statistical changes (breakpoints) in the mean of the time series and in the linear regression coefficients (Zeileis et al. Reference Zeileis, Kleiber, Krämer and Hornik2003). The ‘breakpoints’ function was used to find the optimal number of segments and the F-statistic compared the model before and after a breakpoint. We ran the analysis separately for the five distinct regions and a further one for ‘all regions’. Taking a yearly average of the daily data, we calculated the corresponding break year (i.e., the year when there was a departure from the previous trend). We chose a yearly scale for sampling due to the lack of continuous sampling throughout the year and irregular sampling of all four water seasons. We did not limit the number of breaks that the analyses could identify.
In step 2, we used a Bayesian hurdle model to investigate factors affecting fish presence in meals and fish consumption given that fish were not present in most meals (73%), thus making fish consumption a zero-inflated variable. The hurdle model consisted of two sub-models: one to quantify the occurrence of fish consumption (binary variable that measured whether fish were eaten or not); and the other to quantify the magnitude of fish consumption when it did occur. We investigated which factors affected the occurrence (binary variable ‘fish presence’) and abundance of fish (defined as fish consumed in kg/person/meal).
As data were collected multiple times from families in the same locality, on the same day, in the same affected region and without any means to identify the family, we took the mean of both variables (‘fish presence’ and ‘fish consumption’) by date, locality and affected region to avoid dependency issues. For example, if 10 meals were sampled in one specific affected region (e.g., ‘downstream rural’) on a given day, a single average value was used instead of one value per meal (for ‘fish presence’, the average values represent the proportion of meals with fish). We modelled ‘fish presence’ using a β-distribution and ‘fish consumption’ using a γ-distribution (Supplementary Material 1) and found no temporal dependency in the data.
Models were fitted using the integrated nested Laplace approximation approach (Rue et al. Reference Rue, Martino, Lindgren, Simpson, Riebler and Krainski2009) in R software (R Development Team 2022). Default vague Gaussian distribution priors with a 0 mean and a variance of 100 were implemented for all of the fixed effects. We started from the complete models and tested various combinations with the removal of variables (Table 2). The best model was chosen based on the lowest widely applicable information criterion and deviance information criterion. The complete R code is available at https://github.com/MartaCousido/Large-hydroelectric-dams-a-grim-future-for-the-food-security-of-vulnerable-Amazonian-populations.
Table 2. Comparison of the hurdle models used to explain fish presence in meals and fish consumption per meal per capita in the five regions affected by the Belo Monte Dam (reservoir – rural and urban, downstream – rural and urban, and de-watered reach). Y
i
and Z
i
are the average ‘fish presence’ and ‘fish consumption’ response variables, with
 $\mu _i^Y$
representing the expected average ‘fish presence’ and
$\mu _i^Y$
representing the expected average ‘fish presence’ and
 $\mu _i^Z$
representing the expected ‘fish consumption’ where fish were present in the meal.
$\mu _i^Z$
representing the expected ‘fish consumption’ where fish were present in the meal.
 ${\alpha ^Y}$
and
${\alpha ^Y}$
and
 ${\alpha ^Z}$
are the intercepts of each of the variables ‘fish presence’ and ‘fish consumption’,
${\alpha ^Z}$
are the intercepts of each of the variables ‘fish presence’ and ‘fish consumption’,
 $\beta _0^Y$
and
$\beta _0^Y$
and
 $\beta _0^Z$
are the coefficients associated with the reference level of the affected region variable (which is de-watered reach) for ‘fish presence’ and ‘fish consumption’, respectively,
$\beta _0^Z$
are the coefficients associated with the reference level of the affected region variable (which is de-watered reach) for ‘fish presence’ and ‘fish consumption’, respectively,
 $\mathop \sum \nolimits_{j = 1}^C \beta _j^Y{D_{ij}}{\rm{\;}}\left( {{\rm{or\;}}\mathop \sum \nolimits_{j = 1}^C \beta _j^Z{D_{ij}}} \right){\rm{\;}}$
corresponds to the parametric factor effect of the affected region,
$\mathop \sum \nolimits_{j = 1}^C \beta _j^Y{D_{ij}}{\rm{\;}}\left( {{\rm{or\;}}\mathop \sum \nolimits_{j = 1}^C \beta _j^Z{D_{ij}}} \right){\rm{\;}}$
corresponds to the parametric factor effect of the affected region,
 $\;{f_3}\left( {leve{l_i}} \right)$
and
$\;{f_3}\left( {leve{l_i}} \right)$
and
 ${g_3}\left( {leve{l_i}} \right)\;$
are the second-order random walk (RW2) river level rate effects,
${g_3}\left( {leve{l_i}} \right)\;$
are the second-order random walk (RW2) river level rate effects,
 ${g_4}\left( {richnes{s_i}} \right)\;$
is the RW2 effect of fish richness in meals
${g_4}\left( {richnes{s_i}} \right)\;$
is the RW2 effect of fish richness in meals
 $,\;{f_1}\left( {tim{e_i}} \right)$
,
$,\;{f_1}\left( {tim{e_i}} \right)$
,
 ${g_1}\left( {tim{e_i}} \right)$
,
${g_1}\left( {tim{e_i}} \right)$
,
 ${f_2}\left( {seaso{n_i}} \right)\;$
and
${f_2}\left( {seaso{n_i}} \right)\;$
and
 ${g_2}\left( {seaso{n_i}} \right)$
are the time and season RW2 effects and
${g_2}\left( {seaso{n_i}} \right)$
are the time and season RW2 effects and
 ${\gamma ^Y}tim{e_i}$
and
${\gamma ^Y}tim{e_i}$
and
 ${\gamma ^Z}tim{e_i}$
are linear time effects.
${\gamma ^Z}tim{e_i}$
are linear time effects.

DIC = deviance information criterion; WAIC = widely applicable information criterion.
Results
Between 2012 and 2021, both the presence of fish in meals (from 37.6% to 19.4%) and the actual consumption per meal per household (by 58.5%, from 0.62 to 0.22 kg) declined. The average number of people sharing meals for the whole region also decreased from 4.7 in 2012 to 4.1 in 2021 but was nevertheless associated with a drop in consumption from 0.13 kg per capita per meal in 2012 to 0.06 kg per capita per meal in 2021. The main fish served in meals shifted from 2015 to 2021 (the period during which more consistent data on fish species were available), with pescada (Sciaenidae), which are lentic-adapted species, gaining relevance and tucunaré (Cichla spp.) and pacu (Serrasalmidae) losing importance (Fig. 2).

Figure 2. Changes in the diets of riverine communities affected by the Belo Monte Dam. The upper part of the figure indicates the presence (in percentage) of each fish in meals in each year. The data cover the period from 2015 to 2021 (due to the low – 15% – identification of fish by local vernacular names before this period) and reveal a decrease in the fish species present in meals. The eight highlighted species accounted for 86% of the average fish consumption. ‘Others’ includes 35 additional fish species identified by their vernacular names and some unidentified fish (average of 3%) from the sample. The lower part of the figure shows changes in fish consumption (kg/meal/household) and the average number of people sharing each meal from 2012 to 2021.
All regions experienced a single shift in fish consumption, although the exact year of the shift varied. Prior to the full operation of the dam (2013–2015), two regions (downstream – rural and urban) witnessed decreases in their consumption patterns. The rural part of the reservoir, which had the highest fish consumption per person per meal, particularly when the reservoir was filled (2015), showed a statistically significant downward shift in fish consumption in 2016, coinciding with the end of the El Niño period (Supplementary Material S1, Figs S1–S3 & Tables S1 & S2). Consumption in the de-watered reach shifted decisively down in 2017, although consumption had been steadily declining since 2013. All regions combined experienced a negative shift in fish consumption in 2015 (Fig. 3), probably influenced by the substantial decrease in fish consumption in the rural region of the reservoir. The urban part of the reservoir (town of Altamira), where consumption was the lowest at the outset, saw a slight increase from 0.033 kg/person/meal in 2013 to 0.053 kg/person/meal in 2014–2015, before suffering a downward shift in 2019. Between 2020 and 2021, fish consumption around the urban reservoir decreased to 0.032 kg/person/meal.

Figure 3. Breakpoints (shifts) identified in the fish consumption (kg/person/meal) time-series data between 2012 and 2021 in the area of influence of the Belo Monte hydroelectric dam. The red line, determined by the F-statistic, identifies the year during which a shift towards a different state in fish consumption happened. ‘All regions’ represents all five regions combined.
Fish presence in meals and consumption (in kg) differed across regions. People closest to Altamira, the urban part of the reservoir, ate fish less often (14% of meals) and had the lowest per capita consumption (0.044 kg/person/meal for the entire period). Rural areas around the reservoir had fish in 45% of meals and had the highest consumption (0.2 kg/person/meal). The average fish consumption per capita across all regions shifted in 2015 from 0.131 kg/person/meal between 2012 and 2015 to 0.094 kg/person/meal in 2016; fish presence regardless of the amount consumed also declined from 36% to 26% over the same period. Average per capita fish consumption continued to decrease, reaching a minimum in 2021 (0.055 kg/person/meal), a drop of 55% in relation to the 2012–2015 period; fish presence followed a similar pattern, decreasing from 36% to 19%. The highest average per capita fish consumption was in 2014 (0.144 kg/person/meal; Fig. 3 – all regions), when fish were present in 36% of all meals.
The complete model, containing the variable ‘affected region’ (Model 2 of Table 2), best explained ‘fish presence’ (β) and amount of ‘fish consumed’ (γ). People residing in the rural area (reservoir and downstream) showed a higher probability of including fish in their meals, followed by those in the downstream urban area, de-watered reach and reservoir urban area. The presence of fish in meals did not significantly differ between the de-watered reach and the downstream urban area. Among those including fish in their meals, individuals living near the rural part of the reservoir consumed larger portions compared to those from other areas. Although people in the de-watered reach were less likely to include fish in their meals, when they did, their portions were larger compared to those in the downstream urban, reservoir urban and downstream rural areas (Supplementary Material S2, Fig. S4 & Tables S3 & S4). These regional effects can be partly attributed to fluctuations in river level, as these two variables were correlated. This outcome was expected, given the substantial variations in river level observed across the regions (Fig. 4a).
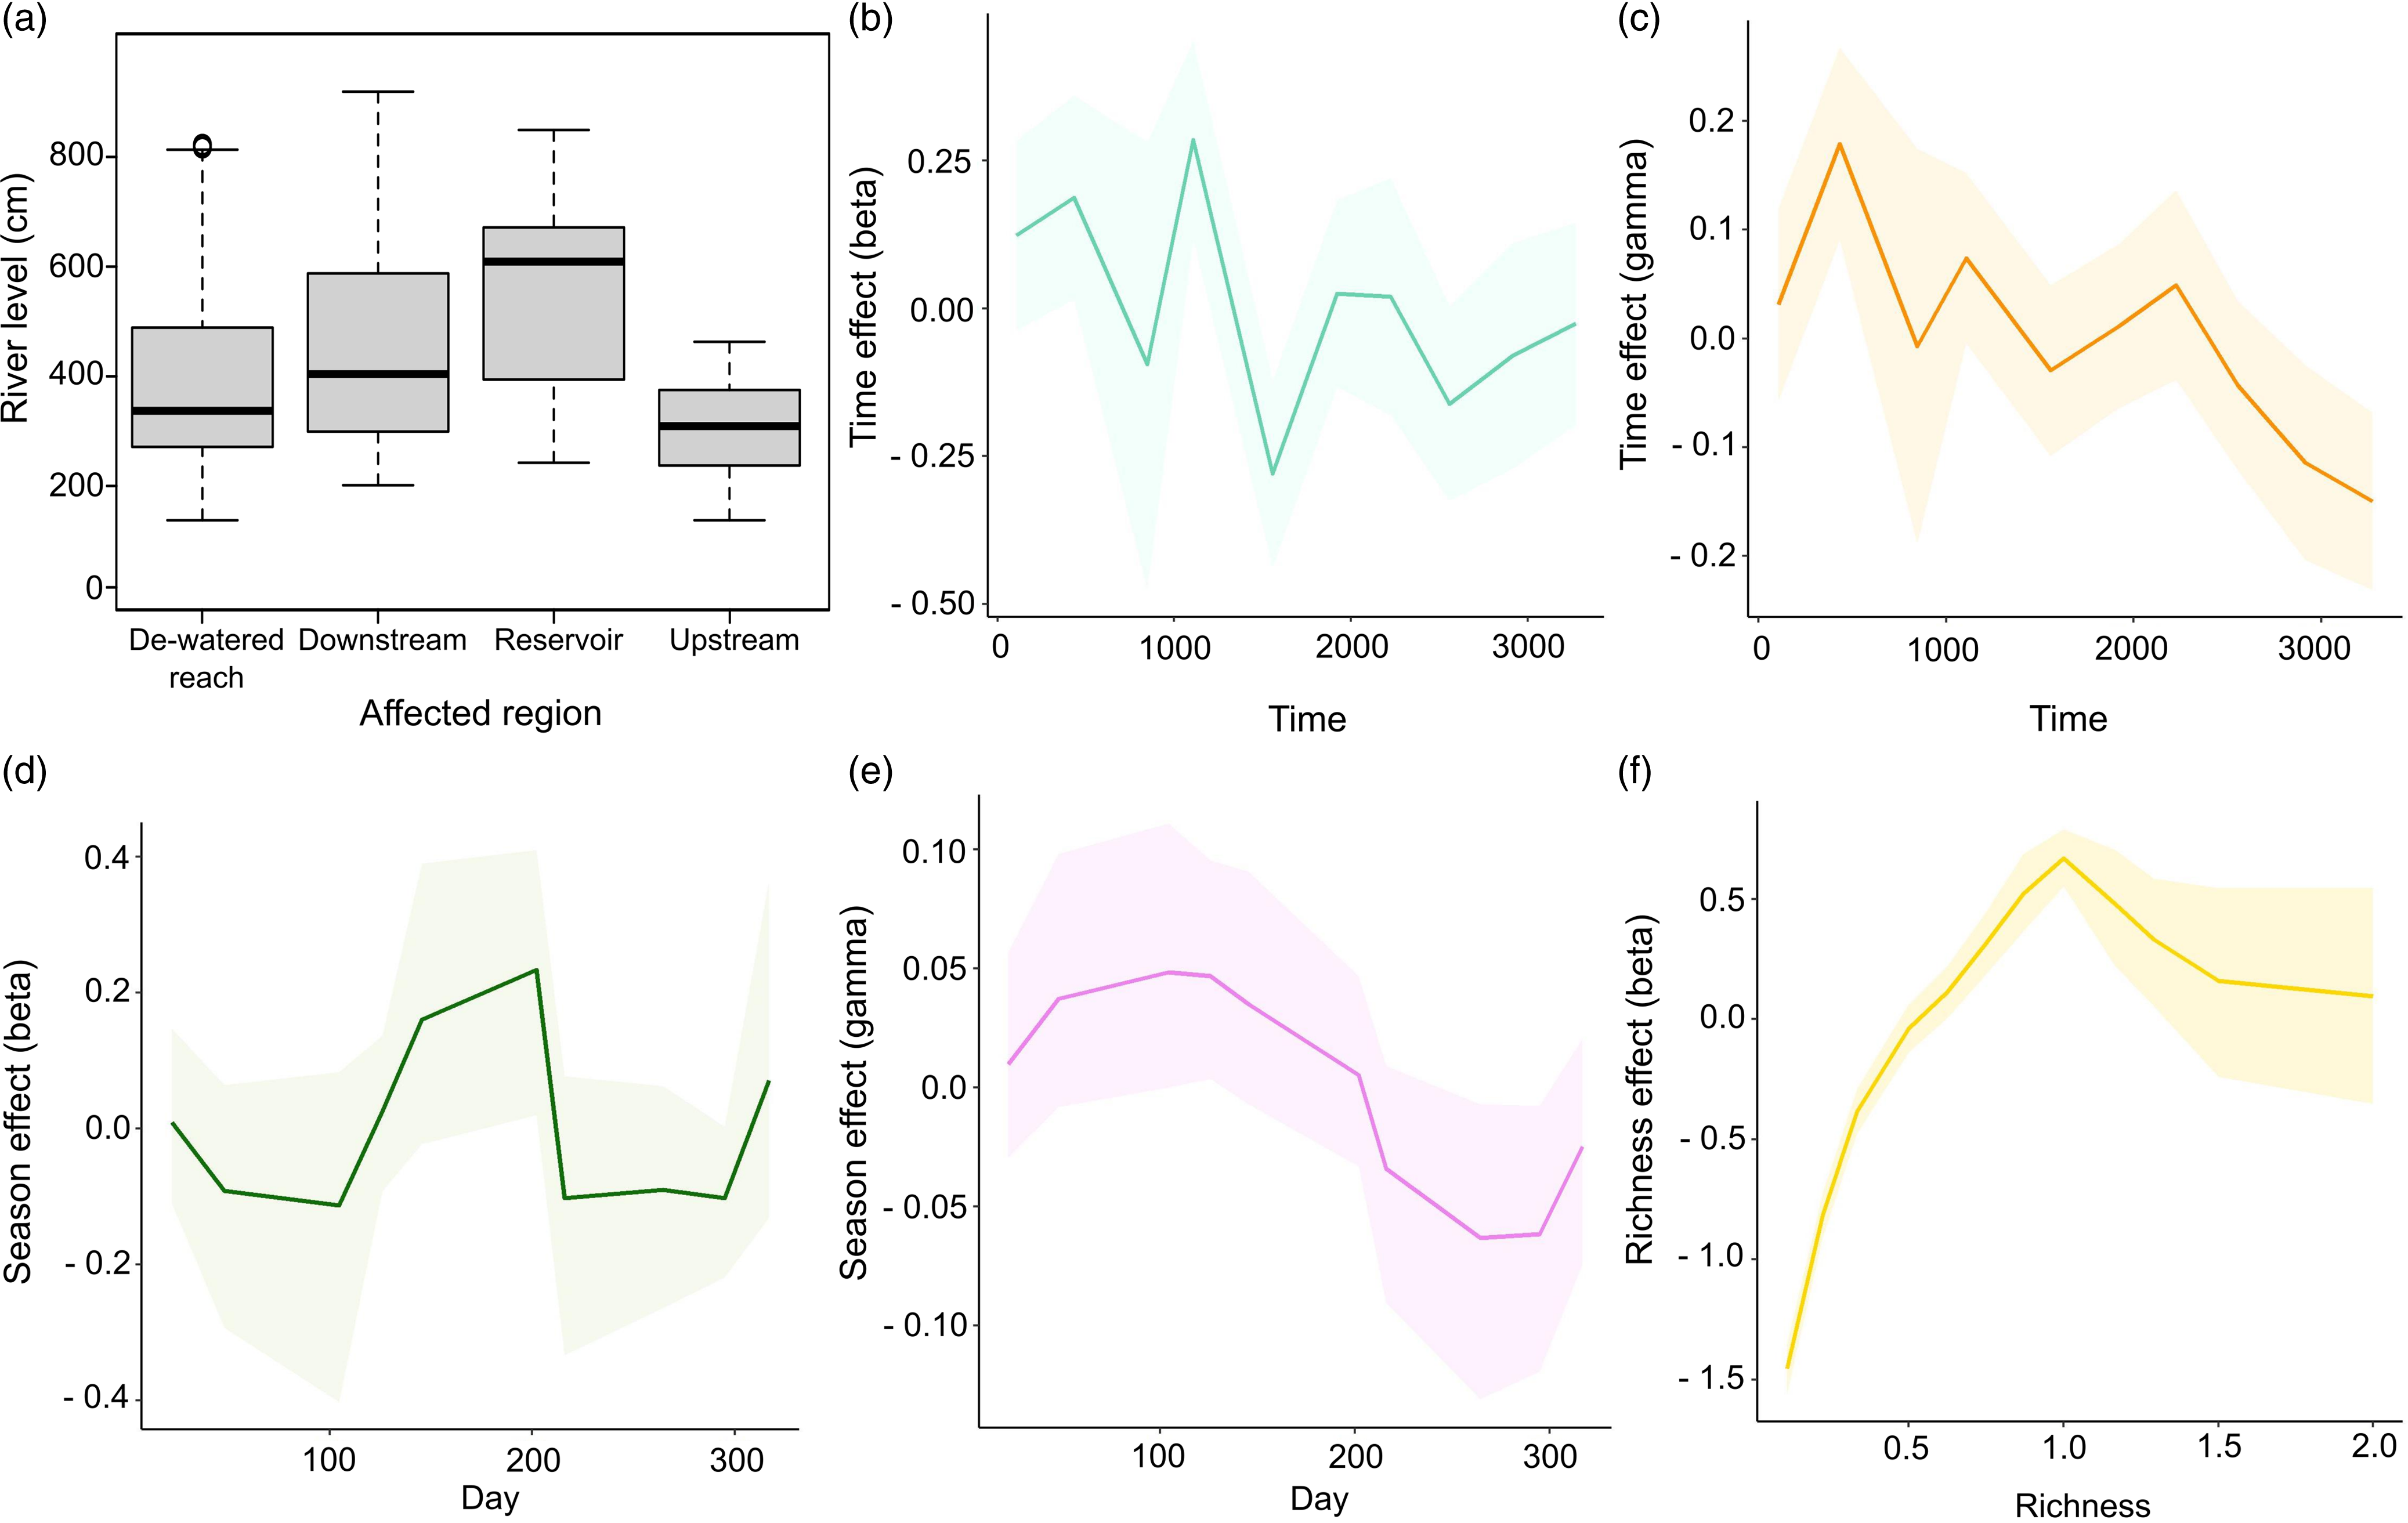
Figure 4. (a) Box plot showing the variation in the river level per affected region over the same period. (b–f) Functional responses of the independent variables used in the Bayesian hurdle model to explain variation in fish consumption per capita per meal between 2012 and 2021 in the region affected by the Belo Monte Dam. The richness effect (f) needs to be interpreted whilst considering that the data were transformed to derive the average consumption per day of the location.
The model confirmed a decline in fish presence (Fig. 4b) and consumption of larger fish portions in recent years (Fig. 4c). Fish were less likely to be present in meals between January and March and between August and October, and they were also consumed in smaller portions between August and October (drought season; Fig. 4d,e). Fish amount varied with fish richness, with slightly higher consumption occurring when only one species was present (Fig. 4f).
Discussion
The environmental and physical impacts of dams are inextricably intertwined with their social, cultural, economic and health-related impacts (Grisotti Reference Grisotti2016, Bro et al. Reference Bro, Moran and Calvi2018), and the Belo Monte hydroelectric dam is no exception (Fearnside Reference Fearnside2017). Yet, monitoring such changes prior to and during impacts is rare or, when done, is treated as a ‘bureaucratic burden’ (Doria et al. Reference Doria, Athayde, Marques, Lima, Dutka-Gianelli and Ruffino2018). Delayed evidence of these changes complicates attributing responsibility to dam operators for potentially negative consequences.
Our findings suggest that changes can come early on, and in the case of Belo Monte Dam such changes impacted fish, a vital dietary staple in the Amazon (Isaac & de Almeida Reference Isaac and de Almeida2011). Our analysis shows a significant reduction in fish presence and consumption in the Belo Monte Dam-affected region that coincides with dam construction, operation and an El Niño event. These findings offer partial support to our expectation that areas closer to the dam, such as the de-watered reach, saw greater impacts. Yet, we showed that downstream areas, where the river flow is normalized, have been severely impacted. Three out of five negative shifts in fish consumption occurred prior to the El Niño event, with only one region – the reservoir urban (the town of Altamira) area – seeing a slight increase in fish consumption after 2015 (Supplementary Material S2 & Tables S3 & S4), although this region also went through a downward shift in fish consumption in 2019. Fish consumption was especially low in the drought season and towards the end of the rising/beginning of the high water season. The species composition of local fish meals may be changing – for example, with an increased frequency of consuming lentic-adapted species such as pescadas (Sciaenidae), particularly for those people living close to the reservoir (Silvano et al. Reference Silvano, do Amaral and Oyakawa2000). Having multiple fish species in meals did not increase fish consumption by mass per person; instead, higher intakes were observed when only one species was present.
Our analysis of fish consumption and diet richness in the region affected by the Belo Monte Dam following its first 10 years of construction and operation suggests two main conclusions. First, despite a decrease in the number of people sharing meals, fish consumption decreased both overall and on a per capita basis, except in Altamira, where it was consistently the lowest. Second, the local population’s dietary diversity has been affected. People may be compensating for the decreased fish consumption by diversifying their diets when possible. Diversifying diets and accepting items that are usually ignored is a known strategy for dealing with the risks of food shortage (MacCord & Begossi Reference MacCord and Begossi2006). However, this strategy might not be sufficient if fish availability continues to decrease, a pattern that has been shown to arise in regions affected by dams long after their implementation (Hallwass et al. Reference Hallwass, Lopes, Juras and Silvano2013, Owusu et al. Reference Owusu, Obour and Nkansah2017). In fact, for Belo Monte Dam there is already evidence that fish richness significantly decreased after the beginning of dam operation, being particularly evident in lotic regions (Keppeler et al. Reference Keppeler, Andrade, Trindade, Sousa, Arantes and Winemiller2022). If diversifying diets does not work for whatever reason, people may resort to more drastic strategies, such as migration out of the area (Nagabhatla et al. Reference Nagabhatla, Pouramin, Shin, Sharma, Glickman, Brahmbhatt, Squires and Gaur2020). Although the Belo Monte region has seen rural migration for job opportunities during construction (Calvi et al. Reference Calvi, Moran, da Silva and Batistella2020), further research is needed in order to understand how decreased fish availability has impacted family migration and household resilience (Crush Reference Crush2013, Warner & Afifi Reference Warner and Afifi2014).
The construction of the dam resulted in physical changes that directly affected local subsistence, evident through multiple and always negative shifts in our study. The 2015–2016 El Niño event highlighted a region already facing significant challenges in its fish diet, potentially contributing to the declines in fish consumption observed even amongst communities near the reservoir, despite reservoirs typically being productive parts of impounded rivers in the first years after impoundment. It is also possible that, in addition to the El Niño, the reservoir was already transitioning into a new but expected low-yield phase following the initial trophic surge (Hoeinghaus et al. Reference Hoeinghaus, Agostinho, Gomes, Pelicice, Okada and Latini2009).
The relationship between river level and region played a crucial role in explaining the fluctuations in fish frequency and consumption. It was expected that fish scarcity would be primarily influenced by natural seasonal fluctuations (Oliveira et al. Reference Oliveira, Dórea, Bernardi, Bastos, Almeida and Manzatto2010) and artificial water control (Hallwass et al. Reference Hallwass, Lopes, Juras and Silvano2013), and our analyses confirm that these fluctuations disproportionately impacted the de-watered stretch and downstream region, where the natural flow was severely disrupted. The decrease in fish consumption following damming, particularly in downstream regions, aligns with reports of reduced fishery yields elsewhere in the world (Dugan et al. Reference Dugan, Barlow, Agostinho, Baran, Cada and Chen2010, Hallwass et al. Reference Hallwass, Lopes, Juras and Silvano2013, Santos et al. Reference Santos, Pinto-Coelho, Fonseca, Simões and Zanchi2018, Arantes et al. Reference Arantes, Fitzgerald, Hoeinghaus and Winemiller2019), but the magnitude of the loss observed in this study appears to be unprecedented for the Amazon. The unseen impact attributed to Belo Monte has been detected in fish community data, providing a warning about the supposedly reduced ecological impacts of ROR dams (Keppeler et al. Reference Keppeler, Andrade, Trindade, Sousa, Arantes and Winemiller2022). Fish intake in the Amazon varies dramatically by region, ranging from 0.37 kg/person/day (Cerdeira et al. Reference Cerdeira, Ruffino and Isaac1997) to 0.81 kg/person/day (Corrêa et al. Reference Corrêa, Kahn and Freitas2014), with fish accounting for up to 70% of all animal protein consumed (Begossi et al. Reference Begossi, Salivonchyk, Hallwass, Hanazaki, Lopes and Silvano2019). Yet, in the Belo Monte area, per capita consumption quickly dropped to 0.06 kg/person/day from what was already a low level of 0.13 kg/person/day in 2012. The recovery of the ecosystem seems unlikely. Many fish species vital for human subsistence in the Amazon rely on normal river flows, based on local seasonality, and/or cannot use fish passages (Pelicice et al. Reference Pelicice, Pompeu and Agostinho2015, Arantes et al. Reference Arantes, Fitzgerald, Hoeinghaus and Winemiller2019), and they have therefore already shown significant community structure changes in, for example, fish richness and diversity (Keppeler et al. Reference Keppeler, Andrade, Trindade, Sousa, Arantes and Winemiller2022).
While it is challenging to establish direct causality between the Belo Monte Dam and decreased fish consumption due to the absence of pre-construction data, the observed changes in human diets raise concerns about further reductions in river flow. Moreover, these impacts were expected (Arantes et al. Reference Arantes, Fitzgerald, Hoeinghaus and Winemiller2019, Keppeler et al. Reference Keppeler, Andrade, Trindade, Sousa, Arantes and Winemiller2022) and predicted by the impact assessment studies (LEME 2009). Such reductions would probably lead to increased reliance on external markets for staple foods; however, this reliance will depend on employment or other cash sources, and heightened food insecurity and loss of food sovereignty might occur. Mitigation strategies should go beyond providing protein replacements, as these alternatives may lack the nutritional qualities of fish protein and could therefore contribute to an increase in chronic diseases (Piperata Reference Piperata2007, Silva & Padez Reference Silva and Padez2010). Additionally, the cultural significance of fish and water in Indigenous cosmologies should not be overlooked (Diamond & Poirier Reference Diamond and Poirier2010), and the loss of fish and fishing opportunities affects the ability of rural communities, especially children, women and the elderly, to sustain themselves (Rudolph & McLachlan Reference Rudolph and McLachlan2013). Replacing water-based with land-based proteins due to dam impacts can expand the food supply’s ecological footprint (Orr et al. Reference Orr, Pittock, Chapagain and Dumaresq2012). Loss of food security and sovereignty can disrupt livelihoods, as already observed in Altamira, the main town affected by the Belo Monte Dam, where social networks have broken down (Grisotti Reference Grisotti2016, Marin & Oliveira Reference Marin and Oliveira2016). Tearing apart the social fabric of a community can compromise how members address food hardships because in communities that are well structured individuals typically support each other through exchanging and donating food when needed (da Costa et al. Reference da Costa, de Melo and Lopes2014, Gurven et al. Reference Gurven, Jaeggi, von Rueden, Hooper and Kaplan2015).
Conclusions
Riverine communities living in the region affected by the Belo Monte Dam have suffered severe losses in fish consumption, the primary source of protein for rural populations living along the margins of the Amazon and its major tributaries. These losses have steadily increased since the dam’s implementation, which is in accordance with changes in fish community observed since then. While the Belo Monte Dam cannot be indisputably associated with these drastic changes in the Xingu people’s diet due to a lack of pre-dam data, its operation has probably exacerbated them. If river flow is further reduced for increased energy production, and especially if this is enhanced by extreme climate events, a more severe shortage of fish can be expected, exacerbating the food security crisis. This is particularly concerning in a country where the decision-making process behind dam construction appears to be influenced by a complex web of interests rather than being solely driven by meeting energy demands (Burrier Reference Burrier2016). Meanwhile, the consequences for food security, food sovereignty and livelihoods receive scant attention. This oversight is primarily due to the marginalized status attributed to those who bear the brunt of these consequences. It is crucial to recognize immediate and long-term food security issues caused by hydroelectric dams when weighing the advantages and disadvantages of mega-project developments.
Supplementary material
To view supplementary material for this article, please visit https://doi.org/10.1017/S0376892923000358.
Acknowledgements
We thank the riverine communities for patiently recording their diets despite their growing difficulties. We are grateful to IBAMA for sharing their data and addressing any questions and comments we had. Many experts kindly shared information, and Leandro Silva prepared the map.
Financial support
PFML and AB (in memoriam; 301592/2017-9) thank CNPq for a productivity grant (302365/2022-2) and FAPESP for a visiting research scholarship (2018/22087-4).
Competing interests
The authors declare none.
Ethical standards
None.


