Introduction
The marginal ice zone of the Southern Ocean is penetrated by intense ocean-wave fields, causing changes in the sea-ice concentration, floe-size distribution and, particularly near the ice edge, in the distribution of thicknesses (Reference Squire, Dugan, Wadhams, Rottier and LiuSquire and others, 1995). Floe-size distribution is under the direct control of waves, which break up the larger floes. This causes a gradual conversion from one floe-size distribution to another, the process being dependent upon the relationship between floe size and the dominant wavelengths of the incoming swell and on wave height. Land-fast ice, when bounded by the open ocean, is especially prone to the ravages of wave energy, and there is dramatic anecdotal evidence of break-up events propagating through previously intact fast-ice sheets. Such events are most likely to occur in the late spring/early summer when relatively high ambient temperatures weaken the sea ice, when the sea-ice thickness has been eroded by ablation processes, and when the wave-attenuating offshore pack ice is at its minimum extent.
Ocean waves incident on a continuous sea-ice sheet or on a field of floes are partially reflected at the ice edge, allowing some wave energy to continue beneath the ice. Reference Fox and SquireFox and Squire (1990, Reference Fox and Squire1991, Reference Fox and Squire1994) have shown that it is necessary to include the complete set of wave modes in the open-water region and beneath the sea ice if the reflection and transmission of ocean waves at the boundary is to be understood and modelled accurately.
In addition to knowledge of the behaviour of ice-coupled waves, we must also have an understanding of the response of sea ice to the repeated flexure that the waves produce. The fatigue behaviour of sea ice has been investigated by subjecting in situ cantilever beams of sea ice to repeated bending with zero mean load, the amplitude of the load being held constant (Reference Haskell, Robinson and LanghorneHaskell and others, 1996; Reference Langhorne, Haskell and ShenLanghorne and Haskell, 1999). The beams were driven at a period of 8 s, this period being one that is predicted to cause large amplitude strains in 1−2 m thick ice sheets (Reference SquireSquire, 1993). The stress and strain at the upper ice surface at the hinge of the beam were calculated assuming a vertical distribution of sea-ice properties (Reference Kerr and PalmerKerr and Palmer, 1972). The results are summarized in the S-N curve in which the applied stress amplitude is plotted vs the number of cycles required to fail the specimen at that stress amplitude (Reference Langhorne, Haskell and ShenLanghorne and Haskell, 1999). We find that sea ice, in common with many other materials, can be induced to fail at stresses less than those required to fracture it in monotonic loading. Fatigue processes are inherently random in nature (Reference Sobczyk and SpencerSobczyk and Spencer, 1992) and there is significant scatter in the sea-ice fatigue data (Reference Langhorne, Haskell and ShenLanghorne and Haskell, 1999).
There are a number of mechanisms capable of causing sea-ice break-up. In the McMurdo Sound area, Antarctica, for example, stress from wind shear or ocean currents, and wind-generated waves have been considered, in addition to actions of wave energy (Reference Crocker and WadhamsCrocker and Wadhams, 1989). However, the present paper focuses on the destruction of land-fast ice, or vast floes, by ocean waves. The basic theoretical premise is that a position of maximum strain amplitude exists, particularly if viscous effects cause attenuation of the waves in the sea-ice sheet (Reference SquireSquire, 1993). The position of this maximum strain, although weakly affected by wave period, is strongly dependent on the ice thickness, being more distant from the ice edge in the case of thicker sea ice (Reference SquireSquire, 1993). The ice-coupled waves produce repeated bending in the sea-ice sheet, the greatest strains appearing at the position of the strain maximum. With time, progressive damage will occur in the sea ice, and there is evidence that a sea-ice sheet may be able to sustain partial fractures through its thickness (Reference Langhorne, Haskell and ShenLanghorne and Haskell, 1999). These partial cracks will propagate with each subsequent bending event of sufficient magnitude until the crack has extended through the entire thickness. A new ice edge is formed, and the remaining ice sheet is subjected to the wave forcing. In this way the entire ice sheet breaks into floes of similar size.
The key elements of the above account have been described quantitatively for waves of constant amplitude normally incident on a crack-free, horizontally homogeneous sea-ice sheet of uniform thickness (Reference Langhorne, Squire, Fox and HaskellLanghorne and others, 1998). This study included the fatigue behaviour of the sea ice (Reference Haskell, Robinson and LanghorneHaskell and others, 1996), making it quite different to earlier models which do not allow for progressive damage (Reference Crocker and WadhamsCrocker and Wadhams, 1989). However, our previous study could not be considered an accurate representation of the real world. The purpose of this paper is to perform calculations to predict sea-ice-sheet lifetime for a recorded ice-coupled wave time series of variable amplitude. In addition, we will discuss the effects of non-normal incidence at the ice edge, the presence of cracking in the sea-ice sheet and the effect of the alignment of c axes.
Variable-Amplitude Waves
Clearly the surface wave envelope of the ocean is not of constant amplitude, and the direct use of the S-N curve, which was constructed from experiments at constant amplitude, is not possible. The simplest method of dealing with this is to propose that fatigue failure is the result of the linear accumulation of partial fatigue damage (Reference Sobczyk and SpencerSobczyk and Spencer, 1992). The Palmgren-Miner rule then asserts that the damage fraction, Δi , is linearly proportional to the ratio
where ni is the number of cycles of operation at stress amplitude σi, and Ni is the number of cycles to failure at at. As the stress amplitude is changed, a new partial damage is calculated for this new amplitude. The total accumulated damage is then given by
In the present case we shall assess the contribution of each half-cycle. Consequently, we assume failure occurs when d > 2. We emphasize that this is the simplest method of dealing with waves of variable amplitude, and that it assumes that the damage caused by a stress cycle is independent of where it occurs in the load history. In addition, we are concerned here with strain, rather than stress, and the empirical relation derived from sea-ice fatigue experiments (Reference Haskell, Robinson and LanghorneHaskell and others, 1996; Reference Langhorne, Haskell and ShenLanghorne and Haskell, 1999) must be modified by dividing by a typical value of the partially relaxed modulus, Epr = 5 GPa. Thus

where a% and et are respectively the stress (in Pa) and strain amplitudes, and v is the brine fraction averaged through the ice sheet. The use of an elastic description in Equation (3) is clearly dubious given the stresses and strains are close to their values at failure, and given the presence of delayed elasticity at these loading rates. However, the partially relaxed modulus in Equation (3) was measured during the fatigue tests, and so parameterizes some of these effects. Thus, from the fatigue experiments we conclude that the number of cycles to failure at a given constant strain amplitude is

In the model each strain half-cycle is assigned a strain amplitude et, and the number of cycles to failure Ni is calculated from Equation (4). Each half-cycle contributes to the sum to produce the total accumulated damage d in Equation (2), and if d = 2 is exceeded the ice sheet is considered to have failed.
We test this calculation scheme on the constant-amplitude fatigue data (Reference Langhorne, Haskell and ShenLanghorne and Haskell, 1999) in Figure 1. Perfect correspondence between theory and experiment would place all points on the solid line. Since the original fatigue dataset is scattered about the empirical fit, we expect scatter in Figure 1. Our aim, which is achieved here, is to ensure that the data are randomly dispersed about the line of perfect correspondence between model prediction and measured lifetimes.
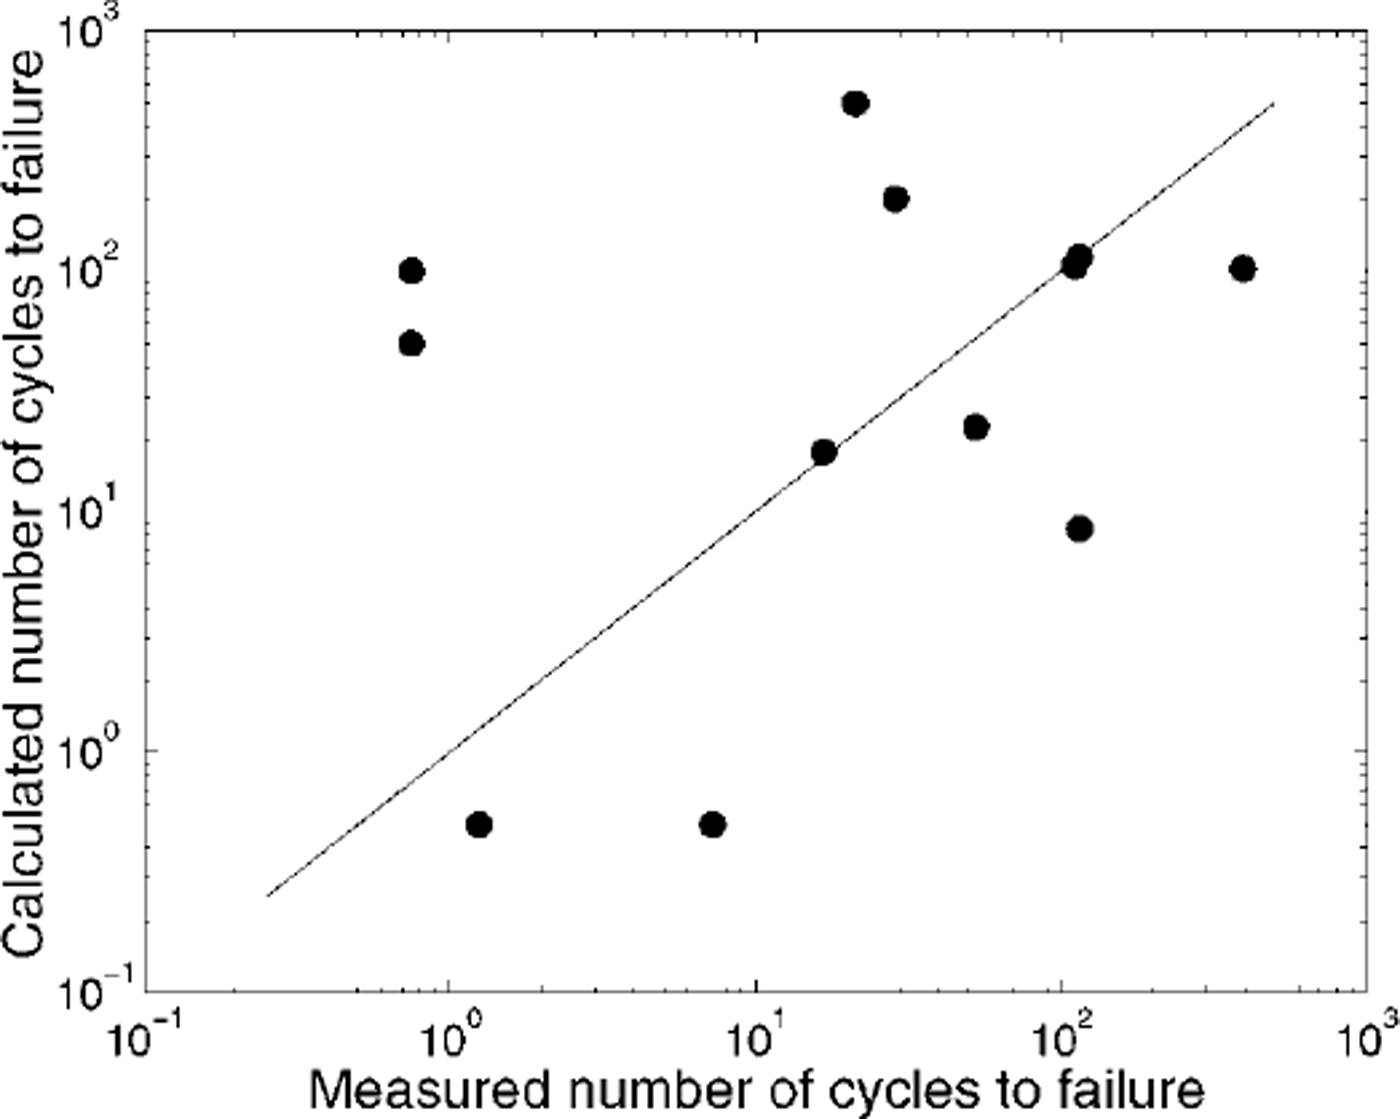
Fig. 1. Comparison between model prediction and measured lifetimes for the field data collected at constant load amplitude. perfect correspondence between theory and experiment would place all points on the solid line.
When dealing with waves of variable amplitude it is necessary to find a measure that characterizes the wave height, i.e. the vertical distance from a crest to an adjacent trough. In oceanographic studies it is conventional to characterize a sea by the significant wave height, Hs (Reference GodaGoda, 1970), defined such that
where

with s the power spectrum of the wave amplitudes, and / the frequency of the wave. We define a significant wave amplitude as half this height, and analogous quantities are used to characterize the strain.
Non-Normal Incidence
Reference Fox and SquireFox and Squire (1994) have developed a mathematical model describing the oblique reflection and penetration of ocean waves into shore-fast sea ice. A critical angle is predicted beyond which no travelling wave penetrates the ice sheet; in that case the deflection is due only to evanescent modes that are local to the ice edge. The thicker the ice sheet, or the shorter the period, the smaller is the critical angle (Reference Fox and SquireFox and Squire, 1994), and the less likely it becomes that waves will penetrate into the sea ice. A second effect of oblique incidence is that the principal strains are no longer normal to the ice edge, but may exhibit a much more complex behaviour.
As an example of the expected behaviour, the magnitudes of the larger principal strains are calculated at each penetration for 3s waves entering a lm thick sea-ice sheet over deep water (see Fig. 2). In this case, the critical angle is a little greater than 12°. When the wave is incident at >10°, the maximum in the strain is not at some specified penetration (approximately 30 m in this case), but occurs at the ice edge. There, the maxima remain until the critical angle is exceeded, and propagation into the ice cover no longer takes place.
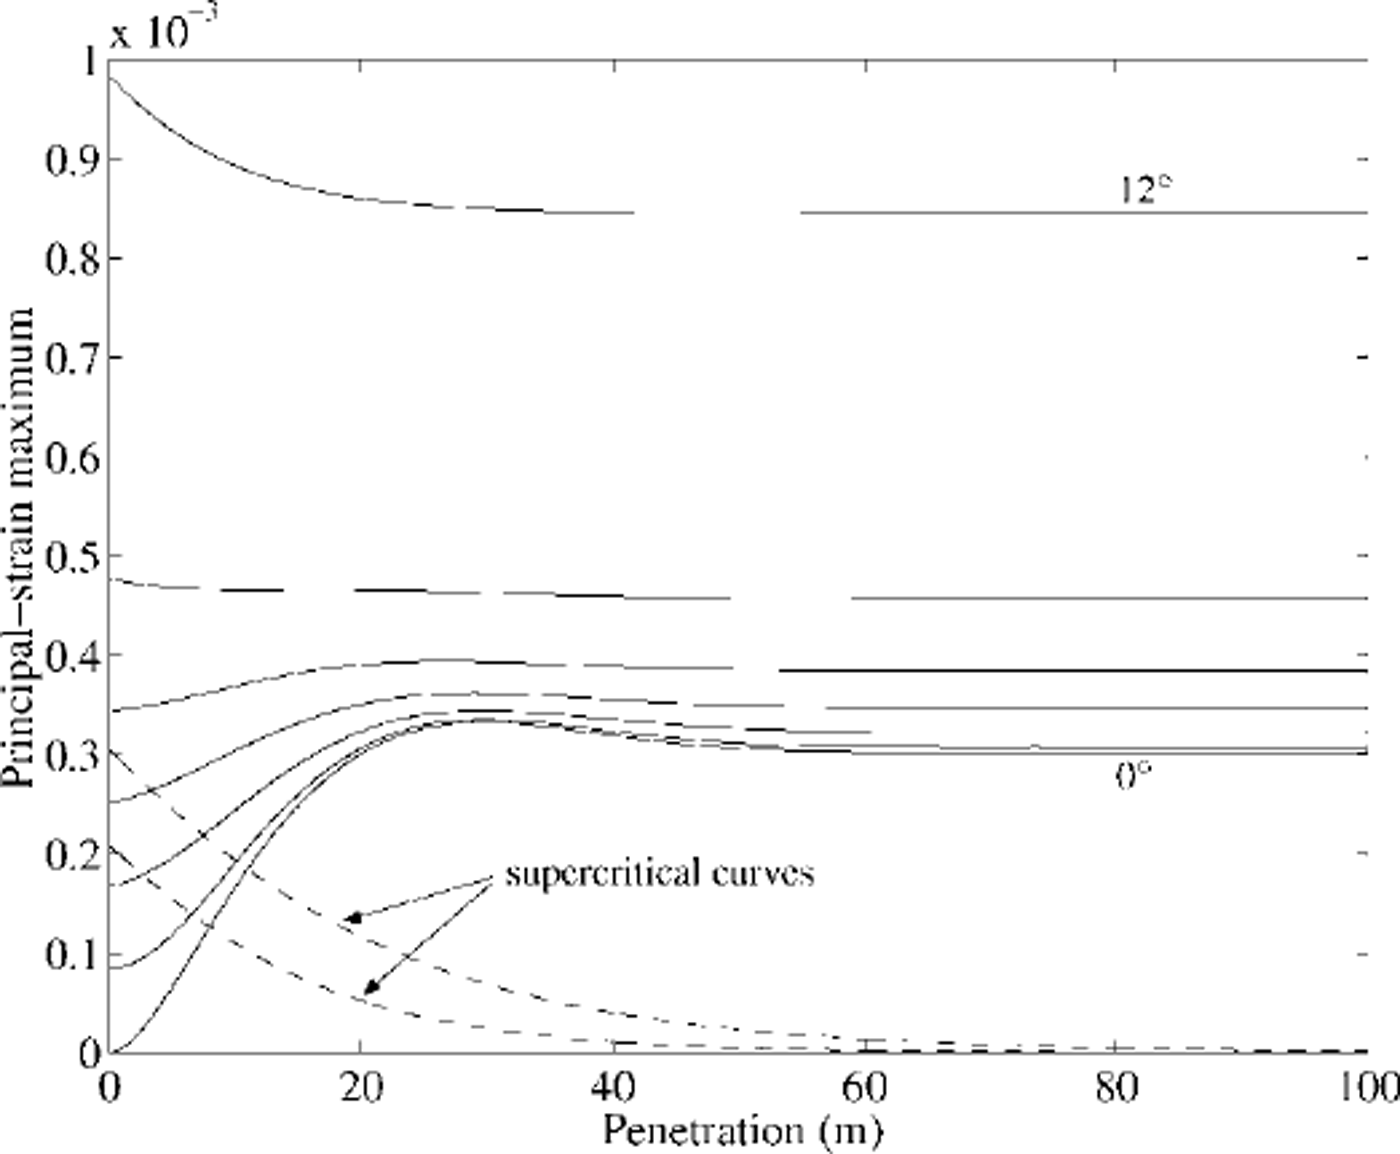
Fig. 2. Principal-strain maxima at each penetration plotted as a function of penetration into a 1 m thick sea-ice sheet for a wave period of 3 s. curves are shown for waves incident at the ice edge at angles increasing from 0˚,f, in 2° increments, to it. the critical angle is a little greater than it, and examples of the wave decay at supercritical angles are given.
Presence of Cracks
Recently the New Zealand Sea Ice Programme has been concerned with the effects of cracking in sea ice. The cracks are considered vertical and parallel-sided, and extend from the top to the bottom of the sea-ice sheet. Wave propagation both past a single crack in a uniform sea-ice sheet of infinite extent (Reference Squire, Dixon and ChungSquire and Dixon, 2000) and through multiple parallel cracks with random or periodic separation (Reference Squire and DixonSquire and Dixon, 2001) has been examined theoretically. In the case of the single crack, it is found that the cracked sea ice acts as a low-pass filter, but that there exist wave periods at which complete transmission into the sea-ice sheet occurs. For a periodically distributed field of cracks, there are a number of such periods. Thus the presence of open cracks will not prevent transmission of waves, although at most periods the transmission will be reduced in comparison with the crack-free case.
The physical and mechanical properties of refrozen, parallel-sided cracks have also been investigated. There is a reduction in flexural strength due to the presence of the refrozen crack, and this reduction depends on the width of the crack and the time allowed for refreezing. Consequently, the refrozen crack is likely to be a weak point in the sea ice, and hence a point of preferred fracture.
Influence of Aligned C Axes and their Orientation
It is well established that sea ice that freezes in the presence of a current develops a preferred c-axis alignment in the direction of the current (e.g. Reference Weeks and GowWeeks and Gow, 1980). It has also been well known for some time that the mechanical properties of aligned sea ice depend on the angle between the direction of stress and the mean c-axis direction (e.g. Reference Richter-MengeRichter-Menge, 1991). In areas of McMurdo Sound, where we have observed aligned c axes, our unpublished results show that the flexural strength is 25% smaller when the beam is allowed to fail along a plane perpendicular to the mean c-axis direction. Where there is no evidence of c-axis alignment we see no dependence of flexural strength on beam orientation. No fatigue experiments have been performed with regard to the orientation of the specimens with respect to c-axis direction.
A Case-Study
The experiment took place at the ice edge of McMurdo Sound in November 1992. In particular, we describe wave strain measurements made on 30 November. The dispersion and attenuation of ice-coupled waves close to the ice edge have already been described in detail in Reference Squire, Rottier, Fox, Zhouwen, Tang, Preller and HuidingSquire and others (1994), including a comparison between data and theoretical predictions. Details of the field site showing the relative orientations of incident wind and sea, ice edge and a line of strain gauges, placed at 21, 46, 71, 170 and 950 m along the line, are given in Figure 3.

Fig. 3. Sketch of the ice edge showing angle of the incident wind and sea, and the angle of line of strainmeters relative to the ice edge. floes are also sketched.
Profiles of salinity and temperature were taken close to the line of strainmeters, and brine fraction was calculated from the equations of Reference Frankenstein and GarnerFrankenstein and Garner (1967). These profiles are shown in Figure 4. Data from cores taken on 29 November and 1 December 1992 have been averaged. No crystal-orientation data are available. However, Reference Gow, Ackley, Govoni, Weeks and JeffriesGow and others (1998) measured c-axis orientations at sites close to the ice edge in October and November 1980. We can compare the known location of our wave experiment, 10.5 km west, and 6 km north of Cape Royds (global positioning system position 77°30.04’ S, 165°30.35’ E), with sites sampled by Gow and colleagues. This suggests that the c axes would have been aligned approximately perpendicular to the local ice edge.

Fig. 4. Profiles of (a) temperature, (b) salinity and (c) brine fraction. the profiles are from cores taken on 29 november and 1 december 1992 and averaged at each depth.
Clusters of cracks were observed running intermittently along lines approximately parallel to the ice edge, and at regular spacings from the edge. It was estimated that there was relative motion of 15 mm peak-to-peak displacement, and 4−5 s period, across these cracks. In addition, floes were noted just beyond the ice edge with dimensions in the range 24−50 m. Reference Crocker and WadhamsCrocker and Wadhams (1989) have previously described a series of 12 parallel cracks at approximately 30 m intervals running perpendicular to the direction of the incoming swell. It is possible that these cracks had not penetrated through the entire ice thickness.
Strain spectra show that most of the energy lies in the range 2−5 s (Reference Squire, Rottier, Fox, Zhouwen, Tang, Preller and HuidingSquire and others, 1994), while the fatigue model developed above was based on data with 8 s period. Measurements of the variation in loss tangent with frequency (Reference Cole, Ayorinde, Sinha and SodhiCole, 1990) suggest that we might expect the loss tangent at a period of 8 s to be 40% higher than that at 3 s in saline ice at −10°C. There is a simultaneous change in modulus (Reference Cole and DurellCole and Durell, 1995), although this is smaller (approximately 12%). While it is likely that these might indicate a small change in the expected lifetime over the range of periods described here, this is well within the scatter of individual lifetime measurements about the mean lifetime curve (see, e.g., Reference Langhorne, Haskell and ShenLanghorne and Haskell, 1999).
The maximum strain amplitude was observed on the gauge placed 71m along the line of strainmeters (Reference Squire, Rottier, Fox, Zhouwen, Tang, Preller and HuidingSquire and others, 1994). During the time the site was being studied, the incident waves came from the northeast, making a small acute angle with the normal to local direction of the ice edge from northwest to southeast. Indeed this angle must be small if waves of such short period are transmitted into the ice sheet as observed, for waves incident at >12° will be totally reflected as demonstrated in Figure 2. Figure 3 shows that the incident waves were approximately normal to the ice edge, but the strainmeters lay on a line at an angle of about 41 ° to the ice edge. Consequently, the perpendicular distance from the ice edge to the strainmeter undergoing maximum strains was 47 m. This is close to the penetration of approximately 30 m where the largest value of the principal strain is predicted (see Fig. 2). Figure 5 shows the distribution of strain amplitudes at this location, and the significant strain amplitude, calculated from Equation (5), is 2.3 × 10⁻⁶. This corresponds to a significant ice deflection, from crest to trough, of 1.2 mm. Since we know that the ice did not break out during the time that the 30 in strain record was recorded on 30 November, it is with relief that we find the sum in Equation (2) is of order 10-17, very much less than the critical value of 2. Under such conditions, the ice sheet will not disintegrate in a wave field.

Fig. 5. Distribution of strain amplitudes measured in the sea ice at 71 m along strainmeter line (see fig 3). the ice thickness is 1 m.
We now investigate the consequences of forcing the sea-ice sheet with a larger-amplitude wave field containing the same spectral content as that measured. Because the sea ice has a memory of the previous strains that it has endured, the sequence in which it is subjected to the variable wave amplitudes will influence the lifetime of the ice sheet. To examine the dependence of the lifetime on the order of the waves, we step through the time series beginning at progressively later times, and tagging the initial portion on the end. Provided linearity is assumed and provided the strain amplitude is increased by a factor of 10 (significant ice deflection, from crest to trough, of 12 mm; or significant strain amplitude of 2.3 × 10⁻⁵), Figure 6 shows one example of the distribution of sea-ice-sheet lifetimes so obtained. This lifetime distribution is determined not only by the distribution of wave amplitudes (Fig. 5), but also by the exact order in which the waves are incident on the sea-ice sheet. The example in Figure 6 is bimodal, but a number of other distribution types are encountered.
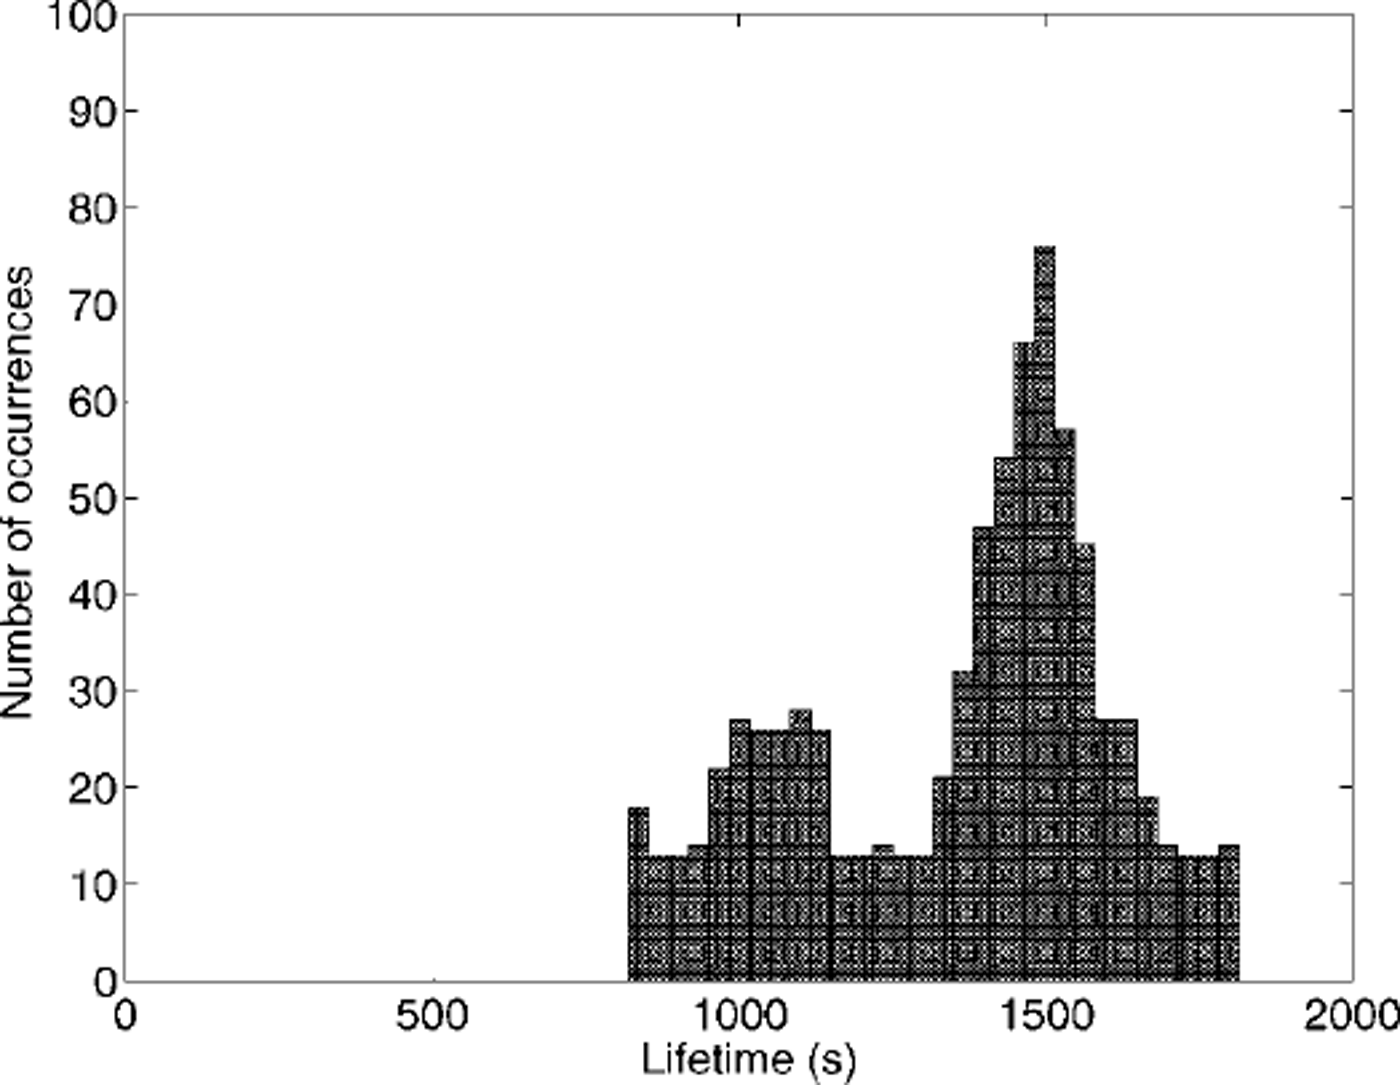
Fig. 6. Distribution of ice-sheet lifetimes as the start time of the recorded-strain time series is varied. ice-strain record at 71m has been used, and scaled by factor 10 to produce a significant ice deflection, from crest to trough, of 12mm, or a significant strain amplitude of 2.3×10⁻⁵. this corresponds to an open-water significant wave height of 0.15 m. the brine fraction averaged through the sea-ice sheet is 0.15, modulus is 3.2 Gpa and ice thickness is 1 m.
Discussion
For obvious reasons experiments that actually record data during a break-up event are notoriously difficult to perform, and unfortunately we have no such data with which to compare our model. However, we are able to calculate the open-water wave spectrum, and the spectrum of ice deflections, from the strain record in the sea ice. The ocean-wave field sampled over 30 min is assumed to be approximately stationary. It is meaningless to ask about lifetimes much longer than this because this assumption is unlikely to be justified. Further assuming that the system behaves linearly, Figure 7 shows the lifetimes of a lm thick sea-ice sheet as a function of wave height in the open oceanjust beyond the ice edge. As above, the lifetime is dependent on the damage, and so on the order of the waves. A range of lifetimes is possible at each wave height, and these extreme limits are shown by vertical bars. Our calculations are consistent with a report that waves of 0.1−0.2 m amplitude and "long period" caused a break-up event in February 1986 (Reference Crocker and WadhamsCrocker and Wadhams, 1989).
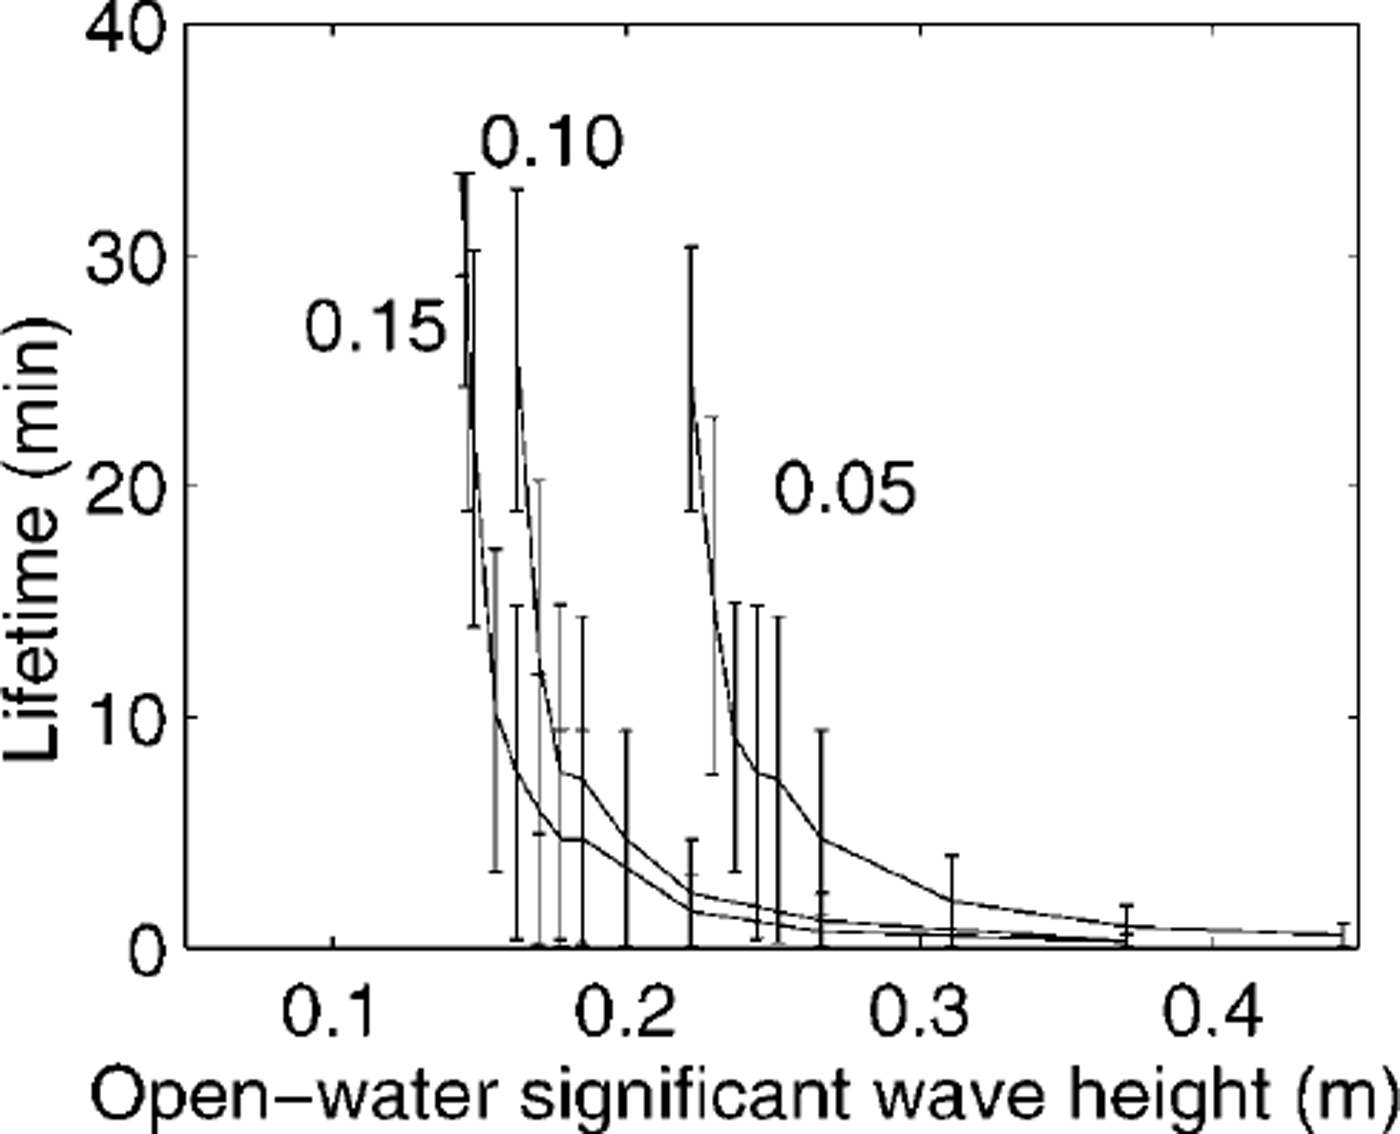
Fig. 7. Ice-sheet lifetime as a function of the significant wave height in the open water beyond the ice edge. calculations have been performed using a measured 30 min strain time series, and a 1 m thick ice sheet. vertical lines indicate the maximum and minimum lifetimes that defend upon the arbitrary starting-point of the time series. calculations for average brine fractions for the sea-ice sheet of 0.05, 0.10 and 0.15 are shown.
For a lm thick sea-ice sheet, the lifetime extremes predicted in terms of the maximum observed deflection (from crest to trough) in the ice are shown in Figure 8. Both Figures 7 and 8 are for a 1 m thick ice sheet. To obtain results for other ice thicknesses, the significant wave heights (or ice deflections) should be multiplied by (ice thickness)-1/2, where ice thickness is in meters.
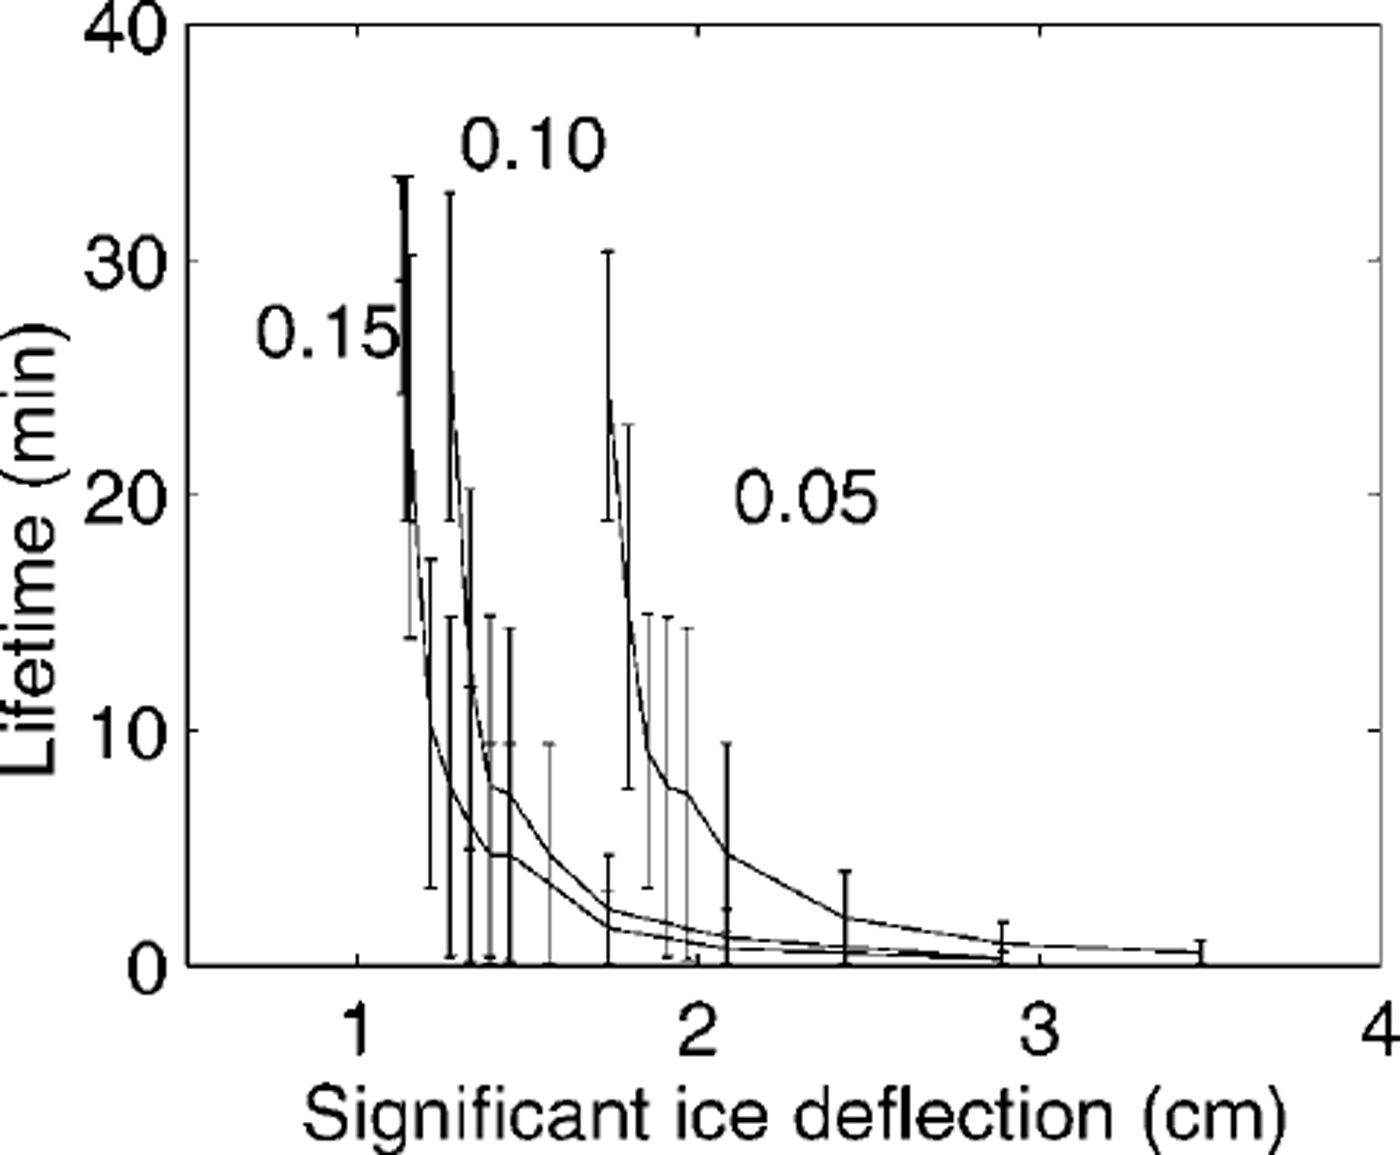
Fig. 8. Ice-sheet lifetime as a function of the significant deflection in the sea-ice sheet (crest to trough). calculations have been performed using a measured 30 min strain time series and aim thick sea-ice sheet. vertical lines indicate the maximum and minimum lifetimes that defend upon the arbitrary starting-point of the time series. calculations for average brine fractions for the sea-ice sheet of 0.05, 0.10 and 0.15 are shown.
Unfortunately, our calculations will probably be an upper limit on the wave heights that could safely exist beyond an ice edge. The presence of pre-existing cracks in the sea ice will tend to weaken the sea ice and cause failure at wave heights below the predicted levels. The alignment of c axes also has the potential to reduce the failure stresses. In the McMurdo Sound area the indications are that the c axes are approximately perpendicular to the ice edge (Reference Gow, Ackley, Govoni, Weeks and JeffriesGow and others, 1998), making the "easy-fail" directions parallel to the ice edge. However, it is unlikely that c-axis orientation alone will determine the pattern of floe sizes observed, as the length scales associated with this phenomenon are not similar to floe dimensions. However, because of the existence of the maximum in the strain at a predetermined penetration, there is a length scale associated with wave phenomena in sea ice, and this length scale is close in magnitude to the observed floe sizes.
Conclusions
We have described a simple scheme for the prediction of progressive damage, and the eventual break-up of a land-fast sea-ice sheet due to the action of ice-coupled waves of variable amplitude. The lifetime of the sheet is critically dependent on the order in which the waves are incident on the ice. The dimension of the floe size perpendicular to the ice edge is determined by the penetration at which there is a maximum in the strain, which is determined mainly by the ice thickness. Strains in the sea-ice sheet have been related to the open-water wave heights, allowing us to estimate "critical" wave heights for a given sea-ice thickness, brine fraction and wave period. Unfortunately our estimates are not conservative, as the influence of aligned c axes, or the presence of cracks in the sea ice will act to reduce the stress amplitudes required for break-up. When the sea is not normally incident upon the ice edge, it appears that there are two possibilities. For acute angles to the normal the strain maximum, and eventual floe size, is changed by a small amount compared with the normal case, while for larger angles the strain maxima exist at the ice edge.
Acknowledgements
The authors are grateful for the financial assistance of the Public Good Science Fund, Lottery Science, Universities of Otago and Auckland, Industrial Research Ltd and the Marsden Fund. Antarctica New Zealand provided invaluable assistance with scientific planning and logistics. We are grateful for the comments of the referees which improved the manuscript.


