


Nomenclature
- ACC
-
area control center
- AIRAC
-
aeronautical information regulation and control
- BADA
-
base of aircraft data
- ECAC
-
European Civil Aviation Conference
- EEFRA
-
East Europe free route airspace
- Eurocontrol
-
European Organisation for the Safety of Air Navigation
- FAB
-
functional airspace blocks
- FAB CE
-
functional airspace block of Central Europe
- FIR
-
flight information region
- FRA
-
free route airspace
- FRATURK
-
free route airspace of Türkiye
- HUFRA
-
Hungarian free route airspace
- NEFRA
-
North European Free Route Airspace
- NEST
-
network strategic tool
- RTS
-
real-time simulation
- SECSI FRA
-
South East Common Sky Initiative free route airspace
- SEEFRA
-
South East Europe free route airspace
- SESAR
-
Single European Sky ATM (air traffic mamagement) Research
1.0 Introduction
Despite occasional interruptions due to various global crises, the worldwide air transportation demand has been growing rapidly. The number of flights in the European Civil Aviation Conference (ECAC) region broke its record to date with 11.1 million flights in 2019. Although the negative effects of the Covid-19 outbreak that occurred in 2020 showed a recovery of 87 at the middle of 2023, the 2019 traffic numbers have still not been fully reached [1]. In the projection studies carried out after the outbreak, it is predicted that the number of flights in the ECAC region will reach 19.6 million in the best scenario and 16 million in the most likely scenario in 2050 [2]. These increases in demand pose significant problems to the sector that need to be solved in areas such as capacity, delays and increased environmental sensitivity. In this regard, the aviation industry is utilising emerging technologies to find solution to these issues on the ground and in the air. These pursuits continue in the field of navigation, and various concepts and technologies are being put into practice. In the field of navigation, many issues such as airspace capacity, delays, regulations, carbon footprint, fuel costs and navigation safety are on the agenda. The Single European Sky ATM (air traffic managments) Research (SESAR) programme, launched by the European Parliament and Council in March 2004 [3], aims to provide solutions to the problems in these areas. One of SESAR’s solution suggestions for navigation is the free route airspace (FRA) implementation. This practice can be explained by the fact that aircraft freely use their airspace, without depending on established routes [4]. Beyond the FRA implementation comes the cross-border FRA concept, which means that between two different airspaces, users can cross to the other without using mandatory border entry-exit points [Reference Todorov5]. This concept is an important attempt to create a more effective single airspace by combining the airspaces of different countries. The objective is to cross borders without using border points, as if they were one FRA region in a vast airspace. The crossborder FRA application gives the airspace responsibility limits of the countries a more flexible structure, resulting in the flight’s shortest and most cost-effective route.
For this reason, the airspaces in Europe – primarily small-sized ones – are combined and crossborder FRA is being implemented, especially functional airspace blocks (FAB). However, this application will not be limited to small-sized airspaces, but will be applied to larger countries. In this case, how flights and the flow of traffic over these airspaces will be affected is also open to research. In this study, the effect of cross-border FRA implementation for Turkish flight information regions (FIRs) and surrounding FIRs on these regions and flights using these regions will be examined.
2.0 Problem description and literature
2.1 Problem description
The entire European upper airspace is in transition to free route operations as part of the Single European Sky project, and a significant portion of this space will be integrated with the cross-border FRA application. In the planning for 2029, it is expected to complete the transition to 24/7 FRA operations within all green zones shown in Fig. 1 and to ensure that the regions within the red borders are ready for cross-border FRA operations. This transition will take place gradually by combining the airspace of the countries. The impact of this implementation on flights will be investigated in various instances when Turkish airspace participates in the cross-border FRA implementation in this study by providing a distinct viewpoint to this planning till 2029. It is seen that Ukrainian airspace is in cross-border planning within the scope of SES (Fig. 1) [6]. However, the closure of this large airspace due to the invasion in Ukraine has affected the flow of traffic within the region. Flights planned to pass through Ukrainian airspace have shifted to surrounding countries. For instance, flights through Georgia increased by 80%, Türkiye 14%, Bulgaria 15%, Hungary 30%; on the contrary it decreased in Ukraine by 98%, Moldova 99%, Poland 38%. The impact of the return of these flights to Ukraine is another issue that this study will address [7].
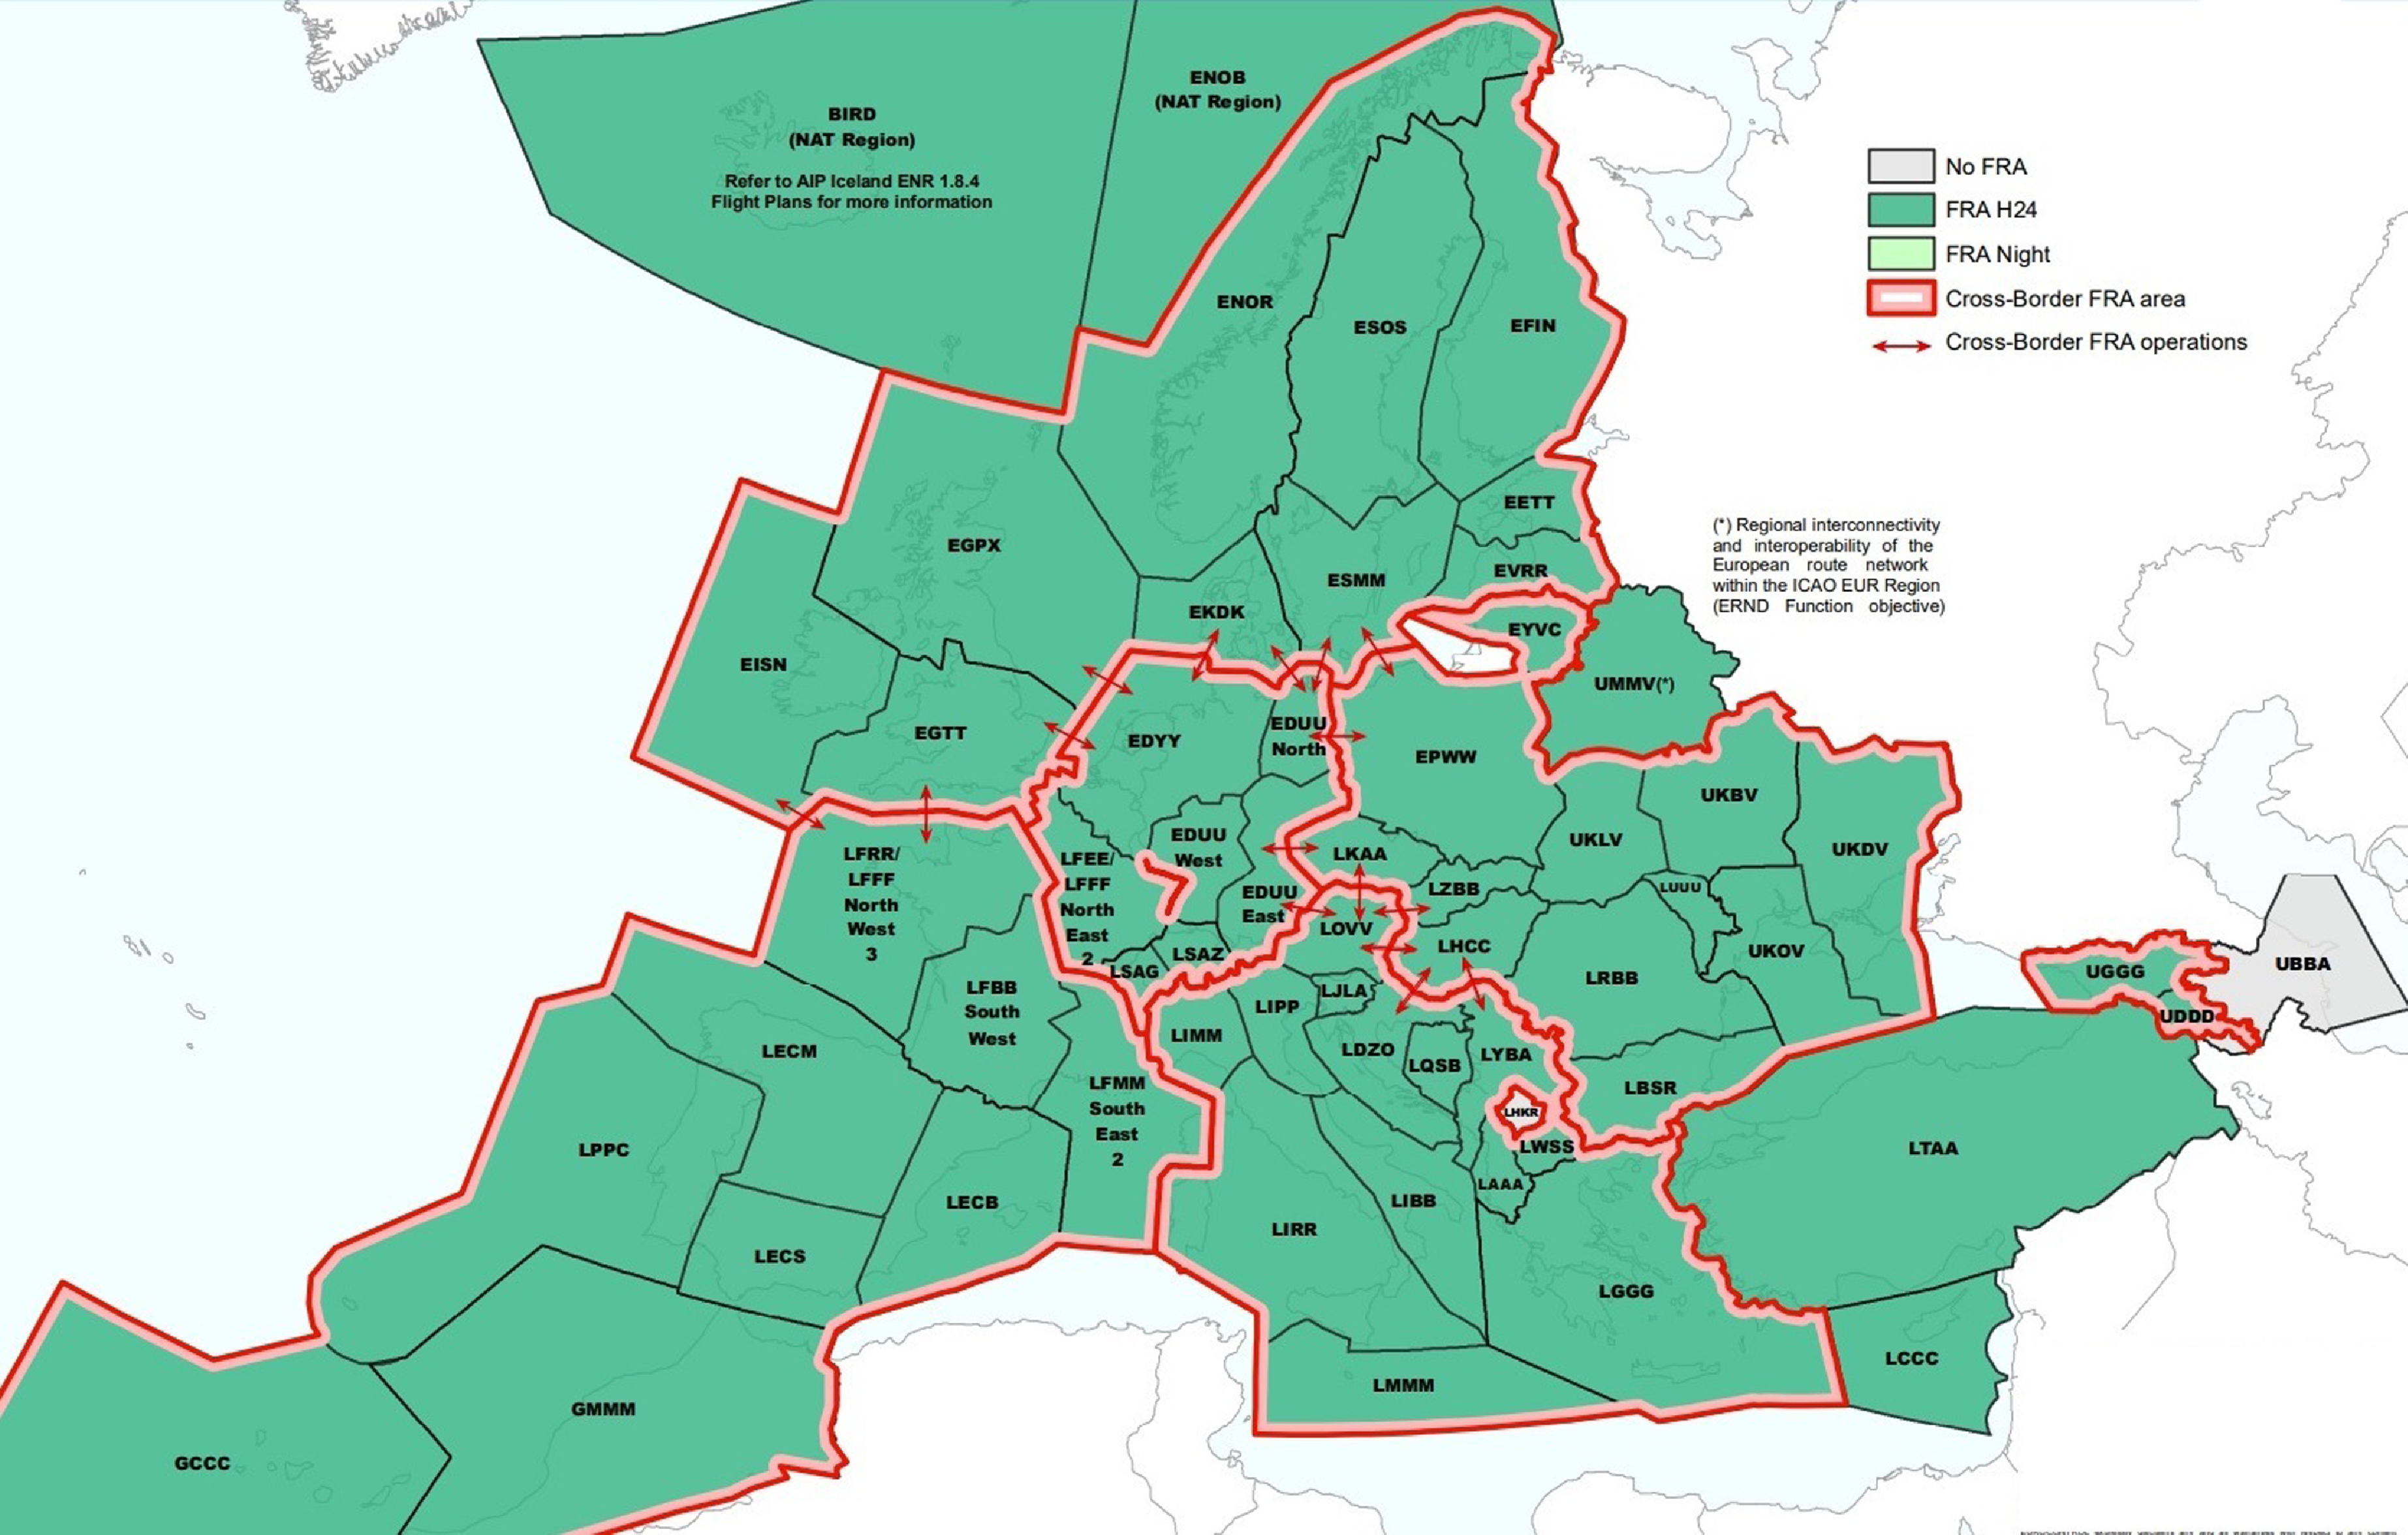
Figure 1. FRA implementation planning in Europe by the end of 2029 [6].
Within the scope of the study, before and after the implementation of cross-border and FRA, the savings in terms of flight distance and time values will be calculated using the fast-time simulation software. It is known that increasing fuel consumption causes an increase in emissions as well as economic damage. Approximately 70 of aviation-related emissions that occur as a result of combustion and post-combustion reactions in aircraft engines and which adversely affect the atmosphere and human health, is CO2 (carbon dioxide), approximately 30 of them is H2O (water vapor) and less than 1% is NOx (nitrogen oxide derivatives) [Reference Aksoy8]. Therefore, estimating and comparing CO2 and NOx (toxic gases) emissions with environmental impact is another aim of the study. In addition, visual analysis of traffic flow distribution and segment density will be made in cross-border regions and Turkiye-expanded SEEFRA (will be called EEFRA) border and complexity score of these regions will be evaluated.
2.2 Literature review
In the literature review, it is seen that academic studies were carried out on many subjects from optimal route formulation to methods for the solution of conflict problems, from the gains obtained with FRA to the effects on air traffic controllers. In this study, the reviews of the academic studies conducted to date are sorted by starting from the general of FRA investigations to the assessment of the cross-border FRA application with fast-time simulators, which is the concept of this paper.
In their study, Çeçen and Çetek presented a mathematical model of a two-stage method of conflict resolution and fuel consumption in the FRA application area. In the first stage, the sector introduced a model that would allow the aircraft to be directed there by adding alternative entry points of the existing entry points, and in the second stage, they modelled a vector technique that would minimise fuel consumption. It was concluded that the proposed model saved ATC time and increased airspace capacity by reducing delays [Reference Cecen and Cetek9]. Another study on route optimisation was done by Aydoğan. In the study, optimal route studies aiming to minimise flight costs in airspaces with mixed structure were carried out. Non-conflict routes and delay times have been determined to provide the route structure in the fixed-route airspace, the capacity of the airways, the separation minimums. As a result of the analysis, a mathematical model on the mixed airspace consisting of free and fixed route airspaces resulted in a shortening of route lengths of 4.13% and a reduction in fuel consumption of 3.95%. With the simulated annealing algorithm for the same airspace, a shortening of 3.11% in route lengths and a 3.03% reduction in fuel consumption are achieved. The study conducted in a generic airspace emphasised that in real life there are different airspace structures that are not homogeneous between countries and that optimisation studies that take these differences into account are necessary [Reference Aydoğan10, Reference Özcan11].
In previous two studies generic concept of FRA analysed. In their study, Majka and Pasich investigated how much distance would be shortened if cross-border FRA was applied instead of FRA by using the horizontal flight efficiency method in a certain city pair. The calculations were made using the x-Plane 11 software. In the study, the route of the flight between Warsaw Frederic Chopin and Malta International (EPWA-LMML) is evaluated to apply FRA and then cross-border FRA. In the evaluation, values such as flight distance, flight time, fuel consumption, CO2 emission are calculated and expanded to 1,500 flights per year using the same route. As a result, it is seen that 26km of average route, 2min of time and 85kg of fuel are saved, and 263kg less CO2 emission is released. It is added that the working method could be improved by using variables such as wind, weather conditions and airspace usage fees [Reference Majka and Pasich12].
In one of the studies examining the effects of FRA application on certain airspaces in Europe, Renner et al. examined the effects of Hungarian Free Route Airspace (HUFRA) application on Hungarian airspace. In Europe, FRA was first applied without a time restriction in Hungarian airspace in 2015. In the study where three years of experience were summarised, it was emphasised that HUFRA was implemented smoothly in Hungary. The developments during this period were examined under the headings of safety, traffic increase and human factor. The study also provided information about the real-time simulation (RTS) for the Functional. Airspace Block Central Europe (FABCE) cross-border FRA in Hungaro Control. As a result of the simulation, it was proposed to perform the cross-border application step by step in FABCE. As a conclusion of the study, it was emphasised that the necessity of FRA application, which was carried out smoothly in HUFRA, should be developed within large FABs and foresight studies on this issue [Reference Renner, Rohács, Papp and Kling13].
In the study examining the effect of FRA implementation on complexity, conducted by Dora Kumunija et al., 2016 traffic sample in Croatia before FRA implementation and 2019 traffic sample after implementation were subjected to fast-time simulation and the results were compared. In addition, the result of the traffic sample of 2016 was examined on 2019’s FRA route network. As a result, although traffic for 2019 increased by 29%, the complexity value increased by 21% compared to 2016. However, as a result of the simulation made on the traffic sample of 2016, it was seen that the same traffic sample caused 23% less complexity in 2019’s FRA route network [Reference Kudumija, Antulov-Fantulin, Andraši and Rogošić14].
A study of Northern Europe free route airspace (NEFRA), one of the largest cross-border FRA sites in Europe, conducted by EUROCONTROL employees Pejovic, Lazarovski and Pavlovic. Safety-related events and risks after the implementation of NEFRA are analysed. In these analyses, the outputs obtained from the calculations made with the Conflict tool of network strategic tool (NEST) are used. NEST used the 28-day aeronautical information regulation and control (AIRAC) data of July months of 4 years (from 2015 to 2018) before and after the implementation. According to these analyses, the number of separation losses decreased by 35% despite the number of flights increasing by 13% after FRA [Reference Pejovic, Lazarovski and Pavlovic15].
Antulov-Fantulin et al. conducted a study involving the South-East Axis free route airspace (SEAFRA; Croatia, Bosnia and Herzegovina, Serbia and Montenegro). In this study, the effects of cross-border FRA application on air traffic controllers (ATCs) were examined by taking opinions through a questionnaire. In the study, evaluations of 34 ATC participants from Zagreb ACC are used. Experienced en-route air traffic controllers who participated in the study claimed that the workload increased by 70%. The reason for this is stated as the uncertainty of the flight routes leads to a more complex airspace and therefore the situational awareness decreases. Particularly with the cross-border implementation, the uncertainty of the flight routes and the corresponding conflict points cause the determination of the conflict to become difficult. This leads to the view that the workload on air traffic controllers has increased by 70%. In addition, it is concluded that 50% of the conflict detection was of high difficulty and the solution was of medium difficulty. In other words, the element that challenges air traffic controllers is not conflict resolution but conflict detection, so it is stated on the radar screen that the development and expansion of the use of new tools that can help air traffic controllers will facilitate the work of the controllers [Reference Antulov-Fantulin, Rogosic, Juricic and Andrasi16].
In another study conducted by Barać in 2019, the application of cross-border FRA to the new airspace that will be formed by the addition of Macedonia, Albania and Kosovo to the South East Common Sky Initiative free route airspace (SECSI FRA) was simulated by the NEST software. Before proceeding to the analysis of these simulations, the airspace structures of both the SECSI FRA region countries and the three countries in question are examined in detail. After the explanation of the model established in the fast-time simulation software, result analyses are made. The results of the analysis are presented with the change in the number of entries/exits to/from the countries and the outputs of the scenario economy obtained in total. In total, 1,893NM, 293min, 12,777kg of fuel is saved per day and 40 tonnes of CO2 emission is reduced [Reference Petrović17].
In his 2019 study, Šutej made a prediction study of the FRA application (SEE FRA) on a 24-hour basis with the help of the NEST software of the data of SEE(N)FRA (SOUTH-EAST European Night FRA) in which Bulgaria, Romania and Hungary participated via AIRAC dated 2 September 2017. As a result of the simulations made on a single case, the number and change of flights for each country, the most affected route segment and the number and change of aircraft flying on it, the flights that saved the most are presented by supporting the visuals. In addition, the comparison tables obtained using the Scenario Economy tool are analysed for the case [Reference Pejovic, Crnogorac and Netjasov18].
3.0 Simulations
The methods often used in large-scale airspace modelling are mathematical methods or fast-time simulation models. In large airspaces, the use of fast-time simulation models customised for aviation is preferred because it is more convenient in terms of computer and model capacity in studies over a time frame of more than one hour. In this study, EUROCONTROL’s NEST fast-time simulation software is used. The airspaces for different scenarios were created in line with the purpose of the study were structured on this software and the route network was defined in accordance with the free route airspace operations.
When designing a route network in the FRA concept, perhaps the most important structural elements are the assigned points. In the FRA concept, the points used in the airspace are divided into five according to their characteristics. These features are stated below:
-
I: These are intermediate points. These points can be any point within the FRA boundaries. These can be used by aircratfs optionally or they can be assigned as mandatory points in order to manage the flow.
-
E: These are entry points. These points are used to enter the free route airspace.
-
X: Exit points. These points are used to exit from the free route airspace.
-
A: These are arrival connection points. These points are defined related with the relevant airport and are the points where aircrafts arriving at that airport with a free route will exit from the free route. After these points, an aircraft either connect directly to an ATS route or a STAR and then approach the relevant airport.
-
D: These are departure connection points. These points, just like the arrival connections, are defined with the relevant airport and are the points where they will enter the free route after departing from that airport. Until reaching these points, aircraft fly either via a standart instrument departure route (SID) or an air traffic service (ATS) route for a while and then enter the free route airspace from these points [4].
Points meeting these definitions may fit more than one characteristic. That is, a point can be both a departure connection point and an exit point at the same time, or an arrival connection point can be a departure connection point and an intermediate at the same time.
To create simulation models, the relevant entry (E)-exit (X) points, intermediate (I) points, departure (D)-arrival (A) connection points assignments were made. After the airspace models were created, simulations were performed and analysed by comparing them with the help of tables created with both the outputs provided by the software and the exported data. In addition, route segment loads are visually evaluated. These visual evaluations are made separately to see the effects on both cross-border airspace and its borders with Turkish airspace.
3.1 Modelling
The method created for the purpose of this study should allow the processing of a high number of flight data considering both the size of the airspace and the volume of the number of flights. The fast-time simulation software chosen is NEST, developed by EUROCONTROL. NEST can be used locally at the level of area control centers (ACC) or airports, as well as globally for strategic planning. NEST can process large amounts of data spread over several years, allowing the user to drill down and analyse and observe even 1min of data [19]. The main workflow is similar to most modelling tools, with users creating a scenario and then running analysis routines to create a series of summary indicators or metrics. While doing an analysis NEST has some tools like the Scenario Economy tool which is an analysis tool of NEST that compares two simulated scenarios. The Scenario Economy tool considers only the flights that are affected from the differences of two scenarios in comparison (3,629 common flights in this study).
The metrics on the outputs of the Scenario Economy vehicle include flight length, time, fuel, CO2 and NOx data. NEST can obtain consumption data through Base of Aircraft Data (BADA). Length refers to the difference in Network Manager (NM) of the total distance travelled between the two compared traffic samples. Similarly, time specifies the time between two samples in minutes. Fuel refers to the difference in fuel consumed between the two samples in kg. Metrics showing the difference in CO2 and NOx emissions in kg are also among the outputs. These data will be given as total difference in tabular form. The data in the tables are the differences of the 3,629 common flights known to be simulated (affected by FRA/cross-border FRA) out of 7,935 flights. These flights will be called ‘3,629 common simulated flights’. However, to obtain more realistic results, in some calculations this data will be proportioned to the ‘common 7,935 flights’ which use the airspace. ‘Common’ refers the flights that exist in all four cases. In this study, in addition to the outputs of the Scenario Economy tool, visual outputs by the NEST software will also be evaluated.
3.2 Scenarios and traffic demand
The study includes simulations for a total of five scenarios, including the ‘baseline scenario’. Baseline scenario is required to compare the airspace and network models of other four different cases. In this study each and every scenario is compared with baseline scenario. It has a reference model which has the route networks and border operations that currently implemented by countries while the other four scenarios have different combinations of route network and border operations. Different combinations are evaluated taking into account the variables of whether Ukrainian airspace is closed or open, whether Turkish airspace is included in the cross-border operations. While doing this, EUROCONTROL’s FRA implementation plan was adopted as the framework. By the end of 2022, the region called SEEFRA has been renamed EEFRA (Eastern Europe FRA) in this study to ensure that it will be greatly expanded in the 2029 plan and that there will be no conceptual complexity. EEFRA represents the implementation of cross-border in a huge airspace covering Bulgaria, Romania, Moldova, Hungary, Slovakia, Czechia, Poland, Lithuania and, if open, Ukraine (Fig. 1). Ukrainian airspace shall be considered closed except in cases where a cross-border is activated with this zone. Four cases are simulated to apply FRA/cross-border FRA above FL 285 aforementioned airspaces. The simulations were run with flight plans for 7 July 2022. This date is chosen because it is one of the days with the highest traffic demand in the summer months. The scenarios created in the study are as follows (Fig. 2):
-
Baseline: Although it will not be evaluated in this study, it is a base (reference) scenario created in the NEST fast-time simulation software so that the remaining scenarios can be compared with baseline scenario and the analysis tools of software can work effectively and we can understand what improvements or worsenings will happen compering to the current situation. By the end of 2022, the current route network structure of the aforementioned airspaces is simulated as baseline scenario and the data is referenced for comparison.
-
First case: Turkish FRA + EEFRA (Ukrainian airspace closed): At the end of 2023, FRA implementation (FRATURK) is planned to start in Turkish airspace. In this scenario, the crossings between EEFRA airspace and the FRATURK airspace are carried out through mandatory boundary crossing points (Fig. 5). Ukrainian airspace is not yet open in 2023, and uncertainty remains in this regard.
-
Second case: Turkish FRA- EEFRA: (cross-border implementation) (Ukrainian airspace closed): As in the first case, Ukrainian airspace is closed. In this case, the passages between Turkish airspace and EEFRA airspace take place without flying over the mandatory boundary points due to the cross-border operations.
-
Third case: Ukrainian- EEFRA (cross-border implementation) + Turkish FRA: In this case, Ukraine airspace will implement a cross-border with EEFRA. Ukrainian airspace is considered open. In Turkish airspace, FRA application continues. This scenario includes the possible plan for the SES project FRA/cross-border FRA projection, which is planned to be deployed by the end of 2029.
-
Fourth case: Ukrainian- EEFRA- Turkish FRA (cross-border Implementation): It is the scenario created to measure the contribution of cross-border implementation between Turkish airspace, Ukrainian airspace and EEFRA – which is one of the objectives of the study. Crossings between Ukrainian airspace, EEFRA airspace and Turkish airspace do not take place at mandatory boundary points in accordance with the cross-border FRA application.
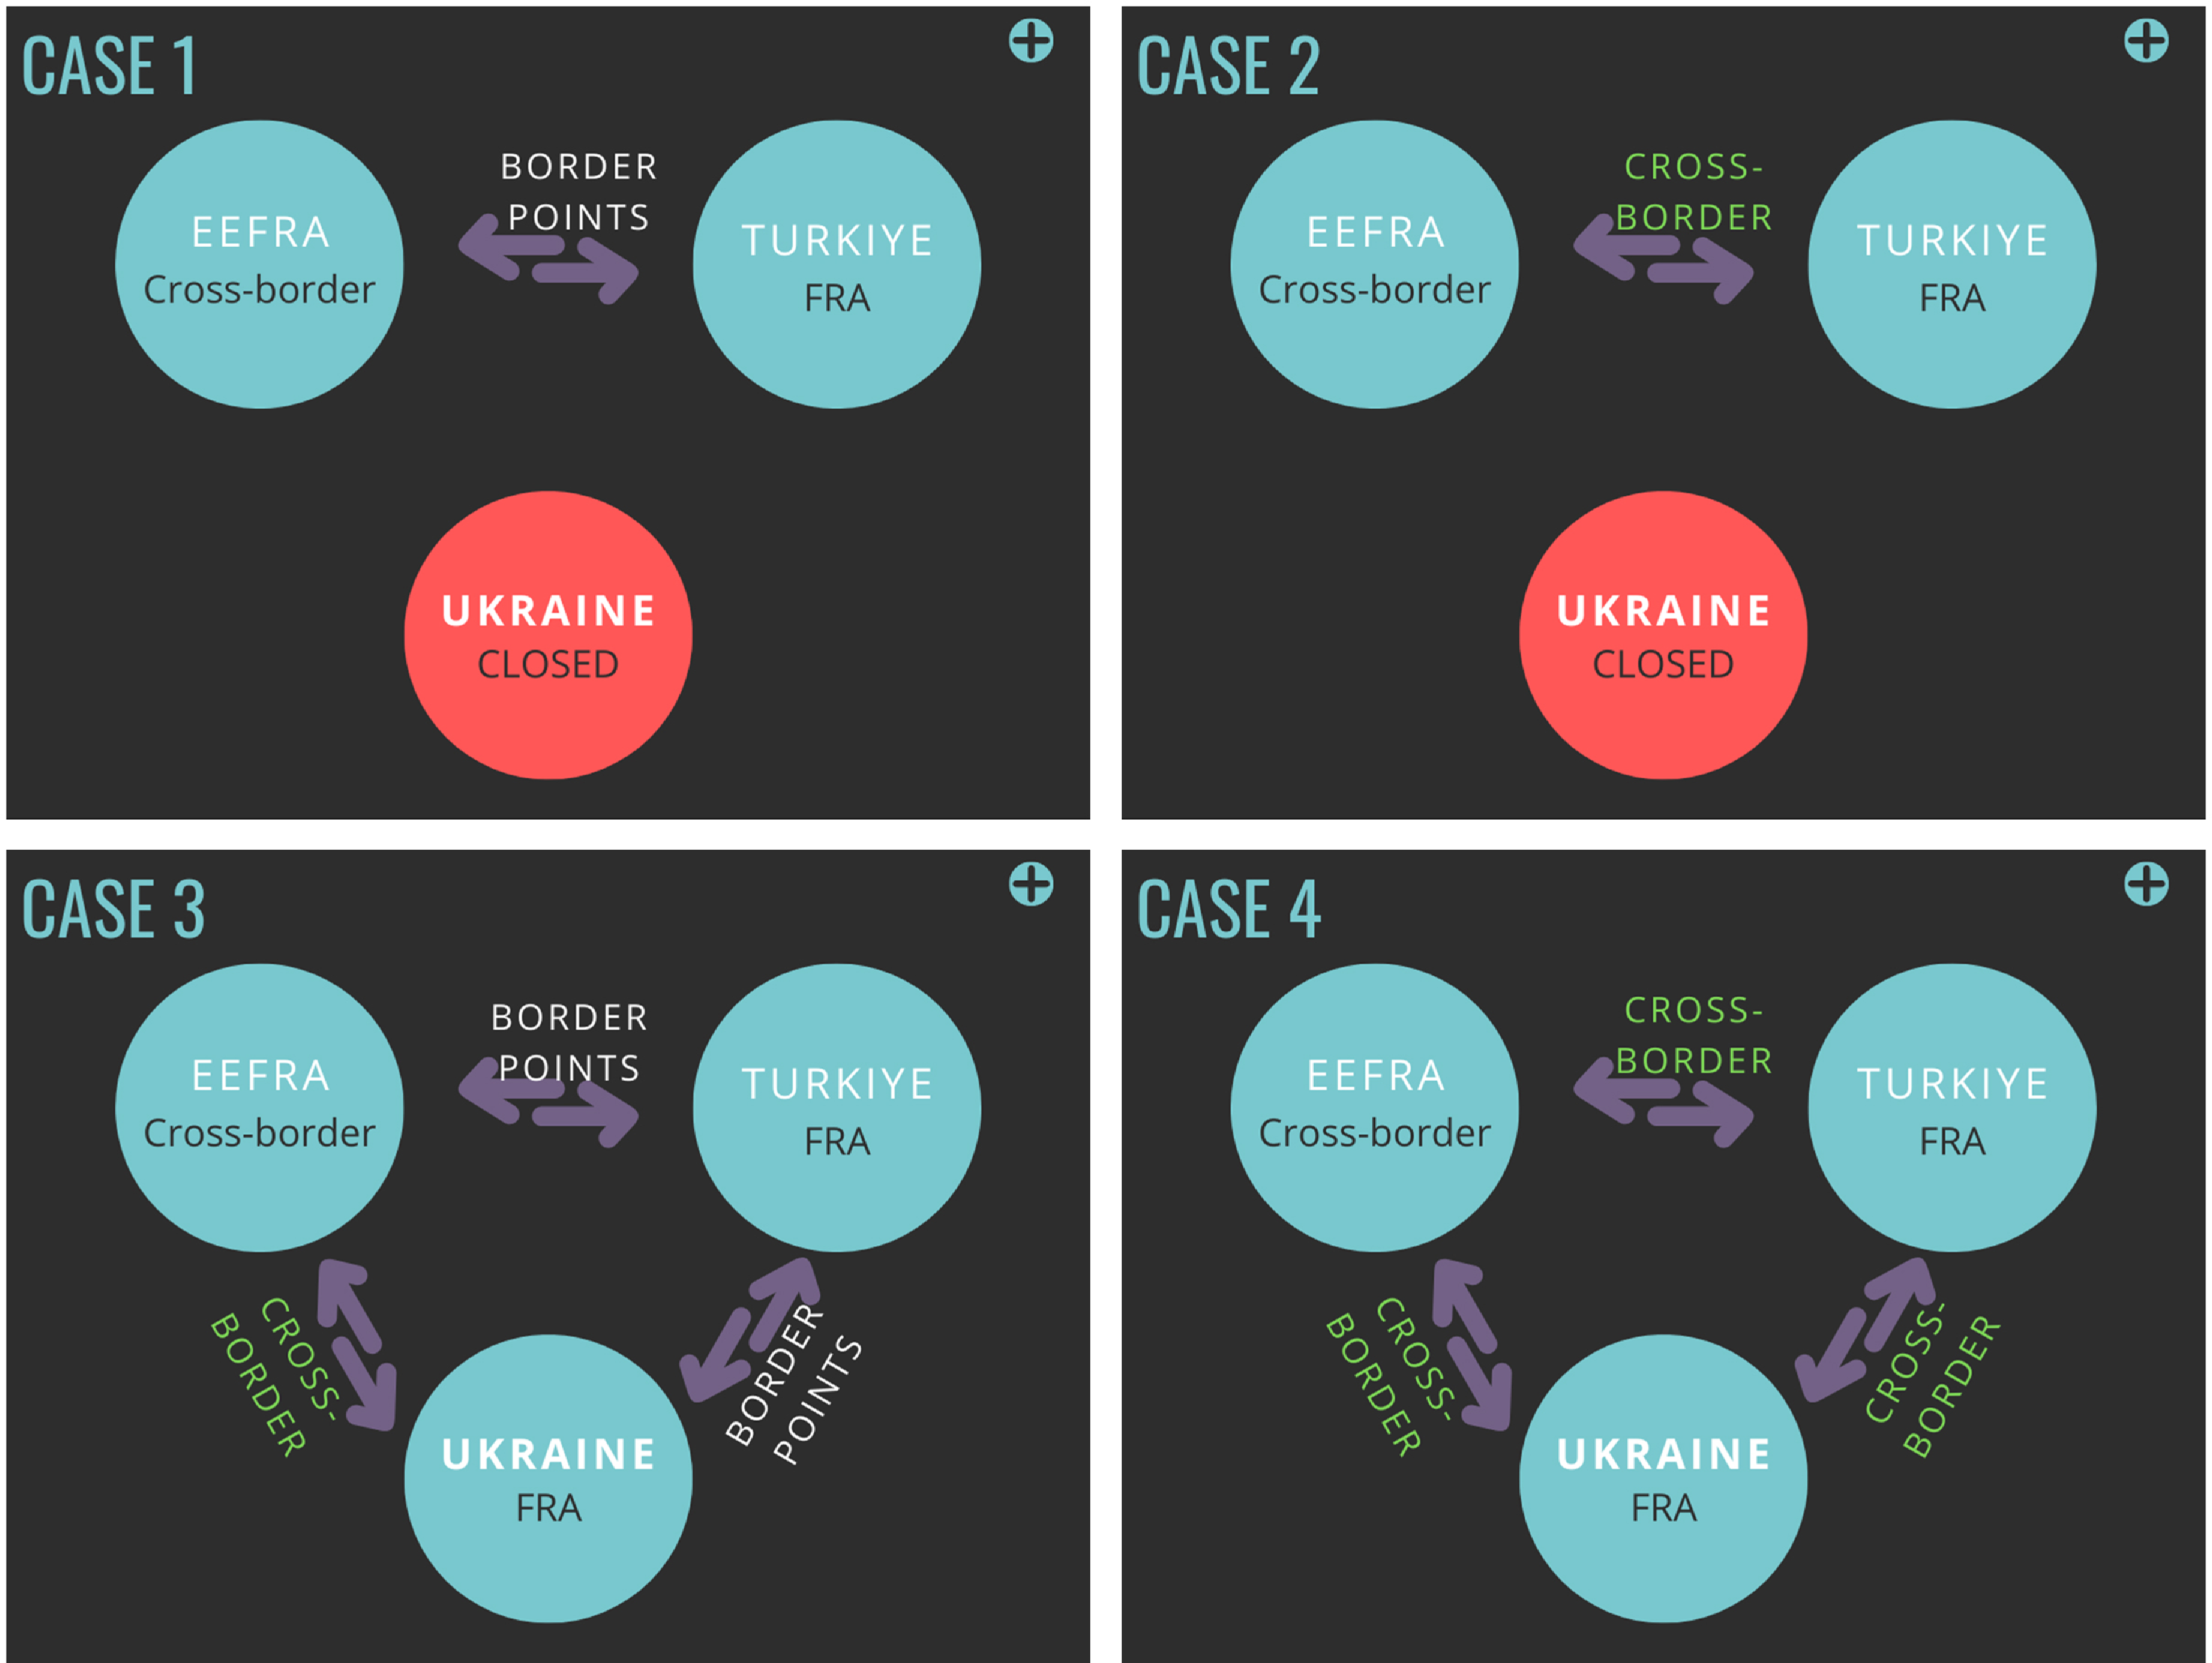
Figure 2. Simple explanation of four cases.
4.0 Results
After Portugal and Ireland, which were implemented for the first time in 2009, the next step of the FRA operation, which is gradually becoming widespread in all ECAC member countries, is the cross-border FRA operations [Reference Todorov5, Reference Pavlova and Zadorozhnia20]. With this concept, it is foreseen that flights in a generic airspace, only for that airspace, will save up to 5% of flight distance and fuel consumption [Reference Aydoğan10]. Of course, this will vary according to the size of the airspace. The gains in the total length of the flights are much lower than these values. In the study, an improvement of 1.7- 2% (1.7-2 per thousand) has been seen in Case 1 and 2, where Ukrainian airspace is closed, whilst this value jumped to around 5.4% with the opening of Ukrainian airspace. Case 2 and 4 are created to see the impact of the cross-border implementation of Turkish airspace. If a comparison is made Case 1 with 2 or Case 3 with 4, the contribution of the implementation of cross-border with Turkish airspace is easily seen. This difference in comparison is 0.3% (i.e. 3 in 10 thousand) and 0.15%, respectively. This is an indication of the impact of the implementation of cross-border with Turkish airspace under the same conditions. Case 4, where both the opening of Ukrainian airspace and the implementation of cross-border with Turkish airspace took place, is the case with the highest savings (Fig. 3). Case 4 has improved by a total of 59,440NM, route length savings are 0.55% for common 7,935 flights using the region and 1.12% for 3,629 common flights simulated. Although all of the improvements came from 3,629 flights, the ratio of these improvements to all aircraft flying in the region (7,935 flights) is important to demonstrate the effectiveness of change of route network and operations. Details of 3629 flights are also examined.
Table 1. Distribution of flight numbers to length improvement percentiles for 3,629 common simulated flights
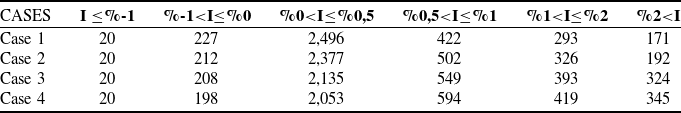
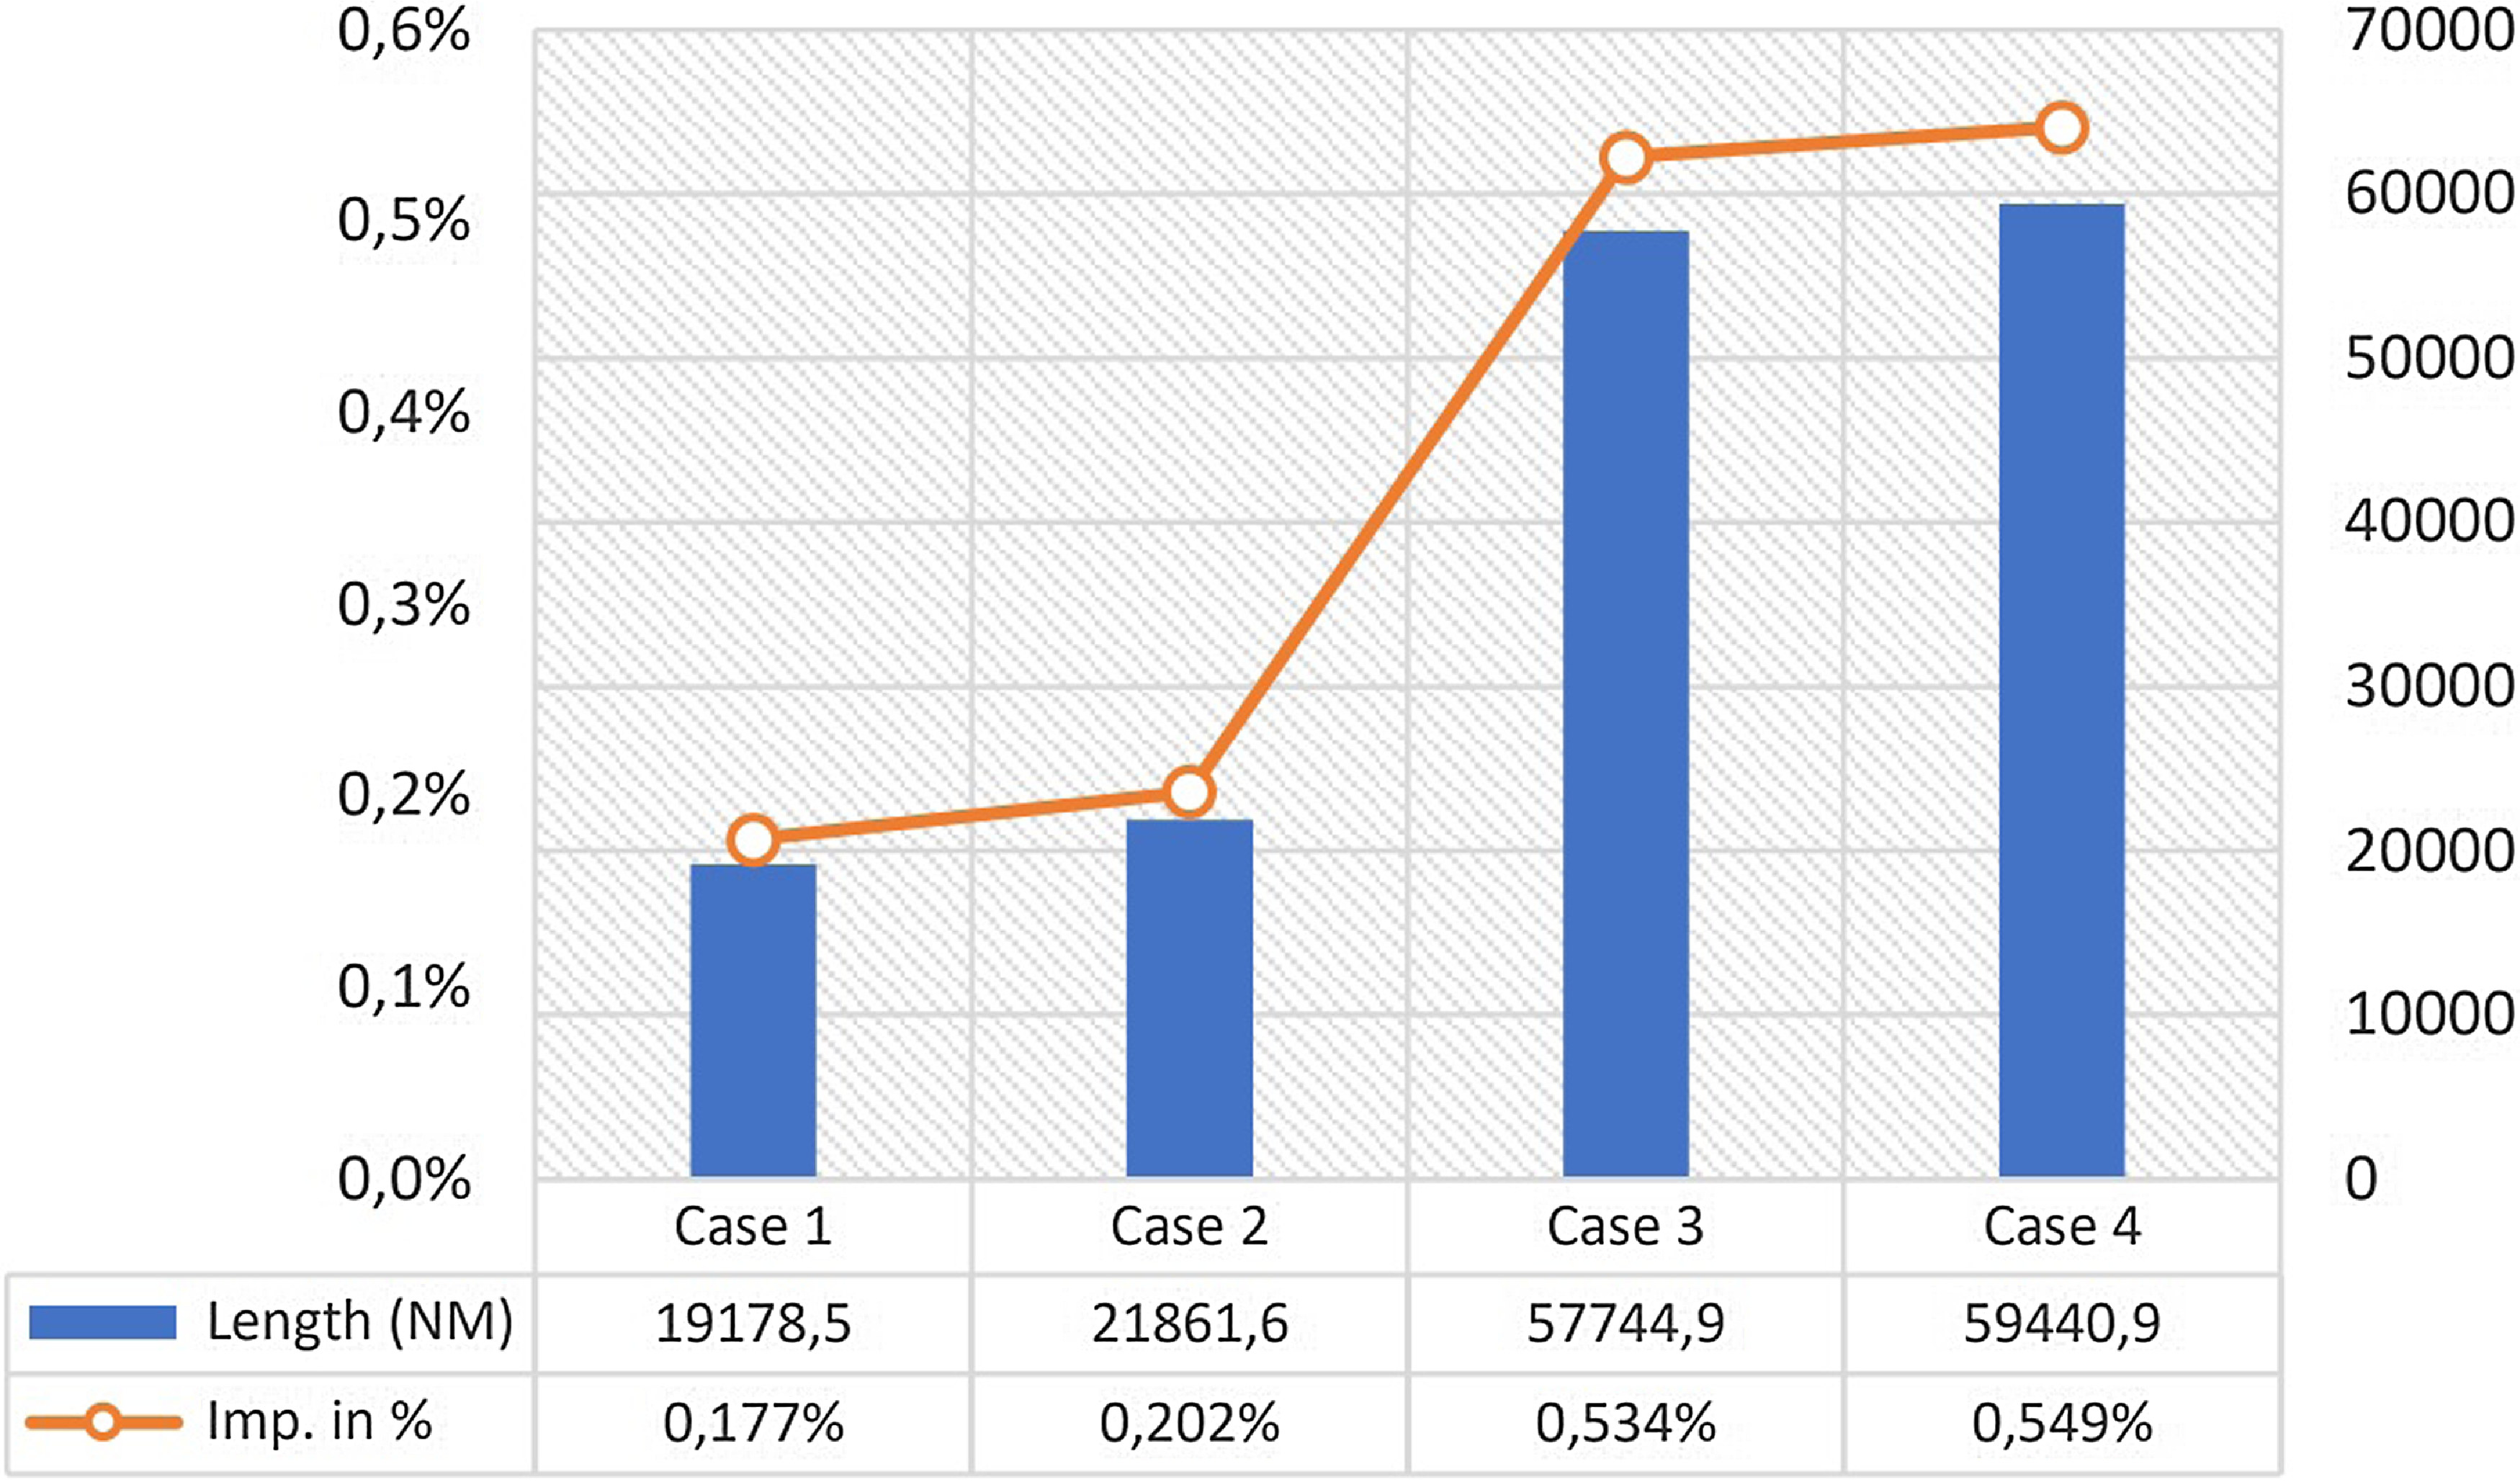
Figure 3. Total improvement in flight length and percentage improvement of common 7,935 flights using the region.
In Table 1/Fig. 4, the number of flights affected from the FRA/cross-border FRA (3,629 flights) is classified according to the percentage of improvement in the cases. These 3,629 flights are part of 7,935 flights using the region, so the rest of the flights (4,306 flights) are not affected from the implementation of FRA operations. So we can consider them as zero and add to second column of the table to reach 7,935 flights’ results. The variable shown by the letter I in the table represents the improvement in percentage. According to this table, the improvements shifted to the right in each case, that is, higher in percentage terms. As an exception, 20 fixed flights that extend the route by more than 1%. The number of flights that improved by more than 0.5% increased with each case, respectively.
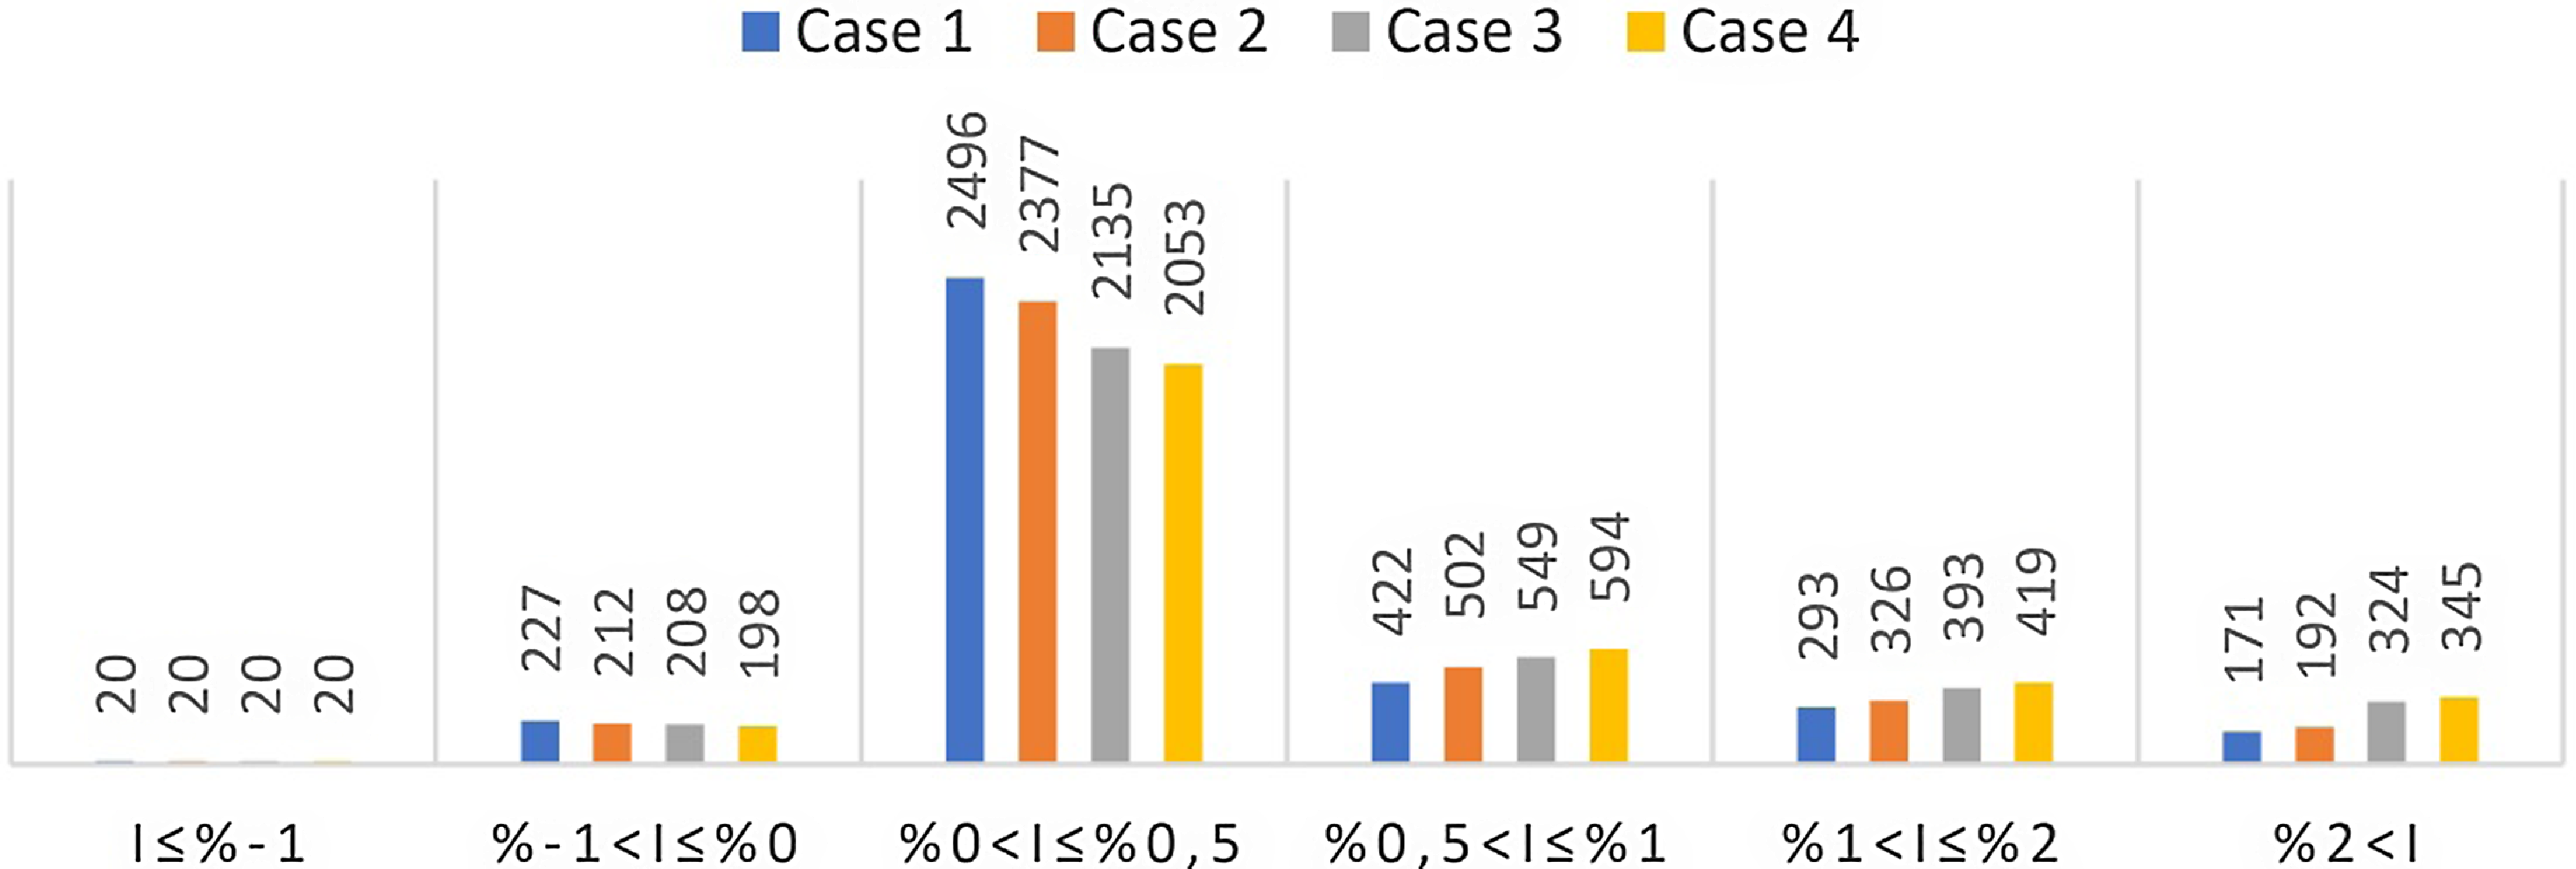
Figure 4. Distribution of flights into percentiles in term of distance improvement for 3,629 common simulated flights.
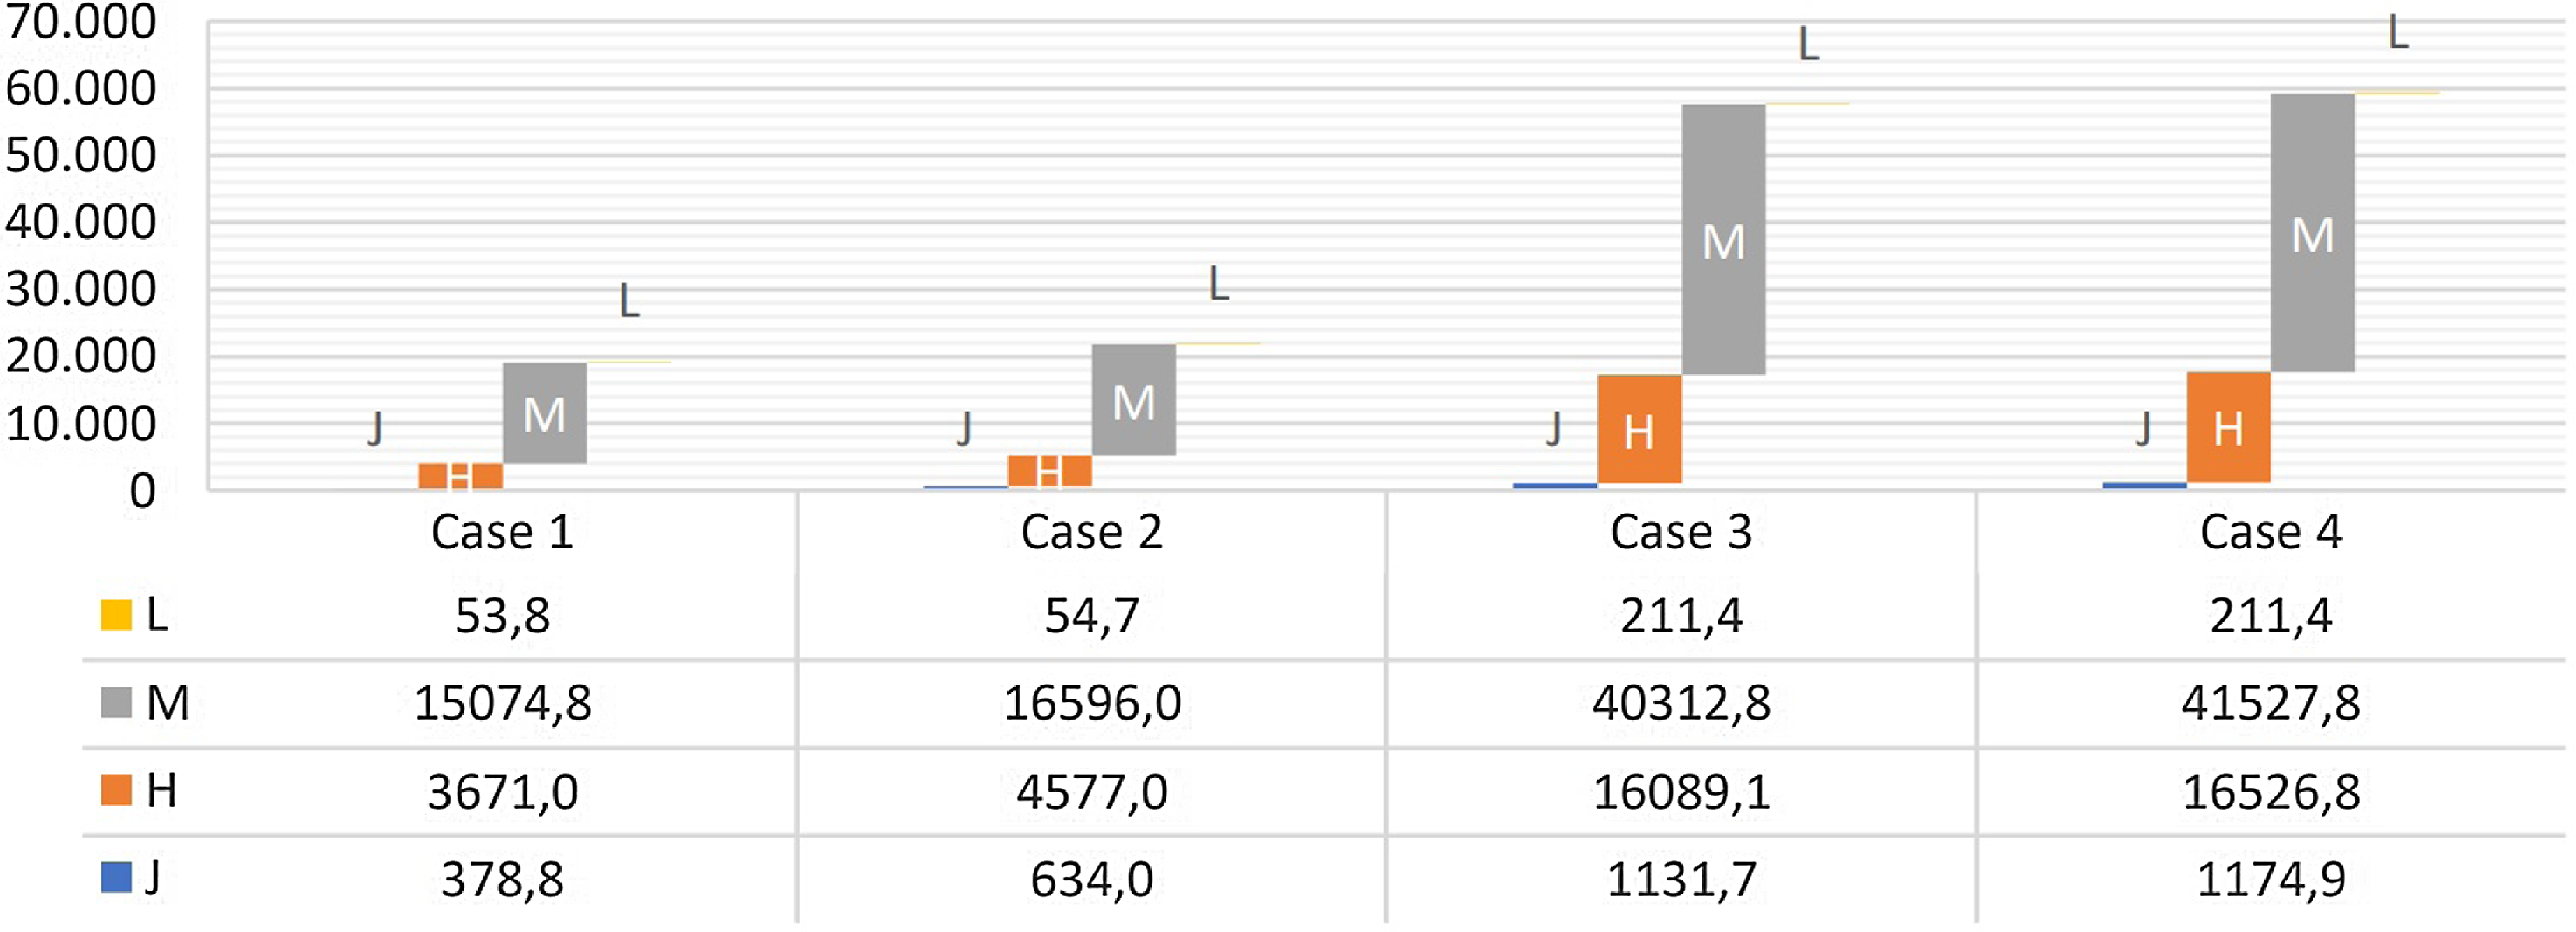
Figure 5. Distribution of flights into aircraft size in term of distance improvement for 3,629 common simulated flights.
In Fig. 5, it is shown the variation and distribution of flight distance improvements in cases according to aircraft size. Accordingly, medium-class aircrafts contributed to improvement by 78% in Case 1, 75% in Case 2, 69% in Case 3 and Case 4; heavy-class aircrafts also contributed 27% in Case 1, 19% in Case 2, 21% in Case 3 and Case 4. Light-class aircrafts has a value around 2-3%, and jumbo-class (A380) has around 2% in all cases.
Table 2 shows improvements across all metrics across all cases. The first part of the table shows only the total savings for the compared flights which are affected from the FRA/cross-border FRA operations (3,629 common simulated flights). In the second part, the values found as a result of the ratio per flight of the total values to these flights. In the third part the ratios converted for 7,935 flights using the region. According to this table, compared to Case1; Case 2 showed a higher improvement of 14%, Case 3 showed a higher improvement of 200%, and Case 4 showed a higher improvement of 210%.
Table 2. Total improvement values of Scenario Economy tool outputs and the mean values
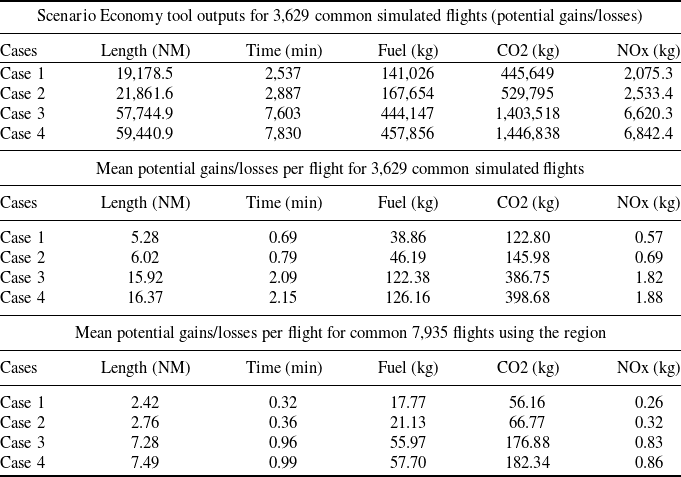
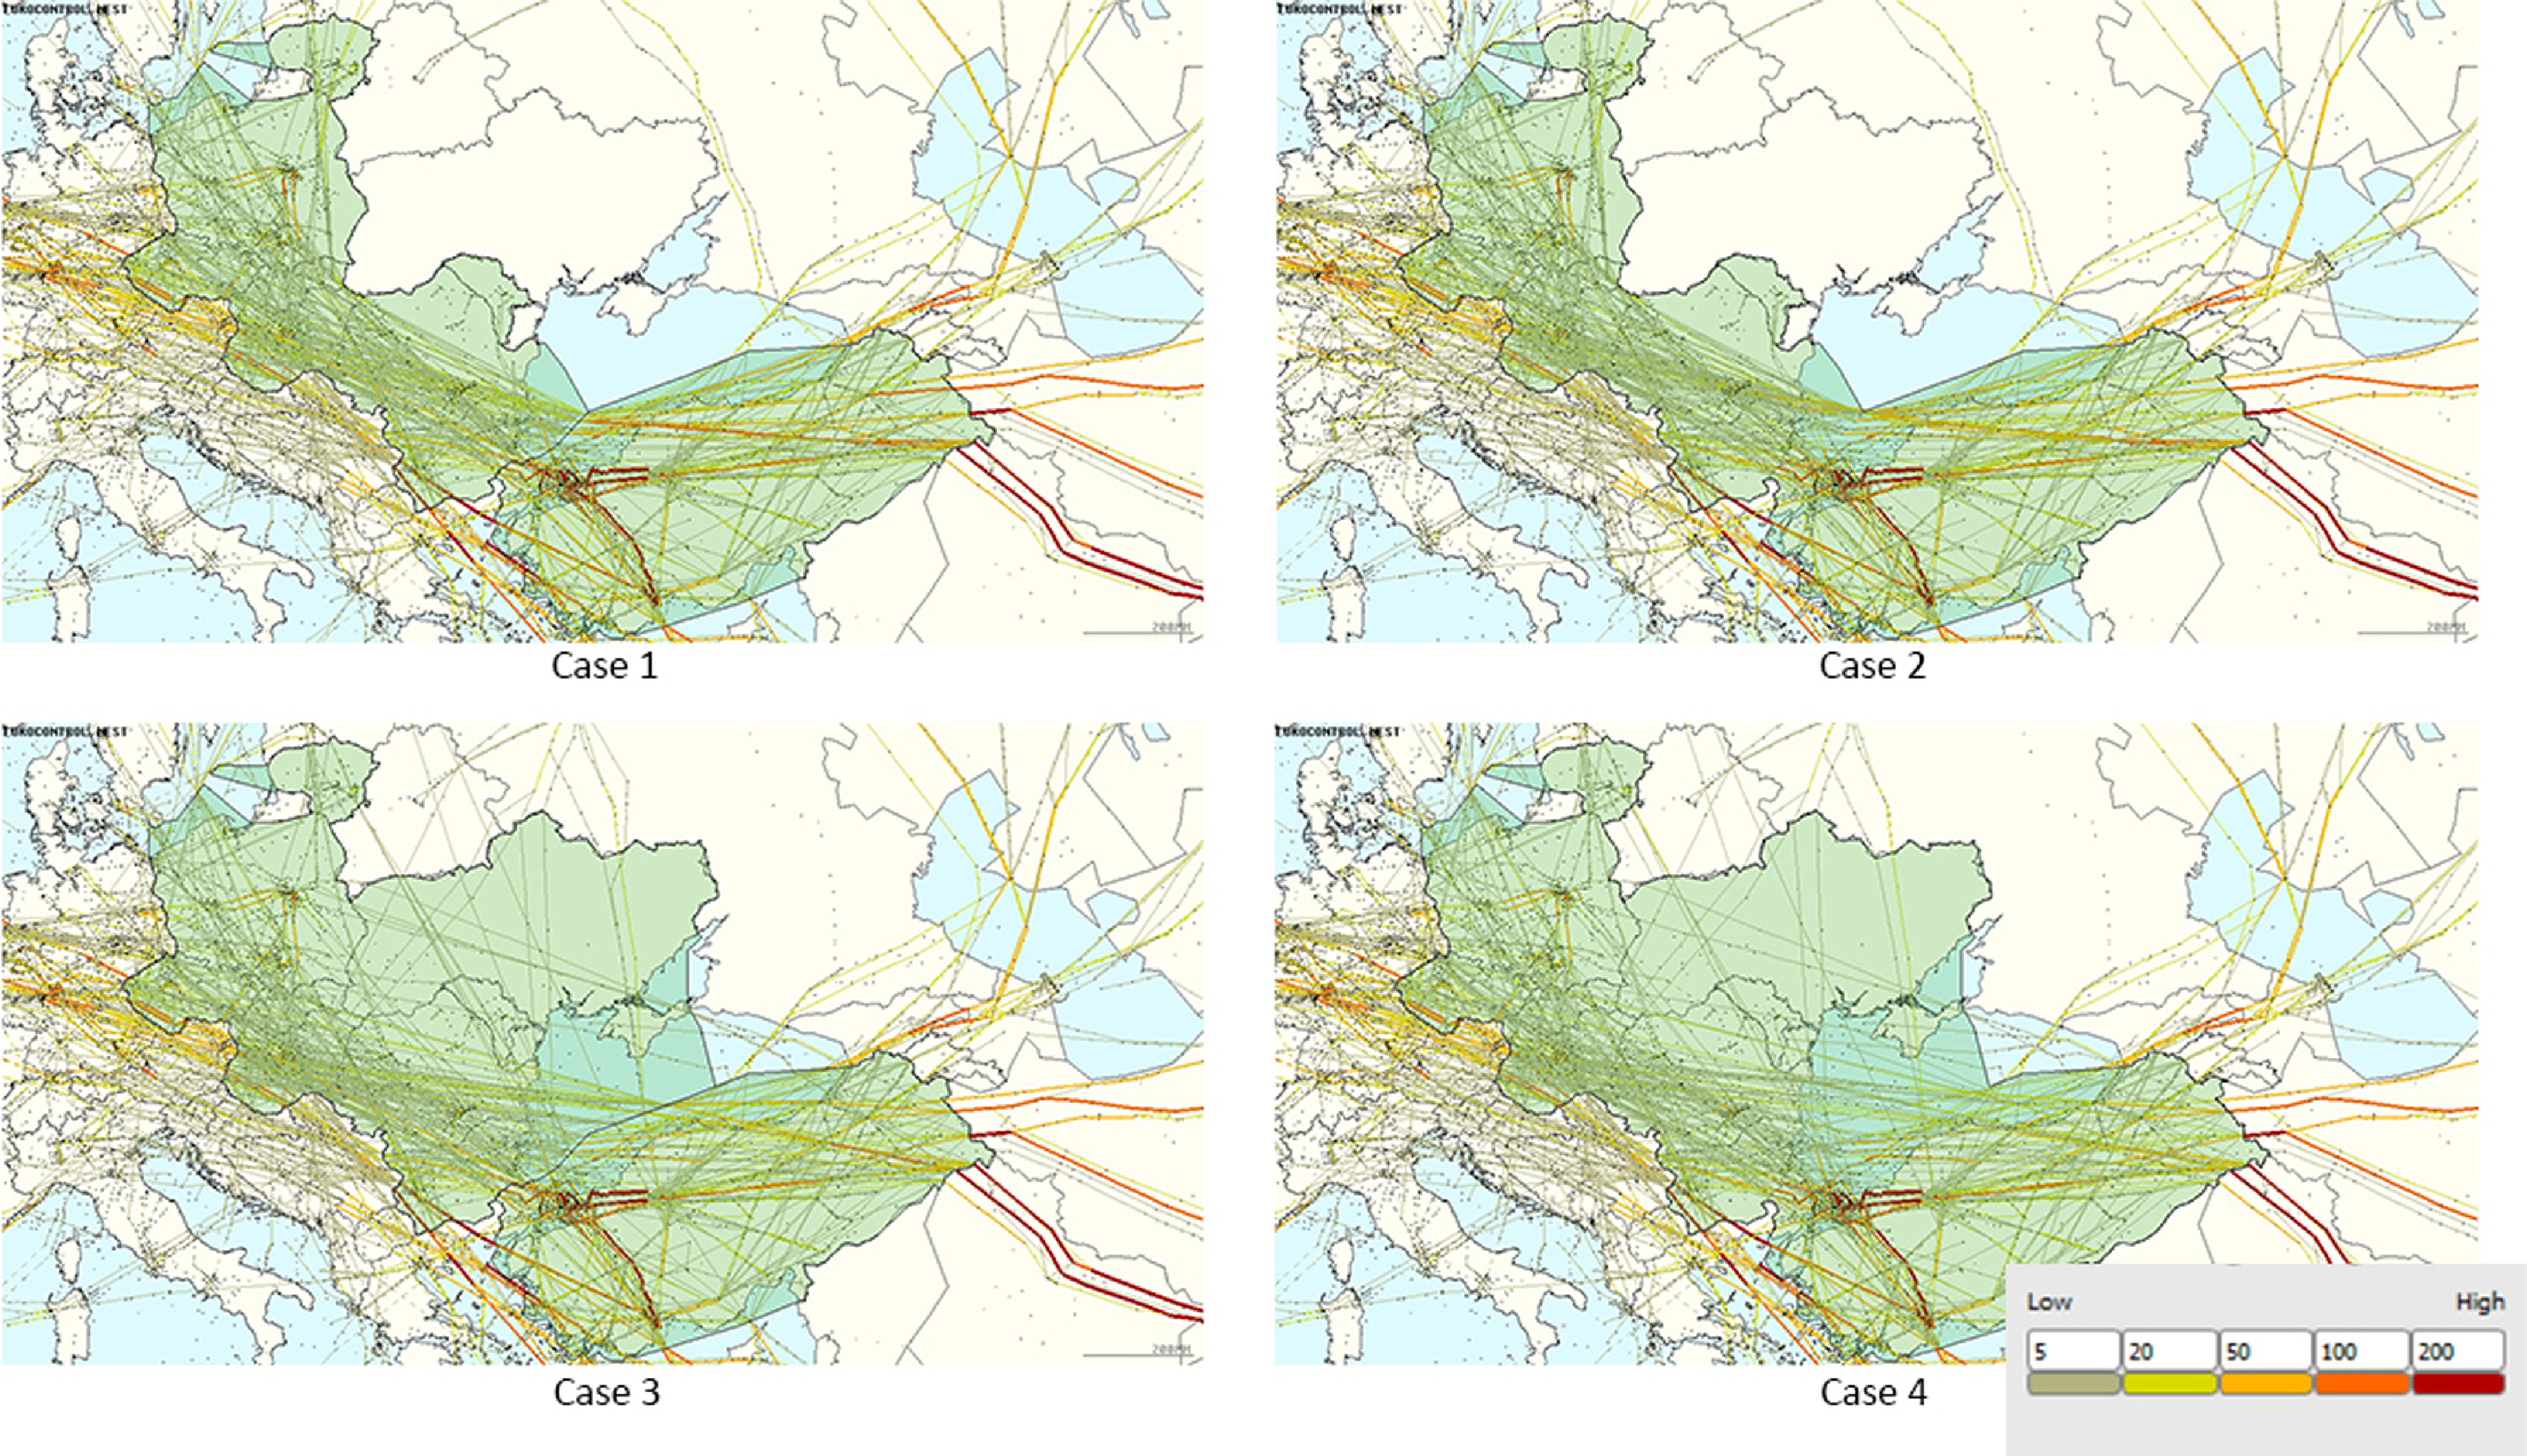
Figure 6. Map of traffic distribution and segment densities of cases.
There are no flights from Ukrainian airspace, which is closed in Case 1 and 2. In Moldova, there are very few flights. The transitions between EEFRA and Türkiye, which take place via mandatory points in Case 1, are random and without obligation in accordance with the cross-border implementation in Case 2. Therefore flights mostly pile up on the eastern part of this boundary (east of UDROS point), due to the tendency to follow the shortest route (Figs. 6, 7). The reason for this pile, even though it is the right action for efficiency, is bad in term of complexity, i.e. decreasing safety, given that the flow in this area of the boundary is reciprocal. If Ukrainian airspace is not to be opened, the use of mandatory intermediate (I) points on this boundary may bea good decision to improve air traffic safety and reduce the workload of air traffic controllers. In other words, a cross-border implementation like the one in Case 2 is not a good choice because of the high cost of the return. The difference of the Case 4 from the Case 2 is that the flow in the region spreads over a wider boundary line and shifts eastward. It allows the cross-border operation to function without congestion in a specific area. On the other hand, the opening of Ukrainian airspace in Case 3 and 4 has intensified Moldova and eastern Romania as well. In Case 1 and 2 have around 300 more flights through Hungary and Slovakia than Case 3 and 4. Almost all of these flights fly close to the eastern borders of these countries on Case 1 and 2 due to the shortest route trend. With the opening of Ukrainian airspace, these flights shifts to Ukraine and the east of Hungary and Slovakia have also become partially sparse (Fig. 5).
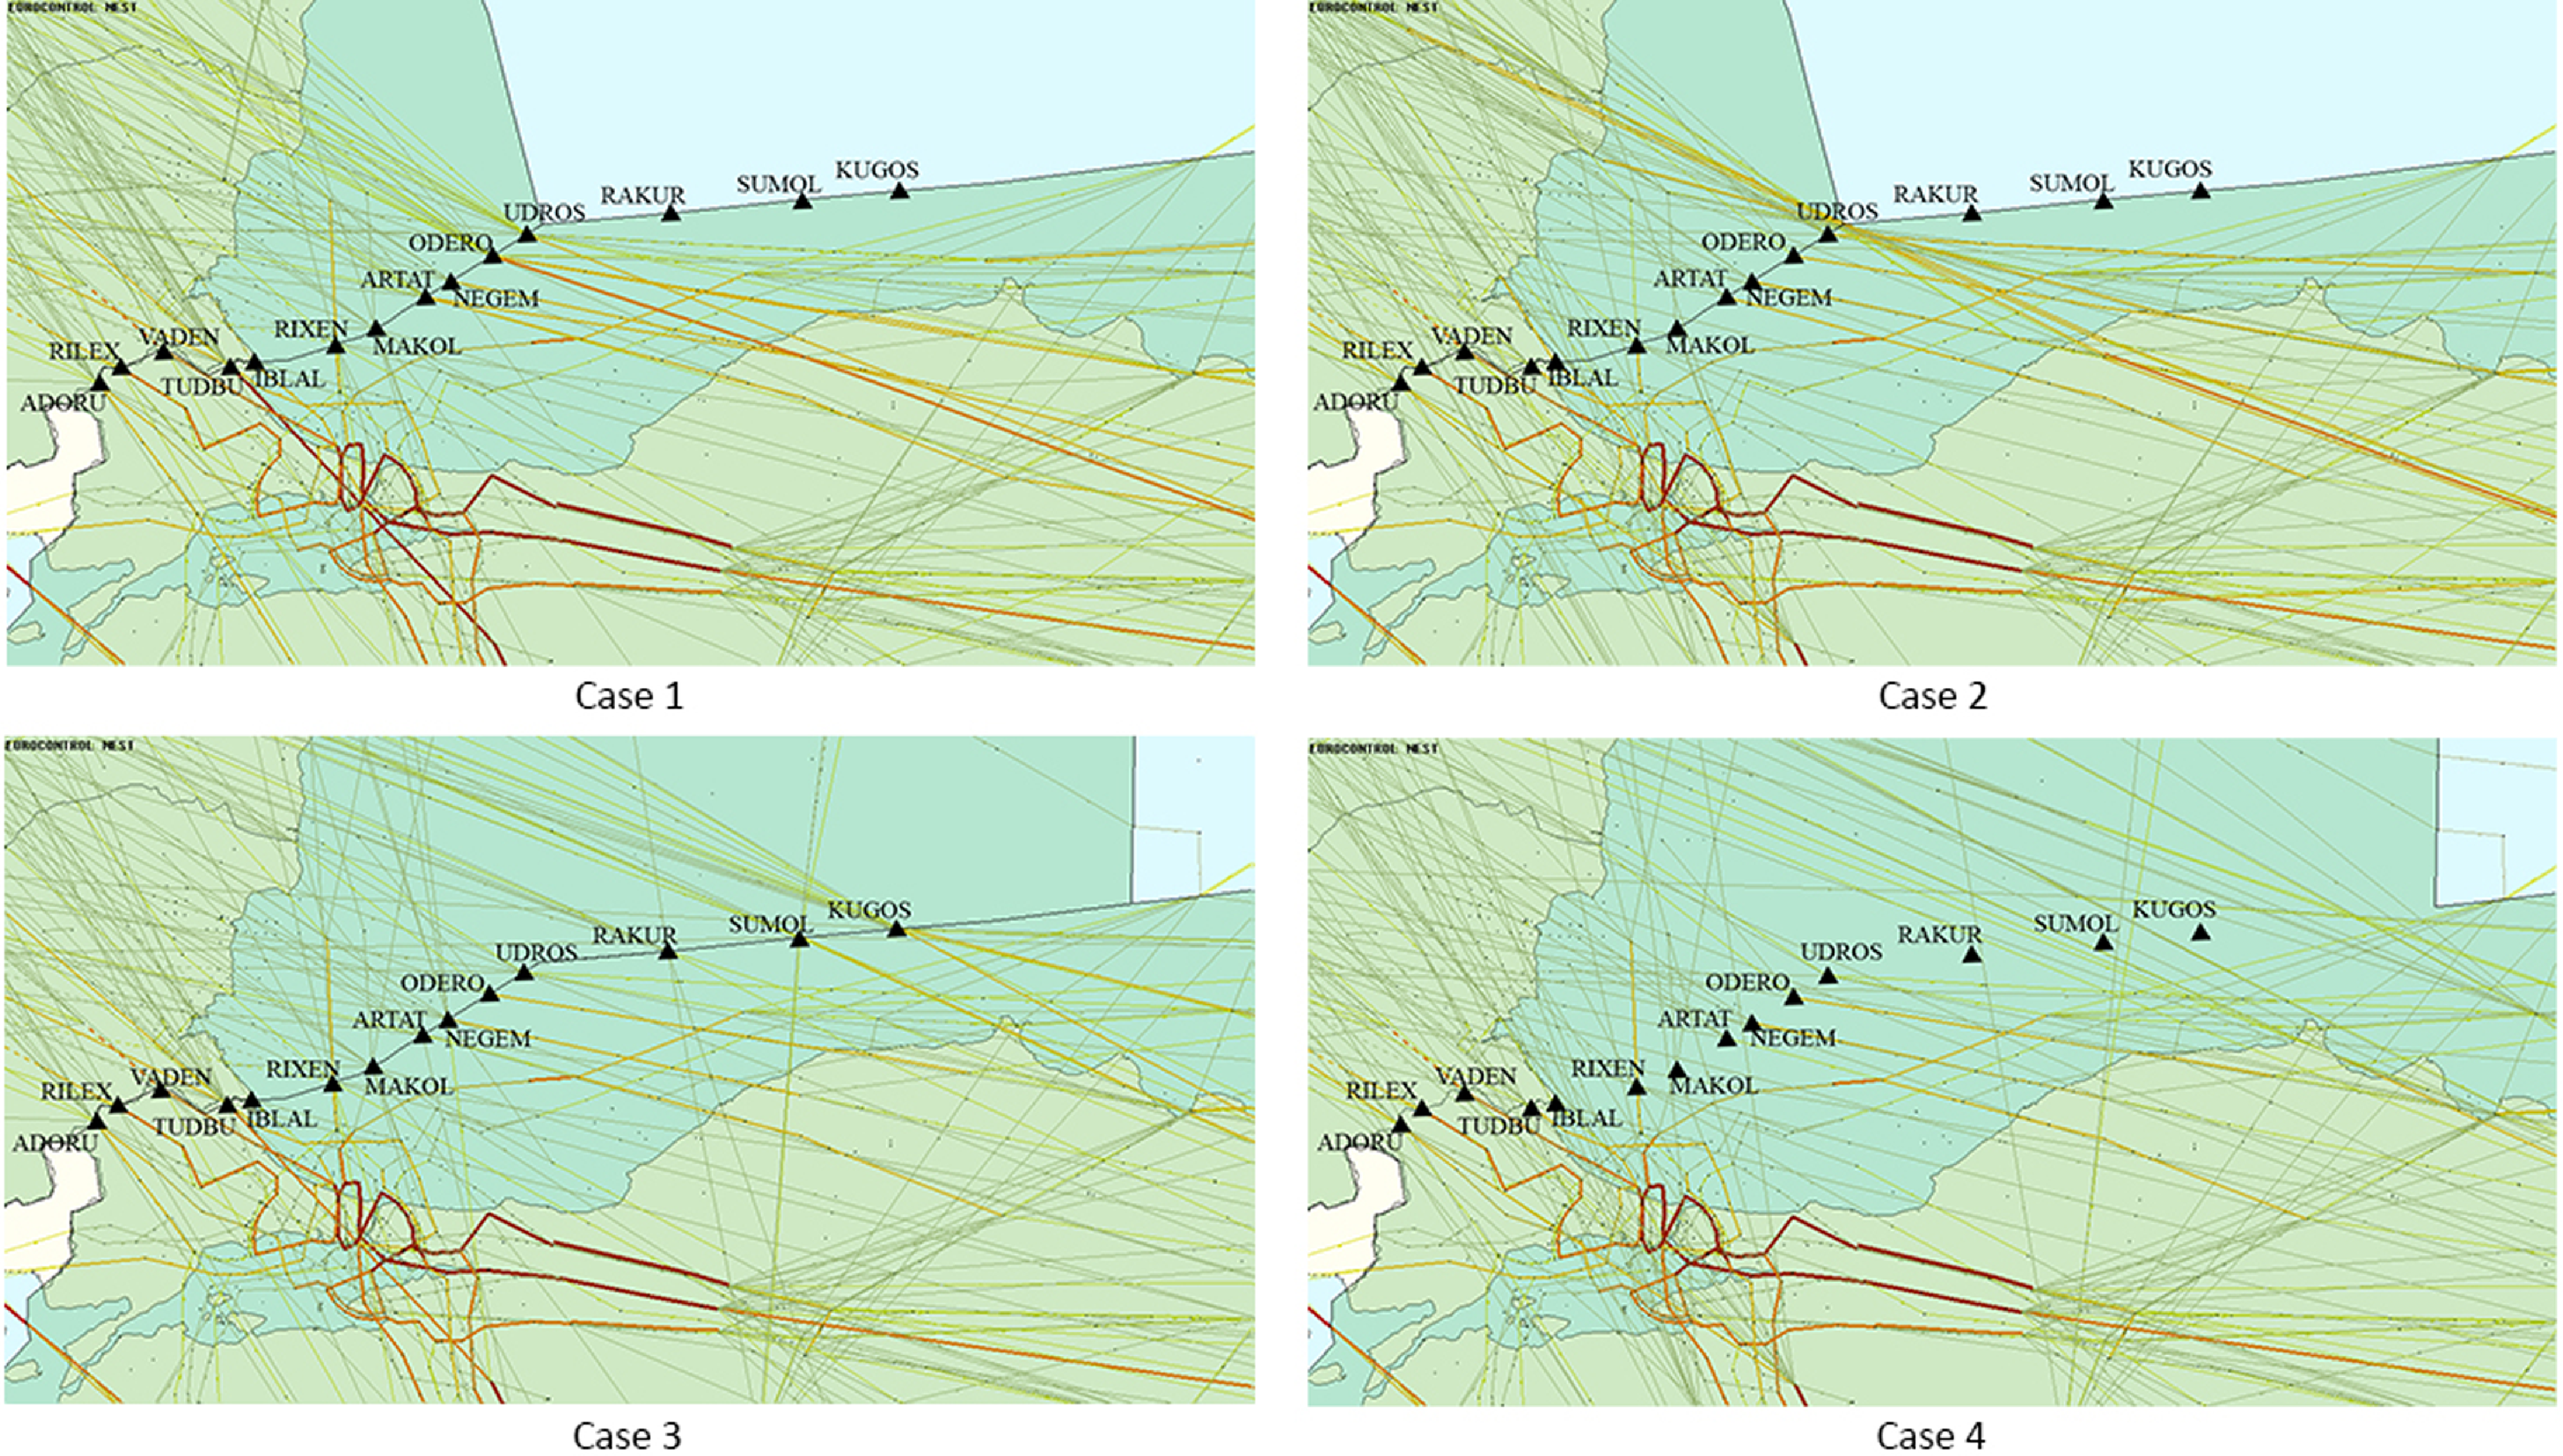
Figure 7. EEFRA and Türkiye boundary traffic density for cases.
When all these data are evaluated, Case 4 is seen as the most feasible case to implement. In addition to making a great contribution with the opening of Ukraine to flights, the cross-border FRA applied with Türkiye has also shown an additional development. However, due to the complexity of airspace and reduced predictability, air traffic controllers may need some additional tools that can increase their ability to make decisions. The necessity of these tools is clearly stated in the reports after simulation sessions conducted for Türkiye’s FRA implementation as well [21].
5.0 Conclusions and discussions
Following the negative impact of the Covid-19 pandemic, it is expected by all stakeholders that aviation will continue to develop again in the coming periods all over the world. This inference is easily made considering both the increase in demand and the development of technology. Developments in air traffic management will naturally proceed in parallel. These developments can also bring problems. For this reason, concepts and ideas have been sought in addition to technological developments. The FRA and the cross-border FRA are also the product of these pursuits. Shortening the distance flown, less fuel consumption, less carbon emissions are the main benefits of FRA and cross-border FRA. The effects of FRA and cross-border FRA mentioned in this study on Türkiye, the countries in the region and the flights using this region were examined with the help of NEST fast-time simulation software. In total, four different cases were examined. These cases were compared with the reference scenario for a day with a high traffic number in the summer of 2022 and evaluated with both visual outputs and numerical data.
In the cases examined, the political agendas of the countries in the region have a significant impact. One of the important problems facing the ECAC region today is that the Ukrainian airspace is closed to civil air traffic due to the world political situation. In this study, this airspace was evaluated from two different perspectives as both closed and open to civil air transport. The opening of Ukrainian airspace would create an abnormal shift in the boundary of Türkiye, Ukraine and the EEFRA – as it is called in this study. While Ukrainian airspace is closed (Case 1, 2), the northwest-southeast axis flow piled up to the easternmost part of the Türkiye-EEFRA boundary will cross Ukrainian airspace as a result of the opening of Ukrainian airspace. While there are no flights when the Ukrainian airspace is closed, it is crossed by around 740 flights when it is open. When FRA or cross-border FRA is applied at FL285 and higher levels, cases where the Ukrainian airspace is open provide great benefits for flights as expected. Compared to the reference, the Case 3 has a total improvement of 57,745NM – that is, an average improvement of 7.2NM per flight in 7935 flights using the region, and 59,440NM in the Case 4 – or an average improvement of 7.5NM. It is 56 and 66kg reductions in CO2 emissions in Cases 1 and 2, respectively, and 176 and 182kg reductions in Cases 3 and 4, respectively. Domestic flights or short-haul flights do not contribute much to these numbers. The first reason for this is that due to the short distance, the aircraft could not climb above the division level (FL285 in this study). The second and main reason is that even if it climbs above this level, the flight distance between the departure connection point (D) and the arrival connection point (A) is not long enough to contribute much.
The impact of FRA and cross-border FRA implementations on complexity is a controversial issue. Some claim it reduces it, while others claim the opposite. However, it is a fact that FRA implementation create more conflict zones by distributing ‘hotspot’ intersection zones. While gaining the blessings of FRA, it is necessary to protect some balances in order not to increase the workload and not to lose flight safety. Therefore, the workload it will bring to ATC should be reduced by means of decision-support systems and also some flow mangement regulations are needed. For instance, in Case 2 the border of EEFRA and Türkiye has a more complex region than the others. On the other side, comparing Case 3 and 4, Case 3 is more stable in terms of the regularity of the Turkish-Ukrainian border. In this sense, the contribution of mandatory border points is visible. In addition, due to the shortest route tendency, routes passing through regions close to the boundaries may need to be regulated by Route Availability Document (RAD) rules. Likewise, dense areas should be sparsed and flows around airports with high number of departures and landings should be regulated in a similar way. The traffic density east of the Türkiye-EEFRA boundary in Case 2 can be given as an example. In such a situation, the region can be made safer by adding some rules that will make the boundary points mandatory, or cross-border may not be implemented on this boundary line when the Ukrainian airspace is closed. These elements used for flow management can organise complexity. On the contrary, the excess of these regulations can be seen as a part of contradicting the sense of FRA. At this point, the balance between the return and cost of flow rules should be maintained. While Ukrainian airspace is open, on the contrary, the cross-border FRA to be implemented with Türkiye will be the structure that contributes the most to the improvement in the metrics aforementioned. The differences between these cases are factors that affect complexity.
Acknowledgements
We thank Biljana Juricic, PhD and Tea Rogosic from Zagreb University, faculty of Transport and Traffic Sciences Croatia for helping us to understand better cross-border free route operations and the first steps of creating simulation models.


