Hostname: page-component-7bb8b95d7b-wpx69 Total loading time: 0 Render date: 2024-09-28T06:56:51.037Z Has data issue: false hasContentIssue false

Modelling the passive breakup of a surfactant-contaminated droplet in a T-junction microchannel

Published online by Cambridge University Press:  06 May 2024

Jinggang Zhang*
Affiliation:
School of Building Services Science and Engineering, Xi'an University of Architecture and Technology, Xi'an 710055, China
Yongguang Wang
Affiliation:
School of Building Services Science and Engineering, Xi'an University of Architecture and Technology, Xi'an 710055, China
Li Chen
Affiliation:
School of Building Services Science and Engineering, Xi'an University of Architecture and Technology, Xi'an 710055, China
Linjun Shen
Affiliation:
School of Building Services Science and Engineering, Xi'an University of Architecture and Technology, Xi'an 710055, China
Haihang Cui*
Affiliation:
School of Building Services Science and Engineering, Xi'an University of Architecture and Technology, Xi'an 710055, China
*
Email addresses for correspondence: [email protected], [email protected]

Abstract

A lattice Boltzmann method is used to explore the effect of surfactants on the unequal volume breakup of a droplet in a T-junction microchannel, and the asymmetry due to fabrication defects in real-life microchannels is modelled as the pressure difference between the two branch outlets ($\Delta {P^\ast }$). We first study the effect of the surfactants on the droplet dynamics at different dimensionless initial droplet lengths ($l_0^\ast $) and capillary numbers (Ca) under symmetric boundary conditions ($\Delta {P^\ast } = 0$). The results indicate that the presence of surfactants promotes droplet deformation and breakup at small and moderate $l_0^\ast $ values, while the surfactant effect is weakened at large $l_0^\ast $ values. When the branch channels are completely blocked by the droplet, a linear relationship is observed between the dimensionless droplet length ($l_d^\ast $) and dimensionless time (${t^\ast }$), and two formulas are proposed for predicting the evolution of $l_d^\ast $ with ${t^\ast }$ for the two systems. We then investigate the effect of the surfactants on the droplet breakup at different values of $\Delta {P^\ast }$ and bulk surfactant concentrations (${\psi _b}$) under asymmetric boundary conditions ($\Delta {P^\ast } \ne 0$). It is observed that, as $\Delta {P^\ast }$ increases, the volume ratio of the generated droplets (${V_1}/{V_2}$) decreases to 0 in both systems, while the rate of decrease is higher in the clean system, i.e. the presence of surfactants could cause a decreased pressure difference between the droplet tips. As ${\psi _b}$ increases, ${V_1}/{V_2}$ first increases rapidly, then remains almost constant and finally decreases slightly. We thus establish a phase diagram that describes the ${V_1}/{V_2}$ variation with $\Delta {P^\ast }$ and ${\psi _b}$.

Type
JFM Papers
Copyright
© The Author(s), 2024. Published by Cambridge University Press

1. Introduction

Droplet-based microfluidic devices are critical in research areas such as bioanalysis (Sharma & Sharma Reference Sharma and Sharma2022; Xu et al. Reference Xu, Cheng, Li, Zhang, Zhu, Qi, Chen and Han2022; Sun et al. Reference Sun, Qu, Azi, Liu, Li, Lv, Du, Chen, Chen and Liu2023), disease surveillance (Giuffrida, Cigliana & Spoto Reference Giuffrida, Cigliana and Spoto2018; Nix et al. Reference Nix, Ghassemi, Crommen and Fillet2022), the synthesis of nanomaterials (Zou et al. Reference Zou, Huang, Zheng, Pan, Zhang, Xie, Zhao and Li2022; Gimondi et al. Reference Gimondi, Ferreira, Reis and Neves2023; Yao et al. Reference Yao, Zhu, Chen, Li, Sun, Li, Zou, Qi, Liang and Chen2023) and microchemical reactors (Whitesides Reference Whitesides2006; Verma & Pandya Reference Verma and Pandya2022). In these areas, droplets with controlled volume and good uniformity are prerequisites for ensuring device accuracy and sensitivity. T-junction microchannels have been widely used to passively split droplets into two daughter droplets comprising similar volumes (Leshansky & Pismen Reference Leshansky and Pismen2009). In practical applications, fabrication defects inevitably exist in microchannels, which not only result in asymmetry between the two branch channels, but also generate daughter droplets of different volumes. Although active agents or surfactants are known to promote droplet breakup and prevent droplets from coalescing (Baret et al. Reference Baret, Kleinschmidt, Harrak and Griffiths2009; Pan et al. Reference Pan, Tseng, Chen, Huang, Wang and Lai2016), their effects on the disturbed flow field, neck contraction process and enhancement or weakening of the disturbances caused by tiny deficiencies and defects are still unclear. Therefore, it is necessary to understand the effect of surfactants on the passive breakup of a droplet in a T-junction microchannel, which is helpful for controlling the surfactant dosage and generating droplets with controlled volume.

Numerous studies have been conducted to investigate the passive break-up of droplets flowing through T-junction microchannels. Hoang et al. (Reference Hoang, Portela, Kleijn, Kreutzer and van Steijn2013) numerically studied the breakup of three-dimensional droplets under the action of creeping flow in symmetric T-junction microchannels. They found that the droplet breakup process can be divided into two stages: (I) the droplet deforms under the action of an external flow field, and (II) the droplet neck rapidly contracts and breaks up owing to the Reyleigh–Plateau instability (Rayleigh Reference Rayleigh1878). They also reported that the droplet neck begins to spontaneously pinch off when the neck curvature is higher than the curvature of the rest of the interface and that the breakup mechanism is similar to the end-pinching mechanism for unconfined droplets proposed by Stone, Bentley & Leal (Reference Stone, Bentley and Leal1986). Chen & Deng (Reference Chen and Deng2017) used the phase-field lattice Boltzmann (LB) model to study the dynamic behaviour of droplets flowing through T-shaped microchannels. They found that the appearance of a tunnel (the tunnel between the droplet and channel sidewalls) was a prerequisite for the final non-breakup of the droplet. The tunnel effect not only slows down the droplet deformation rate, but may also induce non-breakup of the droplet in the T-junction microchannel. Chen, Xue & Hu (Reference Chen, Xue and Hu2019) numerically studied the droplet breakup process in symmetric microfluidic T-junctions comprising circular tubes. They found that the neck collapsed suddenly when the capillary pressure at the centre of the droplet neck was balanced by the pressure inside the neck. At the same time, the average radius of the neck was approximately 0.51 times the channel radius.

The size of the microchannel is usually at the micron level (Hoang et al. Reference Hoang, Haringa, Portela, Kreutzer, Kleijn and van Steijn2014); therefore, any minor disturbances, such as fluctuations in the inlet flow rate and outlet pressure, and the non-uniformity of the wall roughness, will have an impact on the breakup behaviour of droplets in T-junction microchannels. Chen & Deng (Reference Chen and Deng2017) adopted a phase-field multiphase LB model to study the dynamic behaviour of a two-dimensional droplet flowing through a T-junction microchannel, wherein the interfacial tension along the radial direction of the droplet neck was not considered. When a small pressure fluctuation is applied to the one-branch outlet, the droplet that remains stable at the T-junction begins to undergo asymmetric deformation and eventually drains from the one-branch channel. Hoang et al. (Reference Hoang, Haringa, Portela, Kreutzer, Kleijn and van Steijn2014) experimentally investigated the repeated breakup of bubbles in sequential T-junction microchannels. They stated that the microchannel used in the experiment is bound to have a small asymmetry owing to the limitations of the current microchannel process technology, which is one of the reasons why the droplet breaks up into sub-droplets of different volumes. Samie, Salari & Shafii (Reference Samie, Salari and Shafii2013) experimentally studied the breakup behaviour of a droplet in an asymmetric T-junction microchannel with two branches of identical lengths and different cross-sections. As the cross-sectional area ratio of the two branch channels increases, the breakup model of the mother droplet first changes from a symmetric breakup to an asymmetric breakup, and finally to a non-breakup, and the droplet drains from one branch channel. Fu, Ma & Li (Reference Fu, Ma and Li2014) experimentally investigated the breakup process of bubbles in T-shaped microchannels, where the lengths of the two branch channels were unequal. They found that the difference in volume between the sub-bubbles first exhibited an increasing and then decreasing trend as the injection ratio of the continuous fluid was increased.

Considerable research has thus been conducted to elucidate the passive breakup mechanisms of clean droplets in T-junction microchannels. However, little attention has been focused on the effect of surfactants on the breakup mechanism. The characteristic size of the T-junction microchannels is usually in the micron level, so the tiny deficiencies and defects in microchannels can seriously affect the flow field and thus generate daughter droplets of different volumes. To the best of our knowledge, little research has focused on how to suppress such small perturbations to generate daughter droplets of equal volumes. In addition, the experiments failed to accurately measure the volume of the generated droplets and neck thickness, and to capture the distributions of the velocity magnitude and surfactant concentration (Zhu & Wang Reference Zhu and Wang2017). Comparatively speaking, numerical simulations can not only overcome the aforementioned shortcomings, but also facilitate the individual adjustment of the influencing parameters to arrive at universal laws.

In this paper, we adopt our recently developed LB method (Zhang et al. Reference Zhang, Cui, Liu, Chen, Zhang and Li2023a) to study the effect of the surfactants on a droplet flowing through a T-junction microchannel. We first investigate the effect of surfactants on the droplet dynamics under a symmetric boundary condition ($\Delta {P^\ast } = 0$). The surfactant role is identified by comparing the droplet morphology, neck contraction process, neck breakup time and flow pattern between the clean and surfactant-contaminated systems under different values of the initial droplet length and capillary number. A pressure difference is then introduced between the two branch outlets in the multiphase systems to represent the small disturbance. Under the action of the pressure difference ($\Delta {P^\ast } \ne 0$), the mother droplet may break up asymmetrically or flow into one branch channel. The effects of the surfactants on the asymmetric breakup of the mother droplet are identified by comparing the volume ratio of the two generated droplets (${V_1}/{V_2}$) between the two systems under different values of $\Delta {P^\ast }$ and bulk surfactant concentration (${\psi _b}$). Finally, a phase diagram that describes how ${V_1}/{V_2}$ varies with $\Delta {P^\ast }$ and ${\psi _b}$ is presented.

2. Problem statement

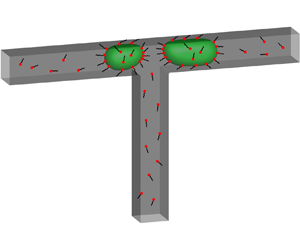
We consider the passive breakup of a surfactant-contaminated droplet in a T-junction microchannel (figure 1), where green and grey indicate the droplet interface and channel wall, respectively. The microchannel is composed of a vertical entrance channel of length ${L_1} = 150\;{\rm \mu}\mathrm{m}$, width $W = 30\;{\rm \mu}\mathrm{m}$ and height $H = 30\;{\rm \mu}\mathrm{m}$ and two horizontal branch channels of the same width and height. The length of the horizontal channel is $L = 200\;{\rm \mu}\mathrm{m}$, and the vertical channel is located in the middle of the horizontal channel. The densities of the continuous and dispersed fluids are ${\rho ^R} = {\rho ^B} = 1000\;\textrm{kg}\;{\textrm{m}^{ - 3}}$; the dynamic viscosities of the continuous and dispersed fluids are ${\mu ^R} = 8{\mu ^B} = 0.008\;\textrm{Pa}\;\textrm{s}$; the interfacial tension is $\sigma = 0.005\;\textrm{N}\;\textrm{m}$. A constant inlet velocity ${u_{in}}$ is imposed at the inlet, and two constant pressures (${P_1}$ and ${P_2}$) are imposed at the left and right branch outlets, respectively. Driven by the injected fluid, a droplet of initial dimensionless length $l_0^\ast $ flows from the vertical channel into the T-junction with two branches of equal length.

Figure 1. Diagram of the surfactant-contaminated droplet breakup in a T-junction microchannel, where the droplet interface and microchannel wall are indicated in green and grey, respectively. The constant velocity ${u_{in}}$ is imposed at the bottom inlet, while the constant pressures ${P_1}$ and ${P_2}$ are respectively imposed at the left and right branch outlets, respectively.

To obtain the LB simulation parameters, three reference quantities are selected, i.e. the time scale ${T_0} = {10^{ - 7}}\;\textrm{s}$, length scale ${L_0} = {10^{ - 6}}\;\textrm{m}$ and mass scale ${M_0} = {10^{ - 15}}\;\textrm{kg}$. A physical parameter having the dimensions ${(\textrm{m})^{n1}}{(\textrm{s})^{n2}}{(\textrm{kg})^{n3}}$ is divided by ${({L_0})^{n1}}{({T_0})^{n2}}{({M_0})^{n3}}$ to obtain the value of the corresponding LB parameter. Following this criterion, we can obtain the LB simulation parameters: ${W_{LB}} = W/{L_0} = 30$, $\rho _{LB}^R = \rho _{LB}^B = {\rho ^R}/({M_0}/L_0^3) = 1$, $\mu _{LB}^R = 8\mu _{LB}^B = {\mu ^R}/({M_0}/{L_0}{T_0}) = 0.8$ and ${\sigma _{LB}} = {\sigma _0}/({M_0}/T_0^2) = 0.005$, where the subscript ‘LB’ indicates the LB parameter and is used to distinguish between the LB and physical parameters. Unless stated otherwise, the pressures imposed at the left and right branch outlets are considered as ${P_1} = {P_2} = {P_0} = {\rho _0}c_s^2 = 1/3$, where ${\rho _0} = 1$ is the initial density of the two fluids, and ${c_s} = 1/\sqrt 3 $ is the speed of sound (Hafen et al. Reference Hafen, Thieringer, Meyer, Krause and Dittler2023). The static contact angle is fixed at ${\theta _0} = 0^\circ $, indicating that the microchannel wall completely halts the dispersed fluid. For the surfactant-contaminated system, the bulk surfactant concentration is considered to be ${\psi _b} = 0.1$, and the elasticity number is considered as ${E_0} = 0.5$. The mobility is fixed at ${M_\psi } = 0.01$, and the diffusivity and bulk surfactant solubility are considered to be $Pi = 1.35$ and ${E_x} = 0.117$ (Soligo, Roccon & Soldati Reference Soligo, Roccon and Soldati2019, Reference Soligo, Roccon and Soldati2020), respectively.

The problem is characterized using four dimensionless parameters, i.e. the capillary number $Ca$, Reynolds number $Re$, dimensionless pressure difference $\Delta {P^\ast }$ and viscosity ratio $\lambda $, which are given by

(2.1ad)\begin{equation}Ca = \frac{{{\mu ^R}{u_{in}}}}{{{\sigma _0}}},\quad Re = \frac{{{\rho ^R}W{u_{in}}}}{{{\mu ^R}}},\quad \Delta {P^\ast } = P_1^\ast- P_2^\ast ,\quad \lambda = \frac{{{\mu ^R}}}{{{\mu ^B}}},\end{equation}

where the dimensionless pressures $P_1^\ast $ and $P_2^\ast $ are denoted as $P_1^\ast= {P_1}/{P_0}$ and $P_2^\ast= {P_2}/{P_0}$, respectively; $\Delta {P^\ast } = 0$ and $\Delta {P^\ast } \ne 0$ represent the symmetric and asymmetric boundary conditions, respectively. For the flow regimes under consideration, the Reynolds number is small ($0.012 \le Re \le 0.070$); therefore, the inertial effect can be neglected compared with the viscous effect. The viscosity ratio is fixed at $\lambda = 8$ to reduce the influencing parameters. Therefore, two dimensionless parameters ($Ca$ and $\Delta {P^\ast }$) are left to characterize the problem.

As in the experiments (Chagot et al. Reference Chagot, Quilodrán-Casas, Kalli, Kovalchuk, Simmons, Matar, Arcucci and Angeli2022; Kalli & Angeli Reference Kalli and Angeli2022) and numerical simulations (Zhang et al. Reference Zhang, Zhang, Zhao, Liu and Jiang2022, Reference Zhang, Cui, Liu, Chen, Zhang and Li2023a), the breakup process of a droplet in a T-junction for clean and surfactant-contaminated systems is compared for the same dimensionless parameters, which indicates that the differences between the two systems can be attributed to the reduced interfacial tension caused by the adsorption of surfactants at the droplet interface and the Marangoni stress caused by the non-uniform distribution of surfactants at the droplet interface.

3. Numerical method

In this study, our recently developed LB method (Zhang et al. Reference Zhang, Cui, Liu, Chen, Zhang and Li2023a) is used to simulate the hydrodynamics of surfactant-contaminated droplets in a T-junction microchannel. In this method, a colour-gradient model is used to solve the two-phase flows, and an additional LB model is used to solve the surfactant transport. These two models are coupled using a modified Langmuir equation of state (Liu et al. Reference Liu, Zhang, Ba, Wang and Wu2020; Zhang et al. Reference Zhang, Liu, Wei, Hou and Jiang2021a), which allows the surfactant concentration to reach or exceed the critical micelle concentration (CMC). Furthermore, a ‘predictor–corrector' wetting boundary condition (Xu, Liu & Valocchi Reference Xu, Liu and Valocchi2017; Akai, Bijeljic & Blunt Reference Akai, Bijeljic and Blunt2018; Zhang et al. Reference Zhang, Cui, Liu, Chen, Zhang and Li2023a,Reference Zhang, Shen, Cui, Chen and Chenb) is adopted to enforce the contact angle on an arbitrary solid surface. A compact summary of this method is provided below.

3.1. The LB colour-gradient model for immiscible two-phase flows

In the LB colour-gradient model, $f_i^B$ and $f_i^R$ denote blue and red fluids, respectively, and the subscript i represents the $i\textrm{th}$ lattice velocity direction. The total distribution function is defined as ${f_i} = f_i^B + f_i^R$. First, the collision step is executed for ${f_i}$, which reads as follows (Jiang et al. Reference Jiang, Yang, Boek and Tsuji2021):

(3.1)\begin{equation}f_i^{\dagger} (\boldsymbol{x},t) = {f_i}(\boldsymbol{x},t) + {\varOmega _i}(\boldsymbol{x},t) + {\bar{F}_i},\end{equation}

where ${f_i}(\boldsymbol{x},t)$ and $f_i^{\dagger} (\boldsymbol{x},t)$ are the pre- and post-collision distribution functions in the $i\textrm{th}$ lattice velocity direction at the spatial coordinates $\boldsymbol{x}$ and time $t$ and ${\bar{F}_i}$ is the forcing term. The parameter ${\varOmega _i}(\boldsymbol{x},t)$ is the multiple-relaxation-time collision operator, which is expressed as follows (Zhang, Liu & Ba Reference Zhang, Liu and Ba2019):

(3.2)\begin{equation}{\varOmega _i}(\boldsymbol{x},t) =- \sum\limits_j {{{({\boldsymbol{M}^{ - 1}}\boldsymbol{SM})}_{ij}}(\,{f_j}(\boldsymbol{x},t) - f_j^{eq}(\boldsymbol{x},t))} ,\end{equation}

where $\boldsymbol{S}$ is the diagonal relaxation matrix and $\boldsymbol{M}$ is the transformation matrix, which can be obtained from the study of Wang, Liu & Zhang (Reference Wang, Liu and Zhang2016); $f_i^{eq}$ is the equilibrium distribution function as defined by Wei et al. (Reference Wei, Huang, Hou and Sukop2018)

(3.3)\begin{equation}f_i^{eq} = \rho {w_i}\left[ {1 + \frac{{{\boldsymbol{e}_i}\boldsymbol{\cdot }\boldsymbol{u}}}{{c_s^2}} + \frac{{{{({\boldsymbol{e}_i}\boldsymbol{\cdot }\boldsymbol{u})}^2}}}{{2c_s^4}} - \frac{{{\boldsymbol{u}^2}}}{{2c_s^2}}} \right],\end{equation}

where $\boldsymbol{u}$ is the fluid velocity and $\rho = {\rho ^B} + {\rho ^R}$ is the total density, where ${\rho ^B}$ and ${\rho ^R}$ are the densities of the blue and red fluids, respectively. The speed of sound ${c_s}$, weighting factors ${w_i}$ and lattice velocities ${\boldsymbol{e}_i}$ can be obtained from the study of Wang et al. (Reference Wang, Liu and Zhang2016).

The expression for $\boldsymbol{S}$ in (3.2) is given by Liu et al. (Reference Liu, Zhang, Ba, Wang and Wu2020) as follows:

(3.4)\begin{equation}\boldsymbol{S} = \textrm{diag}[0,s_1,{s_2},0,{s_4},0,{s_4},0,{s_4},{s_9},{s_{10}},{s_9},{s_{10}},{s_{13}},{s_{13}},{s_{13}},{s_{16}},{s_{16}},{s_{16}}],\end{equation}

with

(3.5a,b)\begin{equation}{s_1} = {s_2} = {s_9} = {s_{10}} = {s_{13}} = \omega ,\quad {s_4} = {s_{16}} = 8(2 - {s_1})/(8 - {s_1}),\end{equation}

where the parameter $\omega $ is related to the dynamic viscosity $\mu $ as $\mu = (1/\omega - 0.5)\rho c_s^2{\delta _t}$. A harmonic function is used to ensure the smooth transition of the viscosity across a two-phase interface comprising unmatched viscosities, and it is given by

(3.6)\begin{equation}\frac{1}{\mu } = \frac{{1 - {\rho ^N}}}{{2{\mu ^B}}} + \frac{{1 + {\rho ^N}}}{{2{\mu ^R}}},\end{equation}

where ${\mu ^B}$ and ${\mu ^R}$ are the dynamic viscosities of the blue and red fluids, respectively. The index function ${\rho ^N}$ is responsible for identifying the position of the fluid–fluid interface, which is defined as ${\rho ^N} = ({\rho ^R} - {\rho ^B})/({\rho ^R} + {\rho ^B})$.

The interfacial force ${\bar{F}_i}$ in (3.1) is defined as follows (Yu & Fan Reference Yu and Fan2010):

(3.7)\begin{equation}{\bar{F}_i} = \sum\limits_j {{{\left( {\boldsymbol{I} - \frac{1}{2}{\boldsymbol{M}^{ - 1}}\boldsymbol{SM}} \right)}_i}_j{w_j}\left[ {\frac{{{\boldsymbol{e}_j} - \boldsymbol{u}}}{{c_s^2}} + \frac{{({\boldsymbol{e}_j}\boldsymbol{\cdot }\boldsymbol{u}){\boldsymbol{e}_j}}}{{c_s^4}}} \right]\boldsymbol{\cdot }{\boldsymbol{F}_s}{\delta _t}} ,\end{equation}

where $\boldsymbol{I}$ is the $9 \times 9$ unit matrix. The interfacial force ${\boldsymbol{F}_s}$ consists of the interfacial tension force and Marangoni stress due to the non-uniform interfacial tension, which is given as (Zhang et al. Reference Zhang, Liu, Wei, Hou and Jiang2021a)

(3.8)\begin{equation}{\boldsymbol{F}_s} =- {\textstyle{1 \over 2}}\sigma k\boldsymbol{\nabla }{\rho ^N} + {\textstyle{1 \over 2}}|\boldsymbol{\nabla }{\rho ^N}|{\nabla _s}\sigma ,\end{equation}

where $\sigma $ is the interfacial tension. The interface curvature k is defined as $k =- {\nabla _s}\boldsymbol{\cdot }\boldsymbol{n} =- [\boldsymbol{\nabla } - \boldsymbol{n}(\boldsymbol{n}\boldsymbol{\cdot }\boldsymbol{\nabla })]\boldsymbol{\cdot }\boldsymbol{n}$, where the unit normal vector of the fluid–fluid interface $\boldsymbol{n}$ is defined as $\boldsymbol{n} =- \boldsymbol{\nabla }{\rho ^N}/|\boldsymbol{\nabla }{\rho ^N}|$. The first and second terms on the right side of (3.8) are the interfacial tension force and Marangoni stress, respectively.

Following a previous study (Zhang, Liu & Zhang Reference Zhang, Liu and Zhang2021b), a modified Langmuir equation of state is adopted to describe the variation in the interfacial tension $\sigma (\psi )$ with the surfactant concentration, which is given by

(3.9)\begin{equation}\sigma (\psi ) = \textrm{max}\{ {\sigma _{min}},\;{\sigma _0}[1 + {E_0}\,\textrm{log}(1 - \psi )]\} ,\end{equation}

where ${E_0}$ is the elasticity number, $\psi $ is the dimensionless surfactant concentration, ${\sigma _0}$ is the interfacial tension in the absence of surfactants and ${\sigma _{min}}$ is the minimum interfacial tension, which is set as ${\sigma _0}/3$ to avoid obtaining non-physical negative values for $\sigma (\psi )$.

Subsequently, a recolouring step is implemented to separate the two immiscible fluids and maintain a reasonably diffuse interface. Finally, the propagation step is executed to transport $f_i^B$ and $f_i^R$ to adjacent lattice nodes. These two steps are identical to those adopted by Zhang et al. (Reference Zhang, Liu and Ba2019). The distribution function after the streaming step is used to calculate the densities and velocities of the two fluids, i.e. ${\rho ^k}(\boldsymbol{x},t) = \sum\nolimits_i {f_i^k(\boldsymbol{x},t)} $ and $\rho \boldsymbol{u}(\boldsymbol{x},t) = \sum\nolimits_i {f_i^k(\boldsymbol{x},t){\boldsymbol{e}_i}} + 0.5\boldsymbol{\cdot }{\boldsymbol{F}_s}(\boldsymbol{x},t){\delta _t}$, where k = or R.

3.2. The LB model for surfactant transport

The transportation of soluble surfactants is described by the Cahn–Hilliard equation given by Soligo et al. (Reference Soligo, Roccon and Soldati2019) and Zong et al. (Reference Zong, Zhang, Liang, Wang and Xu2020)

(3.10)\begin{equation}\frac{{\partial \psi }}{{\partial t}} + \boldsymbol{u}\boldsymbol{\cdot }\boldsymbol{\nabla }\psi = \frac{1}{{Pe}}\boldsymbol{\nabla }\boldsymbol{\cdot }({M_\psi }\boldsymbol{\nabla }{\mu _\psi }),\end{equation}

where the mobility ${M_\psi }$ is taken as 0.01 and the Péclet number Pe is taken as 10 (Zhang et al. Reference Zhang, Cui, Liu, Chen, Zhang and Li2023a). The chemical potential ${\mu _\psi }$ is expressed as

(3.11)\begin{equation}{\mu _\psi } = Pi\,\textrm{log}\left( {\frac{\psi }{{1 - \psi }}} \right) - \frac{{{{[1 - {{({\rho ^N})}^2}]}^2}}}{4} + \frac{{{{({\rho ^N})}^2}}}{{2{E_x}}},\end{equation}

where the parameters ${E_x}$ and $Pi$ are used to control the bulk surfactant solubility and surfactant diffusivity, respectively.

The LB method is used to solve (3.10), which is written as (Liang et al. Reference Liang, Shi, Guo and Chai2014; Zhang et al. Reference Zhang, Liu, Wei, Hou and Jiang2021a)

(3.12)\begin{align} & {g_i}(\boldsymbol{x} + {\boldsymbol{e}_i}{\delta _t},\textrm{ }t + {\delta _t}) - {g_i}(\boldsymbol{x},\textrm{ }t)\nonumber\\ &\quad =- \dfrac{1}{{{\tau _g}}}[{g_i}(\boldsymbol{x},\textrm{ }t) - g_i^{eq}(\boldsymbol{x},\textrm{ }t)] + {w_i}\dfrac{{{\boldsymbol{e}_i}\boldsymbol{\cdot }\boldsymbol{u}}}{{c_s^2}}{\partial _t}\psi \delta t, \end{align}

where ${g_i}$ is the distribution function of $\psi $. The dimensionless relaxation time ${\tau _g}$ is set as 1 (Wang et al. Reference Wang, Liu and Zhang2016). Here, $g_i^{eq}$ is the equilibrium distribution function of ${g_i}$, which is written as (Wang et al. Reference Wang, Liu and Zhang2016)

(3.13)\begin{equation}g_i^{eq} = {w_i}({G_i} + 3\psi {\boldsymbol{e}_i}\boldsymbol{\cdot }\boldsymbol{u}),\end{equation}

with

(3.14)\begin{equation}{G_i} = \begin{cases} {[\psi - (1 - {w_0})\varGamma \psi /c_s^2]/{w_0},}&{i = 0}\\ {\varGamma \psi /c_s^2,}&{i > 0} \end{cases},\end{equation}

where the parameter $\varGamma $ is connected to ${M_\psi }$ by ${M_\psi } = {\delta _t}\varGamma ({\tau _g} - 0.5)$.

Wang et al. (Reference Wang, Liu and Zhang2016) proved that (3.12) can be rewritten as shown in (3.10) within the limitation of a low Mach number using the Chapman–Enskog analysis. The surfactant concentration $\psi $ is calculated using $\psi (\boldsymbol{x},t) = \sum\nolimits_i {{g_i}(\boldsymbol{x},t)} $.

3.3. Wetting boundary conditions

The contact angle formed between the solid substrate and the fluid–fluid interface is used to quantify the solid wettability. In this study, we assume that the presence of surfactants only decreases the fluid–fluid interfacial tension, but does not affect the solid–fluid interfacial tension. Therefore, the relationship between the dynamic contact angle $\theta (\psi )$ and the surfactant concentration can be obtained as follows (Zhang et al. Reference Zhang, Liu, Wei, Hou and Jiang2021a):

(3.15)\begin{equation}\theta (\psi ) = \textrm{arccos}\left( {\frac{{\textrm{cos}\,{\theta_0}}}{{1 + {E_0}\,\textrm{log}(1 - \psi )}}} \right),\end{equation}

where ${\theta _0}$ is the static contact angle in the absence of surfactants.

Subsequently, the ‘predictor–corrector’ wetting boundary condition is used to enforce the dynamic contact angle $\theta (\psi )$ on an arbitrary solid surface. The basic concept of this boundary condition is to modify the orientation of the index function gradient $\boldsymbol{\nabla }{\rho ^N}$ to achieve the desired contact angle. Details of the implementation steps can be found in previous studies (Xu et al. Reference Xu, Liu and Valocchi2017; Akai et al. Reference Akai, Bijeljic and Blunt2018; Zhang et al. Reference Zhang, Cui, Liu, Chen, Zhang and Li2023a,Reference Zhang, Shen, Cui, Chen and Chenb).

It should be noted that our numerical method has been validated against the experimental results by simulating the generation of clean droplets in T-junction microchannels (Zhang et al. Reference Zhang, Zhang, Zhao, Liu and Jiang2022) as well as the analytical solutions for the invasion velocity and minimum pressure difference of a clean droplet invading a capillary tube with variable cross-sections (Zhang et al. Reference Zhang, Cui, Liu, Chen, Zhang and Li2023a). In addition, our method was validated by comparing the numerical results of the equilibrium surfactant distribution across a two-phase interface with the analytical profile in both two- and three-dimensional cases (Zhang et al. Reference Zhang, Liu, Wei, Hou and Jiang2021a, Reference Zhang, Cui, Liu, Chen, Zhang and Li2023a).

4. Grid independence test and validation

Before further validating our numerical method, a grid-independence test was conducted to determine a reasonable grid resolution. Figure 2 presents the dimensionless neck thickness ${\delta ^\ast }$ as a function of the dimensionless time ${t^\ast }$ for a clean droplet breakup in a T-junction microchannel, where the black triangles, red circles and blue squares correspond to three different mesh sizes ($W = 20$, 30 and 40 lattices). Each mesh size corresponds to the physical channel width of $30\;{\rm \mu}\mathrm{m}$. The dimensionless time is defined as ${t^\ast } = Ca\,{\sigma _0}t/{\mu ^R}W$, and the time for the droplet to completely enter the horizontal channel is considered to be ${t^\ast } = 0$. The dimensionless neck thickness ${\delta ^\ast }$ is defined as ${\delta ^\ast } = \delta /W$, where $\delta $ is the droplet neck thickness (inset image). It can be observed from the figure that the numerical results gradually converge as W increases. In particular, the numerical results for $W = 30$ lattices and 40 lattices are coincident, indicating that the grid resolution is sufficiently high for the two grid resolutions.

Figure 2. Time evolution of dimensionless neck thickness ${\delta ^\ast }$ at three different grid resolutions for clean system (${\psi _b} = 0$). The dimensionless neck thickness and time are defined as ${\delta ^\ast } = \delta /W$ and ${t^\ast } = Ca\,{\sigma _0}t/{\mu ^R}W$, respectively. The black triangles, red circles and blue squares correspond to the mesh sizes of $W = 20$, 30 and 40 lattices, respectively. The other parameters are fixed at $Ca = 0.01$, $l_0^\ast= 3.5$ and $\Delta {P^\ast } = 0$.

The breakup process of a droplet in a T-junction microchannel can be divided into two stages based on the exponent of the scaling law (Leshansky et al. Reference Leshansky, Afkhami, Jullien and Tabeling2012). In the first stage, $1 - {\delta ^\ast }$ has a linear relationship with ${t^\ast }$. However, in the subsequent stage, $1 - {\delta ^\ast }\sim {t^\ast }^{3/7}$ causes the droplet neck to collapse rapidly within a finite time. This scaling law exponent has been widely validated by Leshansky et al. (Reference Leshansky, Afkhami, Jullien and Tabeling2012), Hoang et al. (Reference Hoang, Portela, Kleijn, Kreutzer and van Steijn2013), Chen & Deng (Reference Chen and Deng2017) and Wang et al. (Reference Wang, Zhu, Wu, Fu and Ma2015). As shown in figure 2, the time evolution of $1 - {\delta ^\ast }$ can be described by the analytical scaling 1 law in the former stage and by the analytical 3/7 scaling law in the subsequent stage. This indicates that our proposed numerical method could capture the transient breakup process of the droplet.

Because our recent work (Zhang et al. Reference Zhang, Cui, Liu, Chen, Zhang and Li2023a) has shown that our numerical method can correctly describe surfactant transport in a bulk solution and at the fluid–fluid interface, only a grid independence test is required to select a reasonable grid resolution. Figure 3 presents the temporal evolution of the dimensionless neck thickness ${\delta ^\ast }$ for the surfactant-contaminated system (${\psi _b} = 0.1$), where three mesh sizes ($W = 20$, 30 and 40 lattices) are presented. It can be observed that the numerical results are independent of the channel width when $W \ge 30$ lattices, which is the same as the case of the clean system (figure 2). To balance the computational requirements and model performance, the channel width of the $W = 30$ lattices is selected for both the clean and surfactant-contaminated systems in the following simulations.

Figure 3. Time evolution of dimensionless neck thickness ${\delta ^\ast }$ at three grid resolutions for a surfactant-contaminated system (${\psi _b} = 0.1$). The black triangles, red circles and blue squares correspond to the mesh sizes of $W = 20$, 30 and 40 lattices, respectively. The other parameters are fixed at $Ca = 0.01$, $l_0^\ast= 3.5$ and $\Delta {P^\ast } = 0$.

5. Results and discussion

In this section, we study the passive breakup process of droplets in T-junction microchannels under symmetric and asymmetric boundary conditions, i.e. $\Delta {P^\ast } = 0$ and $\Delta {P^\ast } \ne 0$. These two boundary conditions are realized by reducing the right branch outlet pressure ($P_2^\ast $), while maintaining the left branch outlet pressure ($P_1^\ast $) at a constant. The effect of surfactants on the droplet breakup process under two boundary conditions is identified by comparing clean and surfactant-contaminated systems with the same dimensionless parameters.

5.1. Symmetric boundary condition

This subsection presents an examination of the effect of surfactants on the droplet breakup process in a T-junction microchannel under symmetric boundary conditions ($\Delta {P^\ast } = 0$), where the surfactant role is identified by comparing the droplet morphology, temporal evolution of the droplet neck thickness and breakup time at the same dimensionless initial droplet length $l_0^\ast $ and capillary number $Ca$.

5.1.1 Effect of initial droplet length

The effect of the dimensionless initial droplet length $l_0^\ast $ on the droplet breakup process is investigated by decreasing $l_0^\ast $ from 3.5 to 0.75. Figure 4 displays the temporal evolution of the droplet interface (${\rho ^N} = 0$) at (a) $l_0^\ast= 3.5$, (b) $l_0^\ast= 1.5$ and (c) $l_0^\ast= 1$ for the clean (top row) and surfactant-contaminated systems (bottom row), where the green, red and grey colours indicate the clean droplet interface, surfactant-contaminated droplet interface and microchannel wall, respectively. It should be noted that the capillary number and bulk surfactant concentration are fixed at $Ca = 0.01$ and ${\psi _b} = 0.1$, respectively. At $l_0^\ast= 3.5$ (figure 4a), the droplet almost completely blocks the two branch channels in both clean and surfactant-contaminated systems. It can be observed that the shapes of the clean and surfactant-contaminated droplets are nearly identical at the approaching time, and the breakup times of the droplet neck are close. We also observe that the droplet length appears larger in the surfactant-contaminated system than that in the clean system. When $l_0^\ast $ decreases to 1.5 (figure 4b), the surfactant-contaminated droplet deforms faster than the clean droplet, and the breakup time of the droplet neck is shorter in the surfactant-contaminated system than that in the clean system. As in the case of $l_0^\ast= 3.5$, the length of the surfactant-contaminated droplet also appears to be larger than that of the clean droplet. Upon further decreasing $l_0^\ast $ to 1 (figure 4c), the clean droplet eventually maintains a steady-state shape and stays at the T-junction, while the surfactant-contaminated droplet continues to deform over time and eventually breaks up into two daughter droplets of similar volumes. These phenomena suggest that the effect of the surfactants on the droplet dynamics is relatively weak at larger $l_0^\ast $ values (a comparison between the top and bottom rows is presented in figure 4a), while the surfactant effects are conducive to the droplet deformation and breakup at moderate and smaller $l_0^\ast $ values (a comparison between the top and bottom rows is presented in figure 4b,c).

Figure 4. Temporal evolution of the droplet interface (${\rho ^N} = 0$) at (a) $l_0^\ast= 3.5$, (b) $l_0^\ast= 1.5$ and (c) $l_0^\ast= 1$ for the clean (top row) and surfactant-contaminated systems (bottom row), where the dimensionless time is defined as ${t^\ast } = Ca\,{\sigma _0}t/({\mu ^R}W)$. The clean droplet interface, surfactant-contaminated droplet interface and microchannel wall are indicated green, red and grey, respectively. The other parameters are fixed at $Ca = 0.01$, ${\psi _b} = 0.1$ and $\Delta {P^\ast } = 0$.

A quantitative evolution of the dimensionless neck thickness ${\delta ^\ast }$ with the dimensionless time ${t^\ast }$ for both clean and surfactant-contaminated systems is presented in figures 5(a) and 5(b), respectively. It should be noted that ${\delta ^\ast }$ is defined as ${\delta ^\ast } = \delta /W$. In the cases of the droplet breakup, i.e. when ${\delta ^\ast }$ eventually decreases to zero, the breakup process can be divided into two stages. In the former stage, ${\delta ^\ast }$ slowly decreases as ${t^\ast }$ increases. In this stage, the inertial force dominates the neck contraction process, and the injected fluid compresses the droplet interface and reduces the thickness of the droplet neck. Meanwhile, the deformation of the droplet interface alleviates the compression of the injected fluid on the droplet neck, resulting in a decrease in the neck contraction rate. In the subsequent stage, the interfacial tension dominates the neck contraction process, and ${\delta ^\ast }$ rapidly decreases to zero within a finite time owing to the Rayleigh–Plateau instability (Plateau Reference Plateau1873; Rayleigh Reference Rayleigh1878). In addition, we also notice some differences in the droplet non-breakup cases between the two systems. It can be observed from the figure that ${\delta ^\ast }$ first decreases and then maintains a non-zero value as ${t^\ast }$ increases when $l_0^\ast \le 1.25$ for the clean system (figure 5a), while a similar evolution of ${\delta ^\ast }$ occurs with ${t^\ast }$ when $l_0^\ast= 0.75$ for the surfactant-contaminated system (figure 5b). This means that the presence of surfactants promotes the breakup of the droplet. We also note that the curve of ${\delta ^\ast }$ varying with ${t^\ast }$ overlaps when $l_0^\ast \ge 2.5$ for the clean system (figure 5a), while it overlaps when $l_0^\ast \ge 1.5$ for the surfactant-contaminated system (figure 5b). At large values of ${l_0}$ (figure 4a presents an example), the continuous fluid can no longer flow through the tunnel between the droplet interface and channel wall, which compresses the droplet neck and causes the neck to contract. At small values of ${l_0}$, however, the channel is partially blocked by the droplet (bottom row of figure 4c). The injected fluid not only squeezes the droplet to form a neck, but also flows through the tunnel between the droplet interface and channel wall. Therefore, the rate of decrease of ${\delta ^\ast }$ with ${t^\ast }$ depends not only on the injection rate of the continuous fluid, but also on the width of the tunnel between the droplet interface and channel wall. In order to explain the difference in the time evolution of ${\delta ^\ast }$ between the two systems, it is necessary to quantify the degree of blockage of the droplet to the branch channels.

Figure 5. Time evolution of the dimensionless neck thickness ${\delta ^\ast }$ under different values of the dimensionless initial droplet length $l_0^\ast $ for (a) the clean system and (b) surfactant-contaminated system, where ${\delta ^\ast }$ is defined as ${\delta ^\ast } = \delta /W$.

Figure 6 presents the temporal evolution of the dimensionless neck thickness ${\delta ^\ast }$ versus the dimensionless time ${t^\ast }$ for (a) the clean and (b) surfactant-contaminated systems. In both systems, $1 - {\delta ^\ast }$ has a linear relationship with the dimensionless time ${t^\ast }$, and the parameters ${\alpha _1}$ and ${\alpha _2}$ are close to 1 in the former stage. In this stage, the effect of the interfacial tension on the droplet dynamics is small owing to little deformation in the droplet rears. The inertia dominates the neck contraction process, and the rear interface keeps moving with the original velocity with little resistance from the interfacial tension. Therefore, a linear relationship between $1 - {\delta ^\ast }$ and ${t^\ast }$ is obtained.

Figure 6. Evolution of the neck thickness for various initial droplet lengths for the (a) clean and (b) surfactant-contaminated systems.

When the branch channels are completely blocked by the droplet, i.e. the flow between the droplet interface and channel wall is entirely suppressed, the increase in the droplet length is determined by the injection rate of the continuous fluid. We assume that the tunnels between the droplet tips and microchannel wall remain unchanged during the neck contraction process. The relationships among the initial droplet length ${l_{in}}$, droplet length ${l_d}$ and inlet velocity ${u_{in}}$ can be established through mass conservation, which is expressed as

(5.1)\begin{equation}{l_d} \boldsymbol{\cdot} \alpha = {l_{in}} \boldsymbol{\cdot} \alpha + {u_{in}} \boldsymbol{\cdot} t,\end{equation}

where $\alpha $ is the ratio of the maximum droplet area to the branch channel area in the yz plane, and ${l_d}$ is the length between the left and right droplet tips. By submitting ${u_{in}} = Ca \boldsymbol{\cdot} {\sigma _0}/{\mu ^R}$ into (5.1) and dividing W on both sides of the equal sign, we can derive

(5.2)\begin{equation}\frac{{{l_d}}}{W} = \frac{{{l_{in}}}}{W} + \frac{1}{\alpha } \boldsymbol{\cdot} \frac{{Ca \boldsymbol{\cdot} {\sigma _0}}}{{{\mu ^R}W}} \boldsymbol{\cdot} t,\end{equation}

which can be simplified as

(5.3) \begin{equation}{l_d^\ast}= {l_{in}^\ast}+ \frac{1}{\alpha } \boldsymbol{\cdot} {t^\ast },\end{equation}

where $l_{in}^\ast $ is the dimensionless initial droplet length at ${t^\ast } = 0$ and $l_d^\ast $ is the dimensionless droplet length at different values of ${t^\ast }$. This implies that $l_d^\ast $ increases linearly with ${t^\ast }$, and the corresponding rate of increase is $1/\alpha $.

The temporal evolutions of the dimensionless droplet length $l_d^\ast $ with different initial droplet lengths for the clean and surfactant-contaminated systems are presented in figures 7(a) and 7(b), respectively. In this figure, the solid and dashed straight lines are the auxiliary lines used to determine whether $l_d^\ast $ increases linearly with ${t^\ast }$, and the slopes of the solid and dashed straight lines both are 1.15. In the clean system (figure 7a), the variation in $l_d^\ast $ with ${t^\ast }$ is linear when $l_0^\ast \ge 2.5$, whereas it deviates from the linear relationship when $l_0^\ast \le 2$. However, in the surfactant-contaminated system (figure 7b), the variation in $l_d^\ast $ with ${t^\ast }$ is linear when $l_0^\ast \ge 1.5$, whereas it deviates from the linear relationship when $l_0^\ast \le 1.25$. The former linear relationship suggests that the corner flow is completely suppressed, i.e. the branch channels are completely blocked by the droplets. Therefore, the evolution of the dimensionless neck thickness ${\delta ^\ast }$ with ${t^\ast }$ overlaps when ${l_0} \ge 2.5$ and ${l_0} \ge 1.5$ for the clean and surfactant-contaminated systems (figure 5), respectively. The latter variation of $l_d^\ast $ with ${t^\ast }$ deviates from the linear relationship because the branch channels are partially blocked by the droplet, and the corner flow alleviates the compression of the injected fluid on the droplet neck. In addition, $l_d^\ast $ increases linearly with ${t^\ast }$ over a wider range of $l_0^\ast $ in the surfactant-contaminated system than in the clean system. This indicates that the presence of surfactants is conducive to droplet clogging of branch channels. The slopes of the dashed and solid straight lines are identical, suggesting that the rate of increase in $1/\alpha $ depends only on the boundary conditions.

Figure 7. Evolution of the dimensionless droplet length $l_d^\ast $ with different initial droplet lengths for (a) clean and (b) surfactant-laden systems, where $l_d^\ast $ is defined as $l_d^\ast= {l_d}/W$. The solid and dashed straight lines are auxiliary lines used to determine whether $l_d^\ast $ increases linearly with ${t^\ast }$.

To illustrate the effect of surfactants on the droplet dynamic behaviour when the two branch channels are partially blocked, figure 8 presents a schematic of a surfactant-contaminated droplet flowing through a T-junction under symmetric boundary conditions. Because the branch channels are partially blocked, the injected fluid can flow through the tunnels between the droplet interface and microchannel wall. Under the action of the injected fluid, the surfactants are swept away from the droplet neck and accumulate on both sides of the droplet (right column in figure 11). The uneven distribution of the surfactants at the droplet interface creates two Marangoni stresses ${F_M}$, which are directed towards the droplet neck (solid arrows). To balance ${F_M}$, two additional viscous drag forces ${F_v}$ are induced, which are in the direction opposite to that of ${F_M}$ and act at the droplet interface (dashed arrows). As can be observed, ${F_v}$ stretches the droplet bottom interface towards the two branch outlets and bottom wall of the branch channels, which is conducive to blocking the branch channels (figure 4b,c). Because the injection rate of the continuous fluid is constant, the enhanced degree of blockage of the droplet to the branch channels causes the continuous fluid to squeeze the droplet neck and reduce the neck thickness, which is helpful for droplet breakup (figures 4b,c and 5). In addition, the presence of surfactants is conducive to the blockage of the droplet in the branch channels, which causes $l_d^\ast $ to increase linearly with ${t^\ast }$ over a wider range of $l_0^\ast $ (figure 7).

Figure 8. Diagram of surfactant-contaminated droplet passing through T-junction microchannel in xz middle plane under symmetrical boundary conditions.

As shown in figure 9, we plot the velocity vectors and distribution of the shear stress ${\tau _{zx}}$ in the xz middle plane at ${t^\ast } = 1.1167$ for (a) the clean and (b) surfactant-contaminated systems. The shear-stress ${\tau _{zx}}$ is given by ${\tau _{zx}} = \mu (\partial u/\partial z + \partial w/\partial x)$, where u and w are the fluid velocities along the x and z directions, respectively. In the clean system (figure 9a), the shear stresses are larger on both sides of the droplet interface (indicated by the regions surrounded by white dashed lines), which is conducive to the formation of the vortex inside the droplet. These vortices not only prevent the droplet from stretching, but also prevent the neck from shrinking. However, in the surfactant-contaminated system (figure 9b), the shear stresses are large near the lower droplet interface (indicated by the two regions surrounded by white dashed lines), which stretch the droplet bottom interface towards the two branch outlets. This proves that additional viscous drag forces ${F_v}$ are induced in the surfactant-contaminated system, which stretch the droplet towards the two branch outlets. It can also be observed from the figure that the vortices are formed inside the clean droplet, but no vortex is visible inside the surfactant-contaminated droplet. The direction of the Marangoni stress is opposite to that of the fluid flow; therefore, the interface of the surfactant-contaminated droplet is rigidified (Riaud et al. Reference Riaud, Zhang, Wang, Wang and Luo2018; Zhang et al. Reference Zhang, Liu and Ba2019). Consequently, the vortex formation inside the surfactant-contaminated droplet is suppressed.

Figure 9. Velocity vectors and the distribution of the shear stress ${\tau _{zx}}$ in the xz middle plane at ${t^\ast } = 1.1167$ for (a) the clean and (b) surfactant-contaminated systems. The black and red curves represent the clean and surfactant-contaminated droplet interfaces, respectively. The other parameters considered are $Ca = 0.01$, ${\psi _b} = 0.1$, $l_0^\ast= 1.5$ and $\Delta {P^\ast } = 0$.

Figure 10 presents the variation of the dimensionless breakup time $t_{break}^\ast $ with the dimensionless initial droplet length $l_0^\ast $ for both clean and surfactant-contaminated systems. In either system, $t_{break}^\ast $ monotonically increases as $l_0^\ast $ decreases. As $l_0^\ast $ decreases, the blockage caused by the droplet to the branch channels becomes weaker and a part of the continuous fluid flows through the tunnel between the droplet interface and the microchannel wall, thus relieving the compression of the continuous fluid to the droplet neck (Chen & Deng Reference Chen and Deng2017; Sun et al. Reference Sun, Zhu, Fu, Ma and Li2019). Therefore, it is more difficult for the droplet neck to form and break up. We also notice that the difference in $t_{break}^\ast $ between the two systems decreases as $l_0^\ast $ increases. At small values of $l_0^\ast $, the branch channels are partially blocked, and the corner flow sweeps more surfactants away from the droplet neck, thus resulting in an uneven distribution of surfactants at the droplet interface. As mentioned above, the uneven distribution of surfactants at the droplet interface is conducive to the blockage of the branch channels and the formation of the droplet neck, which promotes the neck breakup. At high values of $l_0^\ast $, however, the microchannel is completely blocked by the droplet, i.e. the corner flow is entirely suppressed, the non-uniform distribution of surfactants at the droplet interface is weakened. The effects of the surfactants on the neck contraction process are accordingly reduced, and the neck contraction process is determined by the injection rate of the continuous fluid.

Figure 10. Dimensionless breakup time of the droplet neck ($t_{break}^\ast $) as a function of the dimensionless initial droplet length $l_0^\ast $ for clean (${\psi _b} = 0$) and surfactant-contaminated systems (${\psi _b} = 0.1$).

Figure 11 presents the distributions of the velocity magnitude (left column) and surfactant concentration (right column) in the xz middle plane for different dimensionless times, where the dimensionless initial droplet length is fixed at $l_0^\ast= 1$. When the droplet enters the T-junction, the branch channels are blocked by the droplet (at ${t^\ast } = 0.1833$). Under the action of the injected fluid, the droplet deforms into a dumbbell shape and the upper interface of the droplet becomes almost parallel to the channel wall (at ${t^\ast } = 4.9750$). At the same time, two tunnels between the lower droplet interface and the branch channel wall are symmetrically formed, and two high-velocity regions are formed near both sides of the lower droplet interface. The continuous fluid not only compresses the middle of the droplet to form a neck, but also stretches the droplet towards both sides of the branch channel outlets. As the continuous fluid velocity is directed towards both sides of the droplet tips, the surfactants are swept away from the droplet neck and accumulate at both sides of the droplet tips owing to the high curvature (Liu et al. Reference Liu, Ba, Wu, Li, Xi and Zhang2018, Reference Liu, Zhang, Ba, Wang and Wu2020). As the neck thickness decreases rapidly to a certain value, the droplet upper interface is far from the channel wall (at ${t^\ast } = 5.6$). Surfactants accumulate at the droplet neck, where the curvature is higher (Zhang et al. Reference Zhang, Liu and Zhang2021b). This decreases the interfacial tension in the neck and accelerates the neck contraction process, which can increase the drainage of fluid inside the neck towards the droplet tips. Finally, the droplet breaks up symmetrically into two daughter droplets (at ${t^\ast } = 5.7047$).

Figure 11. Distributions of the velocity magnitude (left column) and surfactant concentration (right column) in the xz middle plane for different dimensionless times. The dimensionless initial droplet length is considered as $l_0^\ast= 1$.

5.1.2. Effect of capillary number

The effect of the capillary number $Ca$ on the droplet dynamics is studied by increasing $Ca$ from 0.005 with an increment of 0.005, where the bulk surfactant concentration and dimensionless initial droplet length are fixed at ${\psi _b} = 0.1$ and $l_0^\ast= 1.5$, respectively. Figure 12 presents the time evolution of the droplet shapes at (a) $Ca = 0.005$ and (b) $Ca = 0.03$ for the clean (top row) and surfactant-contaminated systems (bottom row). At a small value of $Ca$, i.e. $Ca = 0.005$, the clean droplet eventually stays at the T-junction without forming a neck (the top row of figure 12a), while the surfactant-contaminated droplet forms a neck and eventually splits into two daughter droplets with equal volume (the bottom row of figure 12a). At the median value of $Ca$, i.e. $Ca = 0.01$, the clean and surfactant-contaminated droplets both break up, but the surfactant-contaminated droplet breaks up earlier than the clean droplet (figure 4b). At a large value of $Ca$, i.e. $Ca = 0.03$, the clean and surfactant-contaminated droplets both break up, and the breakup time of the two droplets nearly coincide (figure 12b). These phenomena indicate that the presence of surfactants promotes the droplet breakup at low values of $Ca$ and reduces the breakup time of the droplet neck at median values of $Ca$, but has little effect on the droplet breakup at high values of $Ca$.

Figure 12. Time evolution of the droplet shapes at (a) $Ca = 0.005$ and (b) $Ca = 0.03$ for the clean (top row) and surfactant-contaminated systems (bottom row).

Figure 13 presents the time evolution of the dimensionless neck thickness ${\delta ^\ast }$ at different values of $Ca$ for (a) the clean and (b) surfactant-contaminated systems. At the smallest capillary number, i.e. $Ca = 0.005$, the value of ${\delta ^\ast }$ remains approximately 1 in the clean system, but decreases to 0 in the surfactant-contaminated system. We also note that the breakup time of the droplet neck, i.e. the time when ${\delta ^\ast }$ decreases to 0, occurs earlier in the surfactant-contaminated system than that in the clean system at the same $Ca$. These phenomena indicate that the presence of surfactants promotes the droplet breakup. In both the clean and surfactant-contaminated systems, the curves of ${\delta ^\ast }$ varying with ${t^\ast }$ gradually coincide as $Ca$ increases. It also can be observed in the surfactant-contaminated system that the curves of ${\delta ^\ast }$ with ${t^\ast }$ nearly coincide when $Ca \ge 0.02$ (figure 12b).

Figure 13. Dimensionless neck thickness ${\delta ^\ast }$ as a function of the dimensionless time ${t^\ast }$ at different capillary numbers for the (a) clean and (b) surfactant-contaminated systems.

The degree of blockage of the droplet to the branch channels is described by the time evolution of the dimensionless droplet length $l_d^\ast $ under different values of the capillary number $Ca$, as shown in Figure 14. In the figure, the straight lines represent the fitting lines. For the clean system (figure 14a), $l_d^\ast $ increases linearly with ${t^\ast }$ when $Ca \ge 0.02$, and the slopes of the fitting lines are 0.9438, 1.0989 and 1.1690 for $Ca = 0.02$, 0.025 and 0.03, respectively. For the surfactant-contaminated system (figure 14b), $l_d^\ast $ increases linearly with ${t^\ast }$ when $Ca \ge 0.01$, and the slopes of the fitting lines are 1.0690, 1.1861, 1.2594, 1.2812 and 1.3095 for $Ca = 0.01$, 0.015, 0.02, 0.025 and 0.03, respectively. In both the clean and surfactant-contaminated systems, the slope of the fitting line gradually increases as $Ca$ increases, and the rate of increase in the fitting line slope decreases as $Ca$ increases. This indicates that the ratio of the maximum droplet area to the branch channel area in the yz plane ($\alpha $) decreases as $Ca$ increases, and the rate of decrease in $\alpha $ decreases as $Ca$ increases. As $Ca$ increases, the fitting lines gradually approach each other in both the clean and surfactant-contaminated systems, suggesting that $\alpha $ tends towards a certain value. Consequently, the curves of ${\delta ^\ast }$ varying with ${t^\ast }$ gradually approach each other as $Ca$ increases in the two systems (figure 13a,b). Moreover, in the surfactant-contaminated system, the values of $l_d^\ast $ are almost equal when $Ca \ge 0.02$, thus causing the curves of ${\delta ^\ast }$ varying with ${t^\ast }$ to coincide when $Ca \ge 0.02$ (figure 13b).

Figure 14. Time evolution of the dimensionless droplet length $l_d^\ast $ under different capillary numbers Ca for the (a) clean and (b) surfactant-contaminated systems.

When the branch channels are completely blocked by the droplet, the dimensionless droplet length $l_d^\ast $ increases linearly with the dimensionless time ${t^\ast }$ (figure 14), such that the two formulas could be found to predict the variation of $l_d^\ast $ with ${t^\ast }$ in both the clean and surfactant-contaminated systems. Figure 15 presents the plots of the slopes of the fitting lines ($K$) as a function of the capillary number $Ca$ when the branch channels are completely blocked by the droplet for the two systems, where the red dashed and black solid lines indicate the fitting lines. The expressions of the fitting lines are $K = 1.2268 - 6.7823 \times {\textrm{e}^{ - {t^\ast }/0.0063}}$ and $K = 1.3288 - 0.8952 \times {\textrm{e}^{ - {t^\ast }/0.0081}}$ for the clean and surfactant-contaminated systems, respectively. This indicates that the dimensionless droplet length can be predicted by $l_d^\ast= l_{d0}^\ast+ K{t^\ast }$, where $l_{d0}^\ast= 2.4$ and $K = 1.2268 - 6.7823 \times {\textrm{e}^{ - {t^\ast }/0.0063}}$ for the clean system, while $l_{d0}^\ast= 2.45$ and $K = 1.3288 - 0.8952 \times {\textrm{e}^{ - {t^\ast }/0.0081}}$ for the surfactant-contaminated system. We also note that the values of K are greater in the surfactant-contaminated system than that in the clean system at the same $Ca$. At a fixed value of $Ca$, the accumulation of surfactants at the droplet tips causes the droplet to deform, which promotes the flow of the droplet in the region of low resistance, i.e. in the region away from the microchannel wall. Therefore, the droplet length increases faster in the surfactant-contaminated system than that in the clean system.

Figure 15. Slopes of the fitting lines ($K$) as a function of the capillary number Ca for both the clean and surfactant-contaminated systems. The solid black and dashed red lines represent the fitting lines for the clean and surfactant-contaminated systems, respectively.

Figure 16 presents the evolution of the neck breakup time $t_{break}^\ast $ with the capillary number $Ca$ for both the clean and surfactant-contaminated systems. In the clean system (${\psi _b} = 0$), $t_{break}^\ast $ decreases monotonically as $Ca$ increases. As $Ca$ increases, the inertial effect increases, which intensifies the compression of the injected fluid on the droplet neck, resulting in a reduced breakup time. In the surfactant-contaminated system (${\psi _b} = 0.1$), $t_{break}^\ast $ first monotonically decreases and then remains nearly unchanged as $Ca$ increases. The reason for the former decrease is the same as that described in the case of the clean system. The later near-constant value of $t_{break}^\ast $ when $Ca \ge 0.02$ can be explained as follows: as $Ca$ increases, the surfactants absorbed at the droplet interface are significantly diluted, which is because the deformation rate of the droplet interface increases (see the comparison of figure 12a,b). Thus, $t_{break}^\ast $ increases because the surfactant effect is weakened. Moreover, the inertial effect increases as $Ca$ increases, which causes $t_{break}^\ast $ to decrease. As a result, the two opposite effects cause $t_{break}^\ast $ to remain almost constant. With an increase in $Ca$, the difference in $t_{break}^\ast $ between the clean and surfactant-contaminated systems gradually decreases. As $Ca$ increases, the inertial effect gradually increases, and the surfactant role is thus correspondingly weakened.

Figure 16. Breakup time of the droplet neck ($t_{break}^\ast $) as a function of the capillary number $Ca$ for both the clean and surfactant-contaminated systems.

5.2. Asymmetric boundary condition

This subsection presents an examination of the effect of surfactants on a droplet flowing through a T-junction microchannel under asymmetric boundary conditions ($P_1^\ast \ne P_2^\ast $), where the surfactant role is determined by comparing the droplet morphology, volume ratio of the generated daughter droplets (${V_1}/{V_2}$) and dimensionless breakup time of the droplet neck ($t_{break}^\ast $) under different values of the dimensionless pressure difference $\Delta {P^\ast }$ and bulk surfactant concentration ${\psi _b}$.

5.2.1. Effect of pressure difference

The effect of the surfactants on the droplet flowing through a T-junction microchannel under different values of pressure difference $\Delta {P^\ast }$ is investigated by increasing $\Delta {P^\ast }$ from 0 to $3.33 \times {10^{ - 3}}$. Different values of $\Delta {P^\ast }$ are obtained on decreasing the pressure applied at the right branch outlet, while maintaining the pressure applied at the left branch outlet at a constant. Figure 17 presents the time evolution of the droplet shape at (a) $\Delta {P^\ast } = 1 \times {10^{ - 6}}$, (b) $\Delta {P^\ast } = 3.33 \times {10^{ - 6}}$ and (c) $\Delta {P^\ast } = 1 \times {10^{ - 3}}$ for the clean (top row) and surfactant-contaminated systems (bottom row). At $\Delta {P^\ast } = 1 \times {10^{ - 6}}$ (figure 17a), the clean and surfactant-contaminated droplets both break up into two daughter droplets of similar volumes. The breakup time of the droplet neck is smaller in the surfactant-contaminated system than that in the clean system. We also note that the droplet length appears to be larger in the surfactant-contaminated system than that in the clean system. When the pressure difference is increased to $\Delta {P^\ast } = 3.33 \times {10^{ - 6}}$ (figure 17b), the clean droplet asymmetrically breaks up into two daughter droplets with unequal volumes (shown in the top row), while the surfactant-contaminated droplet still breaks up into two daughter droplets with similar volumes (see the bottom row). The surfactant-contaminated droplet breaks up earlier than the clean droplet. As in the case of $\Delta {P^\ast } = 1 \times {10^{ - 6}}$, the length of the surfactant-contaminated droplet is also greater than that of the clean droplet. Upon further increasing $\Delta {P^\ast }$ to $1 \times {10^{ - 3}}$ (figure 17c), the clean droplet completely enters the right branch channel without any breakup (top row of figure 17c), while the surfactant-contaminated droplet breaks up into two daughter droplets of unequal volumes (bottom row of figure 17c). These phenomena indicate that the presence of surfactants not only decreases the droplet breakup time, but also promotes the droplet to break up under asymmetric boundary condition.

Figure 17. Snapshots of the droplet flowing through a T-junction microchannel at (a) $\Delta {P^\ast } = 1 \times {10^{ - 6}}$, (b) $\Delta {P^\ast } = 3.33 \times {10^{ - 6}}$ and (c) $\Delta {P^\ast } = 1 \times {10^{ - 3}}$ for the clean (top row) and surfactant-contaminated systems (bottom row). The other parameters are considered as $Ca = 0.01$, $l_0^\ast= 1.5$ and ${\psi _b} = 0.1$.

Figure 18 presents the volume ratio of the two daughter droplets (${V_1}/{V_2}$) as a function of the dimensionless pressure difference $\Delta {P^\ast }$ for the clean (solid lines with square symbols) and surfactant-contaminated system (dashed line with circle symbols). It should be noted that ${V_1}/{V_2} = 0$ and 1 respectively indicate that the droplet flows entirely through the right branch channel and that the volumes of the two daughter droplets are identical. In both the clean and surfactant-contaminated systems, ${V_1}/{V_2}$ monotonically decreases to zero as $\Delta {P^\ast }$ increases, and this rate of decrease is higher in the clean system. This indicates that the presence of surfactants could decrease the pressure difference between the droplet tips. In the range of $\Delta {P^\ast }$ varying from $1 \times {10^{ - 6}}$ to $1 \times {10^{ - 4}}$, the value of ${V_1}/{V_2}$ is closer to 1 in the surfactant-contaminated system than that in the clean system at the same value of $\Delta {P^\ast }$. This means that the presence of surfactants could promote the breakup of the droplets into two daughter droplets of equal volume. In the surfactant-contaminated system, the value of ${V_1}/{V_2}$ also decreases to 0 at $\Delta {P^\ast } = 1.67 \times {10^{ - 3}}$, suggesting that the effect of surfactants on the asymmetric droplet breakup is negligible.

Figure 18. Volume ratio of the two daughter droplets (${V_1}/{V_2}$) as a function of the dimensionless pressure difference $\Delta {P^\ast }$ for the clean and surfactant-contaminated systems.

To elucidate the effect of surfactants on the droplet asymmetric breakup under asymmetric boundary conditions, figure 19 presents the plots of the effects of the Marangoni stresses (${F_{M1}}$ and ${F_{M2}}$) and additional viscous drag stresses (${F_{v1}}$ and ${F_{v2}}$) on the neck contraction process. As shown in this figure, the blockage degree of the right branch channel is more serious than that of the left branch channel, which is due to the lower pressure applied at the right branch outlet. This causes more continuous fluid to flow through the left branch channel, which results in a higher flow rate near the droplet bottom interface in the left branch channel than that near the droplet bottom interface in the right branch channel (top row of figure 22). In the presence of surfactants, the continuous fluid sweeps more surfactants towards the left side of the droplet bottom interface, which causes more surfactants to accumulate at the left side of the droplet bottom interface (bottom row of figure 22). Meanwhile, the surfactant concentration at the left side of the droplet bottom interface is more uneven than that at the right side of the droplet bottom interface, which is due to the higher flow rate near the droplet bottom interface in the left branch channel. This causes the Marangoni stress generated at the left side of the droplet bottom interface ${F_{M1}}$ to be greater than that generated at the right side of the droplet bottom interface ${F_{M2}}$, i.e. ${F_{M1}} > {F_{M2}}$. To balance the Marangoni stresses, two viscous drag stresses, i.e. ${F_{v1}}$ and ${F_{v2}}$, are induced, and they act at the droplet interface in the direction opposite to that of the Marangoni stresses (dashed arrows). Obviously, ${F_{v1}}$ and ${F_{v2}}$ cause the droplet interface to stretch towards both sides of the droplet tips. As ${F_{v1}} > {F_{v2}}$, the droplet interface is more inclined to deform towards the left branch channel outlet, and it is more difficult for the right branch channel to be blocked by the droplet. Meanwhile, owing to the adsorption of surfactants at the droplet interface, the interfacial tension is reduced, thus making it easier for the droplet to deform and reducing the overall blockage of the microchannel. The two aforementioned factors facilitate the decrease in the pressure difference between the droplet tips, which is helpful for generating daughter droplets of equal volume.

Figure 19. Schematic of surfactant-contaminated droplet passing through a T-junction microchannel in the xz middle plane under asymmetric boundary conditions.

Figure 20 presents the velocity vectors and distribution of the shear stress ${\tau _{zx}}$ in the xz middle plane at ${t^\ast } = 0.4938$ for the (a) clean and (b) surfactant-contaminated systems. In the clean system (figure 20a), a strong shear stress acts on the lower left side of the droplet tip. This creates a vortex on the left side of the droplet, which promotes the droplet flow to the right-branch channel. However, in the surfactant-contaminated system (figure 20b), there are two regions comprising high shear stress near the lower droplet interface (two regions indicated by white dashed lines). The shear stress in region I is higher than that in region II, which stretches the droplet interface towards the left branch channel and facilitates the breakup of the droplet into two daughter droplets of equal volume.

Figure 20. Velocity vectors and the distribution of the shear stress ${\tau _{zx}}$ in the xz middle plane at ${t^\ast } = 0.4938$ for the (a) clean and (b) surfactant-contaminated systems. The black and red curves indicate the clean and surfactant-contaminated droplet interfaces, respectively. The other parameters considered are $Ca = 0.01$, ${\psi _b} = 0.1$, $l_0^\ast= 1.5$ and $\Delta {P^\ast } = {10^{ - 3}}$.

Figure 21 presents the variation in the droplet breakup time $t_{break}^\ast $ with the pressure difference $\Delta {P^\ast }$ for both the clean and surfactant-contaminated systems. In the clean system (indicated by the solid line with square symbols), $t_{break}^\ast $ increases as $\Delta {P^\ast }$ increases from $1 \times {10^{ - 6}}$ to $3.33 \times {10^{ - 6}}$. When $\Delta {P^\ast }$ is increased to $3.33 \times {10^{ - 6}}$, a broader tunnel is formed between the droplet interface and the left branch channel wall (a comparison between the two top rows is presented in figure 17a,b), which facilitates the flow of the continuous fluid. This alleviates the compression of the continuous fluid at the droplet neck, thus making it more difficult for the neck to break. In the surfactant-contaminated system (indicated by dashed lines with circles), $t_{break}^\ast $ initially remains almost constant and then increases as $\Delta {P^\ast }$ increases. As $\Delta {P^\ast }$ increases from $1 \times {10^{ - 6}}$ to $1 \times {10^{ - 4}}$, the droplet breaks up almost symmetrically, i.e. the value of ${V_1}/{V_2}$ is close to 1 (figure 18); therefore, the values of $t_{break}^\ast $ are close to the value of $t_{break}^\ast $ at the same simulation parameters under symmetric boundary conditions. The reason for the latter increase is the same as that in the case of the clean system. At the same $\Delta {P^\ast }$, $t_{break}^\ast $ is smaller in the surfactant-contaminated system than that in the clean system. The corresponding reasons are presented in figure 11.

Figure 21. Dimensionless breakup time of the droplet neck ($t_{break}^\ast $) as a function of the dimensionless pressure difference $\Delta {P^\ast }$ for both the clean and surfactant-contaminated systems.

Figure 22 presents the distributions of the velocity magnitude (top row) and surfactant concentration (bottom row) at three typical ${t^\ast }$ values, where the pressure difference is fixed at $\Delta {P^\ast } = 1 \times {10^{ - 3}}$. At ${t^\ast } = 0.4938$, the droplet enters the right branch channel (top row of figure 22), which is because the pressure applied at the right branch outlet is lower. Accordingly, the tunnel between the droplet interface and channel wall is broader in the left branch channel than that in the right branch channel, and the position of the droplet neck deviates from the left branch outlet. As the blockage of the droplet to the branch channel is weaker in the left branch channel than that in the right branch channel, the magnitude of the velocity near the left side of the droplet bottom interface is larger than that near the right side of the droplet bottom interface (Chen & Deng Reference Chen and Deng2017). Therefore, more surfactants are swept to the left droplet tip, and the surfactants are more unevenly distributed at the left side of the droplet bottom interface than that at the right side (bottom row in figure 22). As ${t^\ast }$ increases to 0.9104, the non-uniformity of the surfactants at the left side of the droplet bottom interface increases (a comparison between ${t^\ast } = 0.4938$ and 0.9104 is presented), which is due to the intensive velocity magnitude near the left side of the droplet bottom interface. Upon further increasing ${t^\ast }$ to 1.3271, the droplet breaks up into two daughter droplets of unequal volume, and the corresponding value of ${V_1}/{V_2} = 1.29$ is obtained. It can also be observed that more surfactants accumulate at the droplet tips where the curvature is high.

Figure 22. Distributions of the velocity magnitude (top row) and surfactant concentration (bottom row) in the xz middle plane at three typical ${t^\ast }$ values, where the pressure difference is fixed at $\Delta {P^\ast } = 1 \times {10^{ - 3}}$. The curved black lines correspond to the droplet interface (${\rho ^N} = 0$).

5.2.2. Effect of surfactant concentration

It has been proved in the above subsection that the presence of surfactants can facilitate droplet breakup into two daughter droplets of equal volume, but the effect of the surfactant concentration on the droplet breakup under asymmetric boundary conditions is still unclear. In addition, it is well known that the excessive addition of surfactants into two-phase systems not only increases toxicity, but also increases separation costs (Sakai Reference Sakai2008; Seok et al. Reference Seok, Park, Hong, Gil, Yang, Lee, Song and Song2011; Shimokawa, Ishii & Ohshima Reference Shimokawa, Ishii and Ohshima2016); therefore, the determination of the optimal surfactant concentration while balancing the surfactant role and dosage is of great significance. In this subsection, the effect of the bulk surfactant concentration ${\psi _b}$ on a droplet flowing through a T-junction microchannel is investigated. Figure 23 presents the volume ratio of the two daughter droplets (${V_1}/{V_2}$) as a function of the bulk surfactant concentration ${\psi _b}$, where the inset figures present the shapes obtained after the droplet breaks up or flows through a branch channel. It can be observed from the figure that ${V_1}/{V_2}$ first increases rapidly as ${\psi _b}$ increases from 0.05 to 0.1, then remains almost constant as ${\psi _b}$ increases from 0.1 to 0.4 and finally decreases slightly as ${\psi _b}$ increases from 0.4 to 0.6. The former rapid increase occurs because the additional viscous drag stresses induced by the Marangoni stresses cause the droplet to break up symmetrically (figure 19). The reason for the latter being almost constant is as that, as ${\psi _b}$ increases, the amount of surfactants absorbed at the left side of the droplet bottom interface increases, thus reducing the interfacial tension. This facilitates droplet deformation and creates a wider tunnel between the left side of the droplet bottom interface and the microchannel wall. As the tunnel width increases, the fluid velocity near the left side of the droplet bottom interface decreases, which alleviates the non-uniformity of the surfactants at the droplet bottom interface. This hinders the increase in Marangoni stresses and additional viscous drag stresses, which prevents ${V_1}/{V_2}$ from increasing further. The final slight decrease can be explained as follows: as ${\psi _b}$ continuously increases, the absorbed surfactants at the droplet interface increase and reach the CMC (the bottom row of figure 25b), which decreases the interfacial tension gradient at the droplet interface. Therefore, the Marangoni stresses and additional viscous drag stresses correspondingly decrease, which weakens the effect of the surfactants on the asymmetric breakup of the droplet.

Figure 23. Volume ratio of the two daughter droplets (${V_1}/{V_2}$) as a function of the bulk surfactant concentration ${\psi _b}$, where the illustrations depict the shapes of droplet breakup or droplet flowing through one branch channel. Other parameters are fixed at $Ca = 0.01$, $l_0^\ast= 1.5$ and $\Delta {P^\ast } = 1 \times {10^{ - 3}}$.

Figure 24 presents the dimensionless droplet breakup time $t_{break}^\ast $ as a function of the bulk surfactant concentration ${\psi _b}$. It can be observed from the figure that $t_{break}^\ast $ first decreases and then increases as ${\psi _b}$ increases. The reason for the former decrease has been described. The latter increase can be explained as follows: as ${\psi _b}$ increases, the surfactants absorbed at the droplet interface increase and gradually reach the CMC (bottom rows of figure 25a,b), which weakens the Marangoni stresses and additional viscous drag stresses. As mentioned above, the additional viscous drag stresses are conducive to droplet breakup, and the weakened viscous drag stresses thus cause $t_{break}^\ast $ to increase.

Figure 24. Dimensionless breakup time of the droplet neck ($t_{break}^\ast $) as a function of the bulk surfactant concentration ${\psi _b}$.

Figure 25. Distributions of the velocity magnitude (top row) and surfactant concentration (bottom row) in the xz middle plane for different bulk surfactant concentrations ${\psi _b}$. The black curved lines correspond to the droplet interfaces.

Figure 25 presents the distributions of the velocity magnitude (top row) and surfactant concentration (bottom row) for (a) ${\psi _b} = 0.06$ and (b) ${\psi _b} = 0.6$. As ${\psi _b}$ increases from 0.06 to 0.1 (comparison between figures 22 and 25a), the amount of surfactants absorbed at the droplet interface increases, and the uneven distribution of surfactants at the left bottom interface of the droplet becomes more severe. Upon further increasing ${\psi _b}$ to 0.6 (figure 25b), the amount of surfactants absorbed at the droplet interface further increases, while the surfactants at the droplet interface become more evenly distributed. Similar phenomena have been observed in previous studies (Zhang et al. Reference Zhang, Zhang, Zhao, Liu and Jiang2022, Reference Zhang, Cui, Liu, Chen, Zhang and Li2023a). It should be noted that the CMC is reached, which is given by $\textrm{CMC} = 1 - \textrm{exp}[ - 2/(3{E_0})] = 0.74$. This means that the magnitudes of the Marangoni stresses and additional viscous drag stresses first increase and then decrease as ${\psi _b}$ increases from 0.06 to 0.6.

5.3. Phase diagram

To systematically investigate the effect of the surfactants on the asymmetric breakup of the droplet under different parameters, figure 26 presents the phase diagram describing how the volume ratio of the two daughter droplets (${V_1}/{V_2}$) varies with the bulk surfactant concentration ${\psi _b}$ and pressure difference $\Delta {P^\ast }$. In this figure, the solid and dashed red lines are the auxiliary lines, which are used to clearly represent the variations of ${V_1}/{V_2}$ with ${\psi _b}$ and $\Delta {P^\ast }$, respectively. In the absence of surfactants, a small pressure difference would not cause the droplet to break up but to enter one branch channel instead (dashed red line of ${\psi _b} = 0$). With the addition of surfactants, the value of ${V_1}/{V_2}$ first remains nearly constant as $\Delta {P^\ast }$ increases from $1 \times {10^{ - 6}}$ to $1 \times {10^{ - 4}}$ and then dramatically decreases and disappears as $\Delta {P^\ast }$ increases continuously. In the range of $\Delta {P^\ast } = 1 \times {10^{ - 6}}$ to $1 \times {10^{ - 4}}$, the value of ${V_1}/{V_2}$ rapidly increases as ${\psi _b}$ increases from 0 to 0.05 and then remains nearly constant as ${\psi _b}$ continues to increase. As $\Delta {P^\ast }$ continuously increases to $1 \times {10^{ - 3}}$, a higher value of ${\psi _b}$ is required to obtain a high value of ${V_1}/{V_2}$. However, the value of ${V_1}/{V_2}$ can only be increased to approximately 0.6, even after the addition of surfactants at a high concentration. To obtain two daughter droplets of similar volume, the optimal surfactant concentrations under different values of $\Delta {P^\ast }$ can be obtained, as shown in figure 26. It can be observed form the figure that the optimal surfactant concentration is approximately 0.05 and 0.1 in the ranges of $\Delta {P^\ast } = 1 \times {10^{ - 6}}$ to $1 \times {10^{ - 4}}$ and $\Delta {P^\ast } = 1 \times {10^{ - 3}}$, respectively.

Figure 26. Effects of the bulk surfactant concentration ${\psi _b}$ and pressure difference $\Delta {P^\ast }$ on the volume ratio of daughter droplets (${V_1}/{V_2}$). The solid and dashed red lines indicate the auxiliary lines used to clearly represent the variation in ${V_1}/{V_2}$ with ${\psi _b}$ and $\Delta {P^\ast }$, respectively.

6. Conclusions

In this study, the flow of a surfactant-contaminated droplet in a T-junction microchannel is simulated using our recently developed LB method (Zhang et al. Reference Zhang, Cui, Liu, Chen, Zhang and Li2023a). We first studied the effect of the surfactants on the droplet breakup at different values of the dimensionless initial droplet length $l_0^\ast $ and capillary number $Ca$ under symmetric boundary conditions. At small and moderate $l_0^\ast $ values, the branch channels are partially blocked by the droplet, and the surfactants are unevenly distributed at the droplet interface owing to the flow of continuous fluid in the tunnel between the droplet bottom interface and the microchannel wall. Additional viscous drag stresses are induced to balance the Marangoni stresses, which promote the droplet deformation and breakup. However, at large $l_0^\ast $ values, the branch channels are completely blocked by the droplet, and the neck contraction process is determined by the injection rate of the continuous fluid; thus, the surfactant effect is significantly weakened. When the branch channels are completely blocked by the droplet, the dimensionless droplet length $l_d^\ast $ increases linearly with the dimensionless time ${t^\ast }$, and the rate of increase depends on the injection rate of the continuous fluid (quantified by $Ca$) and the ratio of the maximum droplet area to the channel area in the yz plane ($\alpha $). Based on this, two formulas are developed to predict the evolution of $l_d^\ast $ with ${t^\ast }$ for both the clean and surfactant-contaminated systems. At a fixed $Ca$, the increasing rate of $l_d^\ast $ is higher in the surfactant-contaminated system than in the clean system because of the smaller value of $\alpha $ in the surfactant-contaminated system.

We then studied the effect of the surfactants on droplet breakup under different values of pressure difference $\Delta {P^\ast }$ and bulk surfactant concentration ${\psi _b}$ under asymmetric boundary conditions. As $\Delta {P^\ast }$ increases, the volume ratio of the generated droplets (${V_1}/{V_2}$) decreases to zero in both systems, whereas this rate of decrease is lower in the surfactant-contaminated system. The presence of surfactants decreases the interfacial tension and generates asymmetric Marangoni stresses, which are conducive to reducing the overall blockage of the microchannels. Therefore, the pressure difference between the droplet tips decreases, which is helpful for generating daughter droplets of equal volume. Under the influence of $\Delta {P^\ast }$, the droplet deforms asymmetrically at the T-junction, and the velocity magnitudes near the left and right sides of the bottom interface of the droplet are different. Two unequal Marangoni stresses and two additional unequal viscous drag stresses are asymmetrically generated at the left and right sides of the droplet bottom interface, which prevent the asymmetric deformation and breakup of the droplet interface. As ${\psi _b}$ increases, ${V_1}/{V_2}$ first increases rapidly, then remains constant and finally decreases slightly.

Finally, we establish a phase diagram to describe how ${V_1}/{V_2}$ varies with $\Delta {P^\ast }$ and ${\psi _b}$. In the range of $\Delta {P^\ast } = 1 \times {10^{ - 6}}$ to $1 \times {10^{ - 4}}$, ${V_1}/{V_2}$ increases rapidly as ${\psi _b}$ increases from 0 to 0.05 and then remains nearly constant as ${\psi _b}$ continues to increase. As $\Delta {P^\ast }$ increases continuously to $1 \times {10^{ - 3}}$, a higher value of ${\psi _b}$ is required to obtain a high ${V_1}/{V_2}$ value. However, the value of ${V_1}/{V_2}$ can only be increased to approximately 0.6 even after the addition of surfactants at a high concentration.

It is worth noting that the droplet elongation is attributed to two factors, i.e. the drainage of the fluid inside the neck towards the droplet tips and the enhanced shear stresses due to the presence of surfactants. Thus, in our future research, we intend to develop an appropriate method of determining the contribution of the two aforementioned factors. In addition, we intend to adopt a grid refinement technique (Chen et al. Reference Chen, Filippova, Hoch, Molvig, Shock, Teixeira and Zhang2006; Geier, Greiner & Korvink Reference Geier, Greiner and Korvink2009; Huang & Wu Reference Huang and Wu2016) to accurately capture the evolution of the droplet neck in the fracture stage.

Funding

The authors acknowledge the financial support provided by the National Natural Science Foundation of China (no. 52306202).

Declaration of interests

The authors report no conflict of interest.

Appendix. Effects of surface wettability and aspect ratio ($\chi = W/H$)

The effect of contact angle ${\theta _0}$ on a droplet flowing through a T-junction device is studied. Figure 27 presents the temporal evolution of the droplet interface (${\rho ^N} = 0$) at (a) ${\theta _0} = 0$, (b) ${\theta _0} = {\rm \pi}/6$ and (c) ${\theta _0} = {\rm \pi}/2$ for the clean (top row) and surfactant-contaminated systems (bottom row). The other parameters considered are $Ca = 0.01$, $l_0^\ast= 1.5$, ${\psi _b} = 0.1$ and $\Delta {P^\ast } = 3.33 \times {10^{ - 6}}$. For ${\theta _0} = 0$ (figure 27a), the clean droplet breaks up into two daughter droplets of different volumes, while the surfactant-contaminated droplet breaks up into two daughter droplets of similar volumes. We also observe that the breakup of the droplet neck occurs earlier in the surfactant-contaminated system than in the clean system. When ${\theta _0}$ is increased to ${\rm \pi} /6$ (figure 27b), the clean droplet is adsorbed on the microchannel wall, which alleviates the blockage of the microchannel by the droplet. Two non-uniform shear stresses are applied to the two sides of the clean droplet, and the droplet flows through the right branch channel. However, the surfactant-contaminated droplet also breaks up into two daughter droplets, which is similar to the surfactant-contaminated case at ${\theta _0} = 0$. This is because the presence of surfactants not only decreases the interfacial tension, but also reduces the contact angle for hydrophilic microchannel walls. Upon further increasing ${\theta _0}$ to ${\rm \pi} /2$ (figure 27c), the clean and surfactant-contaminated droplets completely block the microchannel and eventually break up into two daughter droplets of similar volumes.

Figure 27. Temporal evolution of the droplet interface (${\rho ^N} = 0$) at (a) ${\theta _0} = 0$, (b) ${\theta _0} = {\rm \pi}/6$ and (c) ${\theta _0} = {\rm \pi}/2$ for the clean (top row) and surfactant-contaminated systems (bottom row). The clean droplet interfaces, surfactant-contaminated droplet interfaces and microchannel walls are indicated in green, red and grey, respectively. The other parameters are $Ca = 0.01$, $l_0^\ast= 1.5$, ${\psi _b} = 0.1$ and $\Delta {P^\ast } = 3.33 \times {10^{ - 6}}$.

Figure 28 presents the volume ratio of the two daughter droplets (${V_1}/{V_2}$) as a function of the contact angle ${\theta _0}$ for the clean (squares with solid lines) and surfactant-contaminated systems (circles with dashed lines). In the surfactant-contaminated system, ${V_1}/{V_2}$ remains almost constant. However, in the clean system, ${V_1}/{V_2}$ decreases as ${\theta _0}$ increases from 0 to ${\rm \pi} /6$, while ${V_1}/{V_2}$ increases as ${\theta _0}$ increases from${\rm \pi} /4$ to ${\rm \pi} /2$.

Figure 28. Effect of contact angle ${\theta _0}$ on the volume ratio of the two daughter droplets (${V_1}/{V_2}$) for both the clean (${\psi _b} = 0$) and surfactant-contaminated systems (${\psi _b} = 0.1$). The other parameters are fixed at $Ca = 0.01$, $l_0^\ast= 1.5$, ${\psi _b} = 0.1$ and $\Delta {P^\ast } = 3.33 \times {10^{ - 6}}$.

Figure 29 presents the effect of the aspect ratio $\chi $ ($\chi = W/H$) on the volume ratio of the two daughter droplets (${V_1}/{V_2}$), where four different values of $\chi $, that is $\chi = 0.75$, 1, 1.5 and 3, were studied. In the surfactant-contaminated system (circles with dashed lines), ${V_1}/{V_2}$ remains nearly constant as $\chi $ increases. However, in the clean system (indicated by the squares with solid lines), ${V_1}/{V_2}$ increases monotonically as $\chi $ increases. This phenomenon can be explained as follows: as $\chi $ increases, the tunnel between the droplet interface and the microchannel wall is reduced, and the non-uniform shear stresses acting on both sides of the droplet interface are weakened, thus causing the droplet to break up symmetrically.

Figure 29. Volume ratio of the two daughter droplets (${V_1}/{V_2}$) as a function of the aspect ratio $\chi $ ($\chi = W/H$). The illustrations show the droplet shapes; the interfaces of the clean and surfactant-contaminated droplets are indicated in green and red, respectively. The other parameters considered are $Ca = 0.01$, $l_0^\ast= 1.5$ and $\Delta {P^\ast } = 1 \times {10^{ - 5}}$.

References

Akai, T., Bijeljic, B. & Blunt, M.J. 2018 Wetting boundary condition for the color-gradient lattice Boltzmann method: validation with analytical and experimental data. Adv. Water Resour. 116, 5666.CrossRefGoogle Scholar
Baret, J.-C., Kleinschmidt, F., Harrak, A.E. & Griffiths, A.D. 2009 Kinetic aspects of emulsion stabilization by surfactants: a microfluidic analysis. Langmuir 25, 60886093.CrossRefGoogle ScholarPubMed
Chagot, L., Quilodrán-Casas, C., Kalli, M., Kovalchuk, N.M., Simmons, M.J.H., Matar, O.K., Arcucci, R. & Angeli, P. 2022 Surfactant-laden droplet size prediction in a flow-focusing microchannel: a data-driven approach. Lab on a Chip 22, 38483859.CrossRefGoogle Scholar
Chen, H., Filippova, O., Hoch, J., Molvig, K., Shock, R., Teixeira, C. & Zhang, R. 2006 Grid refinement in lattice Boltzmann methods based on volumetric formulation. Physica A 362, 158167.CrossRefGoogle Scholar
Chen, X., Xue, C. & Hu, G. 2019 Confinements regulate capillary instabilities of fluid threads. J. Fluid Mech. 873, 816834.CrossRefGoogle Scholar
Chen, Y. & Deng, Z. 2017 Hydrodynamics of a droplet passing through a microfluidic T-junction. J. Fluid Mech. 819, 401434.CrossRefGoogle Scholar
Fu, T., Ma, Y. & Li, H.Z. 2014 Hydrodynamic feedback on bubble breakup at a T-junction within an asymmetric loop. AIChE J. 60, 19201929.CrossRefGoogle Scholar
Geier, M., Greiner, A. & Korvink, J.G. 2009 Bubble functions for the lattice Boltzmann method and their application to grid refinement. Eur. Phys. J. 171, 173179.Google Scholar
Gimondi, S., Ferreira, H., Reis, R.L. & Neves, N.M. 2023 Microfluidic devices: a tool for nanoparticle synthesis and performance evaluation. ACS Nano 17, 1420514225.CrossRefGoogle ScholarPubMed
Giuffrida, M.C., Cigliana, G. & Spoto, G. 2018 Ultrasensitive detection of lysozyme in droplet-based microfluidic devices. Biosens. Bioelectr. 104, 814.CrossRefGoogle ScholarPubMed
Hafen, N., Thieringer, J.R.D., Meyer, J., Krause, M.J. & Dittler, A. 2023 Numerical investigation of detachment and transport of particulate structures in wall-flow filters using lattice Boltzmann methods. J. Fluid Mech. 956, A30.CrossRefGoogle Scholar
Hoang, D.A., Haringa, C., Portela, L.M., Kreutzer, M.T., Kleijn, C.R. & van Steijn, V. 2014 Design and characterization of bubble-splitting distributor for scaled-out multiphase microreactors. Chem. Engng J. 236, 545554.CrossRefGoogle Scholar
Hoang, D.A., Portela, L.M., Kleijn, C.R., Kreutzer, M.T. & van Steijn, V. 2013 Dynamics of droplet breakup in a T-junction. J. Fluid Mech. 717, R4.CrossRefGoogle Scholar
Huang, R. & Wu, H. 2016 Total enthalpy-based lattice Boltzmann method with adaptive mesh refinement for solid-liquid phase change. J. Fluid Mech. 315, 6583.Google Scholar
Jiang, F., Yang, J., Boek, E. & Tsuji, T. 2021 Investigation of viscous coupling effects in three-phase flow by lattice Boltzmann direct simulation and machine learning technique. Adv. Water Resour. 147, 103797.CrossRefGoogle Scholar
Kalli, M. & Angeli, P. 2022 Effect of surfactants on drop formation flow patterns in a flow-focusing microchannel. Chem. Engng J. 253, 117517.Google Scholar
Leshansky, A.M., Afkhami, S., Jullien, M.C. & Tabeling, P. 2012 Obstructed breakup of slender drops in a microfluidic T junction. Phys. Rev. Lett. 108, 264502.CrossRefGoogle Scholar
Leshansky, A.M. & Pismen, L.M. 2009 Breakup of drops in a microfluidic T junction. Phys. Fluids 21, 023303.CrossRefGoogle Scholar
Liang, H., Shi, B.C., Guo, Z. & Chai, Z.H. 2014 Phase-field-based multiple-relaxation-time lattice Boltzmann model for incompressible multiphase flows. Phys. Rev. E 89, 053320.CrossRefGoogle ScholarPubMed
Liu, H., Ba, Y., Wu, L., Li, Z., Xi, G. & Zhang, Y. 2018 A hybrid lattice Boltzmann and finite difference method for droplet dynamics with insoluble surfactants. J. Fluid Mech. 837, 381412.CrossRefGoogle Scholar
Liu, H., Zhang, J., Ba, Y., Wang, N. & Wu, L. 2020 Modelling a surfactant-covered droplet on a solid surface in three-dimensional shear flow. J. Fluid Mech. 897, A33.CrossRefGoogle Scholar
Nix, C., Ghassemi, M., Crommen, J. & Fillet, M. 2022 Overview on microfluidics devices for monitoring brain disorder biomarkers. Trends Anal. Chem. 155, 116693.CrossRefGoogle Scholar
Pan, K.-L., Tseng, Y.-H., Chen, J.-C., Huang, K.-L., Wang, C.-H. & Lai, M.-C. 2016 Controlling droplet bouncing and coalescence with surfactant. J. Fluid Mech. 799, 603636.CrossRefGoogle Scholar
Plateau, J. 1873 Experimental and Theoretical Steady State of Liquids Subjected to Nothing but Molecular Forces. Gauthiers-Villars.Google Scholar
Rayleigh, L. 1878 On the instability of jets. Proc. Lond. Math. Soc. 10, 413.CrossRefGoogle Scholar
Riaud, A., Zhang, H., Wang, X., Wang, K. & Luo, G. 2018 Nemerical study of surfactant dynamics during emulsification in a T-junction microchannel. Langmuir 34, 49804990.CrossRefGoogle Scholar
Sakai, T. 2008 Surfactant-free emulsions. Curr. Opin. Colloid Interface Sci. 13, 228235.CrossRefGoogle Scholar
Samie, M., Salari, A. & Shafii, M.B. 2013 Breakup of microdroplets in asymmetric T junctions. Phys. Rev. E 87, 053003.CrossRefGoogle ScholarPubMed
Seok, S.-J., Park, J.-S., Hong, J.-R., Gil, H.-W., Yang, J.-O., Lee, E.-Y., Song, H.-Y. & Song, S.-Y. 2011 Surfactant volume is an essential element in human toxicity in acute glyphosate herbicide intoxication. Clin. Toxicol. 49, 892899.CrossRefGoogle ScholarPubMed
Sharma, B. & Sharma, A. 2022 Microfluidics: recent advances toward lab-on-chip applications in bioanalysis. Adv. Engng Mater. 24, 2100738.CrossRefGoogle Scholar
Shimokawa, K., Ishii, F. & Ohshima, H. 2016 Physicochemical properties and clinical applications of surfactant-free emulsions prepared with electrolytic reduction ion water (Eri). In Encyclopedia of Biocolloid and Biointerface Science 2V Set, pp. 451458. John Wiley & Sons.CrossRefGoogle Scholar
Soligo, G., Roccon, A. & Soldati, A. 2019 Coalescence of surfactant-laden drops by phase field method. J. Fluid Mech. 376, 12921311.Google Scholar
Soligo, G., Roccon, A. & Soldati, A. 2020 Deformation of clean and surfactant-laden droplets in shear flow. Meccanica 55, 371386.CrossRefGoogle Scholar
Stone, H.A., Bentley, B.J. & Leal, L.G. 1986 An experimental study of transient effects in the breakup of viscous drops. J. Fluid Mech. 173, 131158.CrossRefGoogle Scholar
Sun, G., Qu, L., Azi, F., Liu, Y., Li, J., Lv, X., Du, G., Chen, J., Chen, C.-H. & Liu, L. 2023 Recent progress in high-throughput droplet screening and sorting for bioanalysis. Biosens. Bioelectr. 225, 115107.CrossRefGoogle ScholarPubMed
Sun, X., Zhu, C., Fu, T., Ma, Y. & Li, H.Z. 2019 Breakup dynamics of elastic droplet and stretching of polymeric filament in a T-junction. Chem. Engng Sci. 206, 212223.CrossRefGoogle Scholar
Verma, N. & Pandya, A. 2022 Challenges and opportunities in micro/nanofluidic and lab-on-a-chip. Prog. Mol. Biol. Transl. Sci. 186, 289302.CrossRefGoogle ScholarPubMed
Wang, N., Liu, H. & Zhang, C. 2016 Three-dimensional phase-field lattice Boltzmann model for incompressible multiphase flows. J. Comput. Sci. 17, 340356.CrossRefGoogle Scholar
Wang, X., Zhu, C., Wu, Y., Fu, T. & Ma, Y. 2015 Dynamics of bubble breakup with partly obstruction in a microfluidic T-junction. Chem. Engng Sci. 132, 128138.CrossRefGoogle Scholar
Wei, B., Huang, H., Hou, J. & Sukop, M.C. 2018 Study on the meniscus-induced motion of droplets and bubbles by a three-phase lattice Boltzmann model. Chem. Engng Sci. 176, 3549.CrossRefGoogle Scholar
Whitesides, G.M. 2006 The origins and the future of microfluidics. Nature 442, 368373.CrossRefGoogle ScholarPubMed
Xu, R., Cheng, Y., Li, X., Zhang, Z., Zhu, M., Qi, X., Chen, L. & Han, L. 2022 Aptamer-based signal amplification strategies coupled with microchips for high-sensitivity bioanalytical applications: a review. Anal. Chim. Acta 1209, 339893.CrossRefGoogle ScholarPubMed
Xu, Z., Liu, H. & Valocchi, A.J. 2017 Lattice Boltzmann simulation of immiscible two-phase flow with capillary valve effect in porous media. Water Resour. Res. 53, 37703790.CrossRefGoogle Scholar
Yao, F., Zhu, P., Chen, J., Li, S., Sun, B., Li, Y., Zou, M., Qi, X., Liang, P. & Chen, Q. 2023 Synthesis of nanoparticles via microfluidic devices and integrated applications. Microchim. Acta 190, 121.CrossRefGoogle ScholarPubMed
Yu, Z. & Fan, L.-S. 2010 Multirelaxation-time interaction-potential-based lattice Boltzmann model for two-phase flow. Phys. Rev. E 82, 046708.CrossRefGoogle ScholarPubMed
Zhang, J., Cui, H., Liu, H., Chen, L., Zhang, X. & Li, C. 2023 a The surfactant role on a droplet passing through a constricted microchannel in a pressure-driven flow: a lattice Boltzmann study. Langmuir 39, 1373513747.CrossRefGoogle Scholar
Zhang, J., Liu, H. & Ba, Y. 2019 Numerical study of droplet dynamics on a solid surface with insoluble surfactants. Langmuir 35, 78587870.CrossRefGoogle ScholarPubMed
Zhang, J., Liu, H., Wei, B., Hou, J. & Jiang, F. 2021 a Pore-scale modeling of two-phase flows with soluble surfactants in porous media. Energy Fuels 35, 1937419388.CrossRefGoogle Scholar
Zhang, J., Liu, H. & Zhang, X. 2021 b Modeling the deformation of a surfactant-covered droplet under the combined influence of electric field and shear flow. Phys. Fluids 33, 042109.CrossRefGoogle Scholar
Zhang, J., Shen, H., Cui, H., Chen, L. & Chen, L.G. 2023 b The dynamic behavior of a self-propelled droplet on a conical fiber: a lattice Boltzmann study. Phys. Fluids 35, 082119.CrossRefGoogle Scholar
Zhang, J., Zhang, X., Zhao, W., Liu, H. & Jiang, Y. 2022 Effect of surfactants on droplet generation in a microfluidic T-junction: a lattice Boltzmann study. Phys. Fluids 34, 042121.CrossRefGoogle Scholar
Zhu, P. & Wang, L. 2017 Passive and active droplet generation with microfluidics: a review. Lab on a Chip 17, 3475.CrossRefGoogle Scholar
Zong, Y., Zhang, C., Liang, H., Wang, L. & Xu, J. 2020 Modeling surfactant-laden droplet dynamics by lattice Boltzmann method. Phys. Fluids 32, 122105.CrossRefGoogle Scholar
Zou, L., Huang, B., Zheng, X., Pan, H., Zhang, Q., Xie, W., Zhao, Z. & Li, X. 2022 Microfluidic synthesis of magnetic nanoparticles in droplet-based microreactors. Mater. Chem. Phys. 276, 125384.CrossRefGoogle Scholar
Figure 0

Figure 1. Diagram of the surfactant-contaminated droplet breakup in a T-junction microchannel, where the droplet interface and microchannel wall are indicated in green and grey, respectively. The constant velocity ${u_{in}}$ is imposed at the bottom inlet, while the constant pressures ${P_1}$ and ${P_2}$ are respectively imposed at the left and right branch outlets, respectively.

Figure 1

Figure 2. Time evolution of dimensionless neck thickness ${\delta ^\ast }$ at three different grid resolutions for clean system (${\psi _b} = 0$). The dimensionless neck thickness and time are defined as ${\delta ^\ast } = \delta /W$ and ${t^\ast } = Ca\,{\sigma _0}t/{\mu ^R}W$, respectively. The black triangles, red circles and blue squares correspond to the mesh sizes of $W = 20$, 30 and 40 lattices, respectively. The other parameters are fixed at $Ca = 0.01$, $l_0^\ast= 3.5$ and $\Delta {P^\ast } = 0$.

Figure 2

Figure 3. Time evolution of dimensionless neck thickness ${\delta ^\ast }$ at three grid resolutions for a surfactant-contaminated system (${\psi _b} = 0.1$). The black triangles, red circles and blue squares correspond to the mesh sizes of $W = 20$, 30 and 40 lattices, respectively. The other parameters are fixed at $Ca = 0.01$, $l_0^\ast= 3.5$ and $\Delta {P^\ast } = 0$.

Figure 3

Figure 4. Temporal evolution of the droplet interface (${\rho ^N} = 0$) at (a) $l_0^\ast= 3.5$, (b) $l_0^\ast= 1.5$ and (c) $l_0^\ast= 1$ for the clean (top row) and surfactant-contaminated systems (bottom row), where the dimensionless time is defined as ${t^\ast } = Ca\,{\sigma _0}t/({\mu ^R}W)$. The clean droplet interface, surfactant-contaminated droplet interface and microchannel wall are indicated green, red and grey, respectively. The other parameters are fixed at $Ca = 0.01$, ${\psi _b} = 0.1$ and $\Delta {P^\ast } = 0$.

Figure 4

Figure 5. Time evolution of the dimensionless neck thickness ${\delta ^\ast }$ under different values of the dimensionless initial droplet length $l_0^\ast $ for (a) the clean system and (b) surfactant-contaminated system, where ${\delta ^\ast }$ is defined as ${\delta ^\ast } = \delta /W$.

Figure 5

Figure 6. Evolution of the neck thickness for various initial droplet lengths for the (a) clean and (b) surfactant-contaminated systems.

Figure 6

Figure 7. Evolution of the dimensionless droplet length $l_d^\ast $ with different initial droplet lengths for (a) clean and (b) surfactant-laden systems, where $l_d^\ast $ is defined as $l_d^\ast= {l_d}/W$. The solid and dashed straight lines are auxiliary lines used to determine whether $l_d^\ast $ increases linearly with ${t^\ast }$.

Figure 7

Figure 8. Diagram of surfactant-contaminated droplet passing through T-junction microchannel in xz middle plane under symmetrical boundary conditions.

Figure 8

Figure 9. Velocity vectors and the distribution of the shear stress ${\tau _{zx}}$ in the xz middle plane at ${t^\ast } = 1.1167$ for (a) the clean and (b) surfactant-contaminated systems. The black and red curves represent the clean and surfactant-contaminated droplet interfaces, respectively. The other parameters considered are $Ca = 0.01$, ${\psi _b} = 0.1$, $l_0^\ast= 1.5$ and $\Delta {P^\ast } = 0$.

Figure 9

Figure 10. Dimensionless breakup time of the droplet neck ($t_{break}^\ast $) as a function of the dimensionless initial droplet length $l_0^\ast $ for clean (${\psi _b} = 0$) and surfactant-contaminated systems (${\psi _b} = 0.1$).

Figure 10

Figure 11. Distributions of the velocity magnitude (left column) and surfactant concentration (right column) in the xz middle plane for different dimensionless times. The dimensionless initial droplet length is considered as $l_0^\ast= 1$.

Figure 11

Figure 12. Time evolution of the droplet shapes at (a) $Ca = 0.005$ and (b) $Ca = 0.03$ for the clean (top row) and surfactant-contaminated systems (bottom row).

Figure 12

Figure 13. Dimensionless neck thickness ${\delta ^\ast }$ as a function of the dimensionless time ${t^\ast }$ at different capillary numbers for the (a) clean and (b) surfactant-contaminated systems.

Figure 13

Figure 14. Time evolution of the dimensionless droplet length $l_d^\ast $ under different capillary numbers Ca for the (a) clean and (b) surfactant-contaminated systems.

Figure 14

Figure 15. Slopes of the fitting lines ($K$) as a function of the capillary number Ca for both the clean and surfactant-contaminated systems. The solid black and dashed red lines represent the fitting lines for the clean and surfactant-contaminated systems, respectively.

Figure 15

Figure 16. Breakup time of the droplet neck ($t_{break}^\ast $) as a function of the capillary number $Ca$ for both the clean and surfactant-contaminated systems.

Figure 16

Figure 17. Snapshots of the droplet flowing through a T-junction microchannel at (a) $\Delta {P^\ast } = 1 \times {10^{ - 6}}$, (b) $\Delta {P^\ast } = 3.33 \times {10^{ - 6}}$ and (c) $\Delta {P^\ast } = 1 \times {10^{ - 3}}$ for the clean (top row) and surfactant-contaminated systems (bottom row). The other parameters are considered as $Ca = 0.01$, $l_0^\ast= 1.5$ and ${\psi _b} = 0.1$.

Figure 17

Figure 18. Volume ratio of the two daughter droplets (${V_1}/{V_2}$) as a function of the dimensionless pressure difference $\Delta {P^\ast }$ for the clean and surfactant-contaminated systems.

Figure 18

Figure 19. Schematic of surfactant-contaminated droplet passing through a T-junction microchannel in the xz middle plane under asymmetric boundary conditions.

Figure 19

Figure 20. Velocity vectors and the distribution of the shear stress ${\tau _{zx}}$ in the xz middle plane at ${t^\ast } = 0.4938$ for the (a) clean and (b) surfactant-contaminated systems. The black and red curves indicate the clean and surfactant-contaminated droplet interfaces, respectively. The other parameters considered are $Ca = 0.01$, ${\psi _b} = 0.1$, $l_0^\ast= 1.5$ and $\Delta {P^\ast } = {10^{ - 3}}$.

Figure 20

Figure 21. Dimensionless breakup time of the droplet neck ($t_{break}^\ast $) as a function of the dimensionless pressure difference $\Delta {P^\ast }$ for both the clean and surfactant-contaminated systems.

Figure 21

Figure 22. Distributions of the velocity magnitude (top row) and surfactant concentration (bottom row) in the xz middle plane at three typical ${t^\ast }$ values, where the pressure difference is fixed at $\Delta {P^\ast } = 1 \times {10^{ - 3}}$. The curved black lines correspond to the droplet interface (${\rho ^N} = 0$).

Figure 22

Figure 23. Volume ratio of the two daughter droplets (${V_1}/{V_2}$) as a function of the bulk surfactant concentration ${\psi _b}$, where the illustrations depict the shapes of droplet breakup or droplet flowing through one branch channel. Other parameters are fixed at $Ca = 0.01$, $l_0^\ast= 1.5$ and $\Delta {P^\ast } = 1 \times {10^{ - 3}}$.

Figure 23

Figure 24. Dimensionless breakup time of the droplet neck ($t_{break}^\ast $) as a function of the bulk surfactant concentration ${\psi _b}$.

Figure 24

Figure 25. Distributions of the velocity magnitude (top row) and surfactant concentration (bottom row) in the xz middle plane for different bulk surfactant concentrations ${\psi _b}$. The black curved lines correspond to the droplet interfaces.

Figure 25

Figure 26. Effects of the bulk surfactant concentration ${\psi _b}$ and pressure difference $\Delta {P^\ast }$ on the volume ratio of daughter droplets (${V_1}/{V_2}$). The solid and dashed red lines indicate the auxiliary lines used to clearly represent the variation in ${V_1}/{V_2}$ with ${\psi _b}$ and $\Delta {P^\ast }$, respectively.

Figure 26

Figure 27. Temporal evolution of the droplet interface (${\rho ^N} = 0$) at (a) ${\theta _0} = 0$, (b) ${\theta _0} = {\rm \pi}/6$ and (c) ${\theta _0} = {\rm \pi}/2$ for the clean (top row) and surfactant-contaminated systems (bottom row). The clean droplet interfaces, surfactant-contaminated droplet interfaces and microchannel walls are indicated in green, red and grey, respectively. The other parameters are $Ca = 0.01$, $l_0^\ast= 1.5$, ${\psi _b} = 0.1$ and $\Delta {P^\ast } = 3.33 \times {10^{ - 6}}$.

Figure 27

Figure 28. Effect of contact angle ${\theta _0}$ on the volume ratio of the two daughter droplets (${V_1}/{V_2}$) for both the clean (${\psi _b} = 0$) and surfactant-contaminated systems (${\psi _b} = 0.1$). The other parameters are fixed at $Ca = 0.01$, $l_0^\ast= 1.5$, ${\psi _b} = 0.1$ and $\Delta {P^\ast } = 3.33 \times {10^{ - 6}}$.

Figure 28

Figure 29. Volume ratio of the two daughter droplets (${V_1}/{V_2}$) as a function of the aspect ratio $\chi $ ($\chi = W/H$). The illustrations show the droplet shapes; the interfaces of the clean and surfactant-contaminated droplets are indicated in green and red, respectively. The other parameters considered are $Ca = 0.01$, $l_0^\ast= 1.5$ and $\Delta {P^\ast } = 1 \times {10^{ - 5}}$.