Type 2 diabetes mellitus (T2DM), a major metabolic disorder characterised by hyperglycaemia, is associated with an increased risk of multiple chronic conditions( 1 , Reference Seshasai, Kaptoge and Thompson 2 ), such as CVD( Reference Jorde, Schirmer and Njølstad 3 ) and nephropathy( Reference Becerra-Tomás, Estruch and Bulló 4 , 5 ). T2DM has been recognised as a leading cause of morbidity and mortality( 1 , Reference Rooney, Pankow and Sibley 6 ).
Ca, an essential mineral, exerts a wide range of biological functions, including bone and tooth mineralisation, blood coagulation, muscle contraction, nerve impulse transmission and cellular signalling transduction( Reference Becerra-Tomás, Estruch and Bulló 4 , Reference Rooney, Pankow and Sibley 6 – Reference Sing, Cheng and Ho 9 ). Additionally, Ca plays a pivotal role in insulin secretion and glucose homeostasis( Reference Becerra-Tomás, Estruch and Bulló 4 , Reference Zaccardi, Webb and Carter 10 , Reference Mears 11 ). Glucose-dependent insulin secretion is a Ca-regulated process, which depends on intracellular Ca concentration in pancreatic β-cells( Reference Zaccardi, Webb and Carter 10 , Reference Wollheim and Sharp 12 ). Moreover, increased cytosolic Ca also affects glucose uptake in the myocyte( Reference Zaccardi, Webb and Carter 10 , Reference Ojuka, Jones and Nolte 13 , Reference Begum, Leitner and Reusch 14 ). Consequently, abnormal Ca homeostasis could potentially be involved with defects in insulin action and disorders in glucose homeostasis, contributing to T2DM development( Reference Becerra-Tomás, Estruch and Bulló 4 , Reference Zaccardi, Webb and Carter 10 , Reference Mears 11 , 15 , Reference Procopio, Magro and Cesario 16 ).
Findings from epidemiological studies are inconsistent. Some observational studies have indicated that increased serum Ca concentration may be directly associated with the risk of developing T2DM( Reference Jorde, Schirmer and Njølstad 3 , Reference Becerra-Tomás, Estruch and Bulló 4 , Reference Rooney, Pankow and Sibley 6 , Reference Sorva and Tilvis 7 , Reference Lorenzo, Hanley and Rewers 17 , Reference Levy, Stern and Gutman 18 – Reference Sun, Vasdev and Martin 21 ), whereas others reported the null correlation between circulating Ca and prevalent T2DM( Reference Sorva and Tilvis 7 , Reference Zaccardi, Webb and Carter 10 , Reference Kim, Oh and Hong 22 ). Also, it has been observed that elevated serum Ca levels were related to insulin resistance( Reference Becerra-Tomás, Estruch and Bulló 4 , Reference Yamaguchi, Kanazawa and Takaoka 20 , Reference Sun, Vasdev and Martin 21 ), reduced insulin sensitivity( Reference Becerra-Tomás, Estruch and Bulló 4 , Reference Levy, Stern and Gutman 18 , Reference Wareham, Byrne and Carr 23 , Reference Hagström, Hellman and Lundgren 24 ) and impaired glucose tolerance( Reference Becerra-Tomás, Estruch and Bulló 4 , Reference Procopio, Magro and Cesario 16 , Reference Lorenzo, Hanley and Rewers 17 , Reference Wareham, Byrne and Carr 23 , Reference Hagström, Hellman and Lundgren 24 ), but not a decrease in insulin secretion( Reference Becerra-Tomás, Estruch and Bulló 4 , Reference Wareham, Byrne and Carr 23 , Reference Hagström, Hellman and Lundgren 24 ). These contradictory results may be partially attributable to diverse Ca assessments, for example, total serum Ca and albumin-adjusted serum Ca, which are different biomarkers of Ca status( Reference Zaccardi, Webb and Carter 10 , Reference Wareham, Byrne and Carr 23 ). Because approximate 40 % of Ca in the serum is bound to albumin( Reference Peacock 8 ), it is vital to know the serum albumin level when evaluating the total serum Ca. Moreover, circulating Ca homeostasis is exquisitely regulated by multiple negative feedback loops which involve several integrated hormonal responses and target organs( Reference Peacock 8 ). Thus, each of these components may mediate the possible Ca-related risk of diabetes. Interestingly, two double-blind, placebo-controlled, randomised clinical trials reported non-significant effects of Ca supplementation on insulin resistance in obese adults( Reference Shalileh, Shidfar and Haghani 25 ), as well as insulin secretion, insulin sensitivity and glycaemia in adults at risk of T2DM( Reference Mitri, Dawson-Hughes and Hu 26 ). Of note, these studies have relatively short follow-up periods, insufficient numbers of participants and heterogeneous characteristics between populations( Reference Shalileh, Shidfar and Haghani 25 , Reference Mitri, Dawson-Hughes and Hu 26 ).
One early meta-analysis( Reference Sing, Cheng and Ho 9 ) was conducted by Sing et al. based only on four cohort studies( Reference Jorde, Schirmer and Njølstad 3 , Reference Becerra-Tomás, Estruch and Bulló 4 , Reference Sing, Cheng and Ho 9 , Reference Lorenzo, Hanley and Rewers 17 ), which reported a positive association of both serum total Ca and albumin-adjusted Ca with risk of diabetes. Since then, four additional cohort studies( Reference Rooney, Pankow and Sibley 6 , Reference Zaccardi, Webb and Carter 10 , Reference Kim, Oh and Hong 22 , Reference Suh, Bae and Jin 27 ) with larger sample sizes have been published. Moreover, the linear association between circulating Ca levels and the T2DM risk has not been investigated.
Therefore, in the present study, we aimed to quantitatively assess the overall association between circulating Ca levels and the risk of T2DM or abnormal glucose homeostasis by performing an up-to-date systematic review and meta-analysis.
Methods
The present study was conducted according to the guidelines of Meta-analysis of Observational Studies in Epidemiology (MOOSE)( Reference Williamson, Rennie and Moher 28 ). The present study was registered with the International Prospective Register of Systematic Reviews (PROSPERO) (https://www.crd.york.ac.uk/PROSPERO/) with the registration number CRD42018092835.
Study search strategy
We performed a systematic search of published studies in English in PubMed from inception to December 2018 using the terms ‘calcium or serum calcium or blood calcium’, ‘diabetes or insulin resistance or impaired glucose tolerance or impaired fasting glucose’, ‘epidemiological studies’, ‘cohort/prospective longitudinal/follow-up/cross-sectional/case-control studies’ and ‘survival analysis or proportional hazard model or hazard ratio Cox or hazards ratio or odds ratio’. In addition, we searched Embase, Google Scholar and reference lists of narrative and systematic reviews to identify missing studies. Importantly, to standardise results specifically for this meta-analysis and to obtain additional information, we requested de novo data from two original studies( Reference Kim, Oh and Hong 22 , Reference Suh, Bae and Jin 27 ).
Selection criteria
Studies were considered for inclusion if they met the following criteria: (a) published in English; (b) had a cohort, case–control or cross-sectional design; (c) provided the exposure information of total serum Ca, albumin-adjusted serum Ca or serum ionised Ca and (d) had a relative risk (RR), hazard ratio (HR) or OR with 95 % CI for T2DM in relation to Ca exposure or a correlation coefficient between Ca exposure and T2DM related variables (e.g. fasting glucose, fasting insulin, insulin sensitivity and insulin resistance), or such information could be derived from the published results.
Data extraction
Two investigators (J. Z. and P. C. X.) reviewed all relevant literature and assessed the eligibility of each study independently. Discrepancies were resolved with consensus reached by group discussion. From each retrieved study, the following information was extracted: author name, year of publication, study region, total number of participants and events (or total number of cases and controls), proportion of males, age of participants, exposure evaluation method, exposure classification, adjusted variables and HR, RR or OR estimates with corresponding 95 % CI for all corresponding Ca exposure categories and/or for continuous exposure, compared with the lowest exposure group. OR reported in a cohort study( Reference Lorenzo, Hanley and Rewers 17 ) was transformed to RR by adopting the following formula: OR = ((1−P 0) × RR/(1−RR × P 0)), where P 0 is the incidence rate in the reference group, according to the published methods( Reference Sing, Cheng and Ho 9 ).
Quality assessment
The Newcastle–Ottawa Scale (NOS) system( Reference Wells, Shea and O’Connell 29 ) was employed to evaluate the quality of each selected cohort study or case–control study. The NOS system has a maximum score of nine points. Studies with a sum score of 0–4, 5–7 and 8–9 were considered as low, moderate and high quality, respectively. Also, the original version of the NOS system was modified for assessing the quality of the included cross-sectional studies for the systematic review based on the existing literature( Reference Zhao, Khawaja and Jin 30 – Reference Ferreira, Dias-Pereira and Branco-de-Almeida 32 ). The modified NOS system has a maximum score of eight points. Studies with a sum score of 0–4, 5–7 and 8 were considered as low, moderate and high quality, respectively. Two co-authors (J. Z. and P. C. X.) independently conducted the quality assessment. Any unconformity was resolved with consensus reached by group discussion with the involvement of a third investigator.
Statistical analysis
We pooled the cohort studies’ data for each outcome of interest using a random-effects model in Stata 13.0 (STATA Corp). P values ≤ 0·05 were considered statistically significant if not otherwise specified. For the comparisons, we used the multivariable-adjusted associations (RR) for the highest v. lowest category of albumin-adjusted serum Ca or total Ca levels, and for the linear associations, we used standardised Ca levels with 1 mg/dl increments. Because of an insufficient number of studies measuring ionised Ca, we did not pool the data separately for this subgroup. Heterogeneity was estimated quantitatively using I 2 and tested by Cochran’s Q-test. An I 2 value of >75, 51–75, 26–50 or 0–25 % corresponds to high, moderate, low or very low heterogeneity, respectively. We evaluated publication bias through both Egger’s asymmetry test and Begg’s non-parametric test with the α level set as 0·10. The Duval and Tweedie non-parametric ‘trim and fill’ method was adopted, if publication bias existed( Reference Duval and Tweedie 33 ).
We also conducted sensitivity analyses to assess the effect of replacing a random-effects model with a fixed-effects model and the influence of an individual study on the overall association by excluding one study each time from the analysis. We also evaluated the impact of one study measuring ionised Ca on the overall association by combining it with other studies.
Results
Literature search
The literature selection process is shown in Fig. 1. A total of forty-five related articles were retrieved from PubMed, Embase and Google Scholar. Of these, three articles were excluded since they were not issued in English; nine publications were further excluded because they did not associate blood Ca with an outcome of interest and additional fifteen articles were excluded because they did not report blood Ca as either a categorical variable or a continuous variable on the original scale. Furthermore, we also identified two articles by searching the reference lists of relevant publications. Thus, the search revealed eight cohort studies( Reference Jorde, Schirmer and Njølstad 3 , Reference Becerra-Tomás, Estruch and Bulló 4 , Reference Rooney, Pankow and Sibley 6 , Reference Sing, Cheng and Ho 9 , Reference Zaccardi, Webb and Carter 10 , Reference Lorenzo, Hanley and Rewers 17 , Reference Kim, Oh and Hong 22 , Reference Suh, Bae and Jin 27 ) for the meta-analysis and another twelve eligible studies (four case–control studies( Reference Sorva and Tilvis 7 , Reference Levy, Stern and Gutman 18 , Reference Heath, Lambert and Service 34 , Reference McNair, Fogh-Andersen and Madsbad 35 ) and eight cross-sectional studies( Reference Kim, Kim and Jang 19 – Reference Sun, Vasdev and Martin 21 , Reference Wareham, Byrne and Carr 23 , Reference Hagström, Hellman and Lundgren 24 , Reference Cho, Shin and Yi 36 – Reference Guasch, Bulló and Rabassa 38 )) for the systematic review.
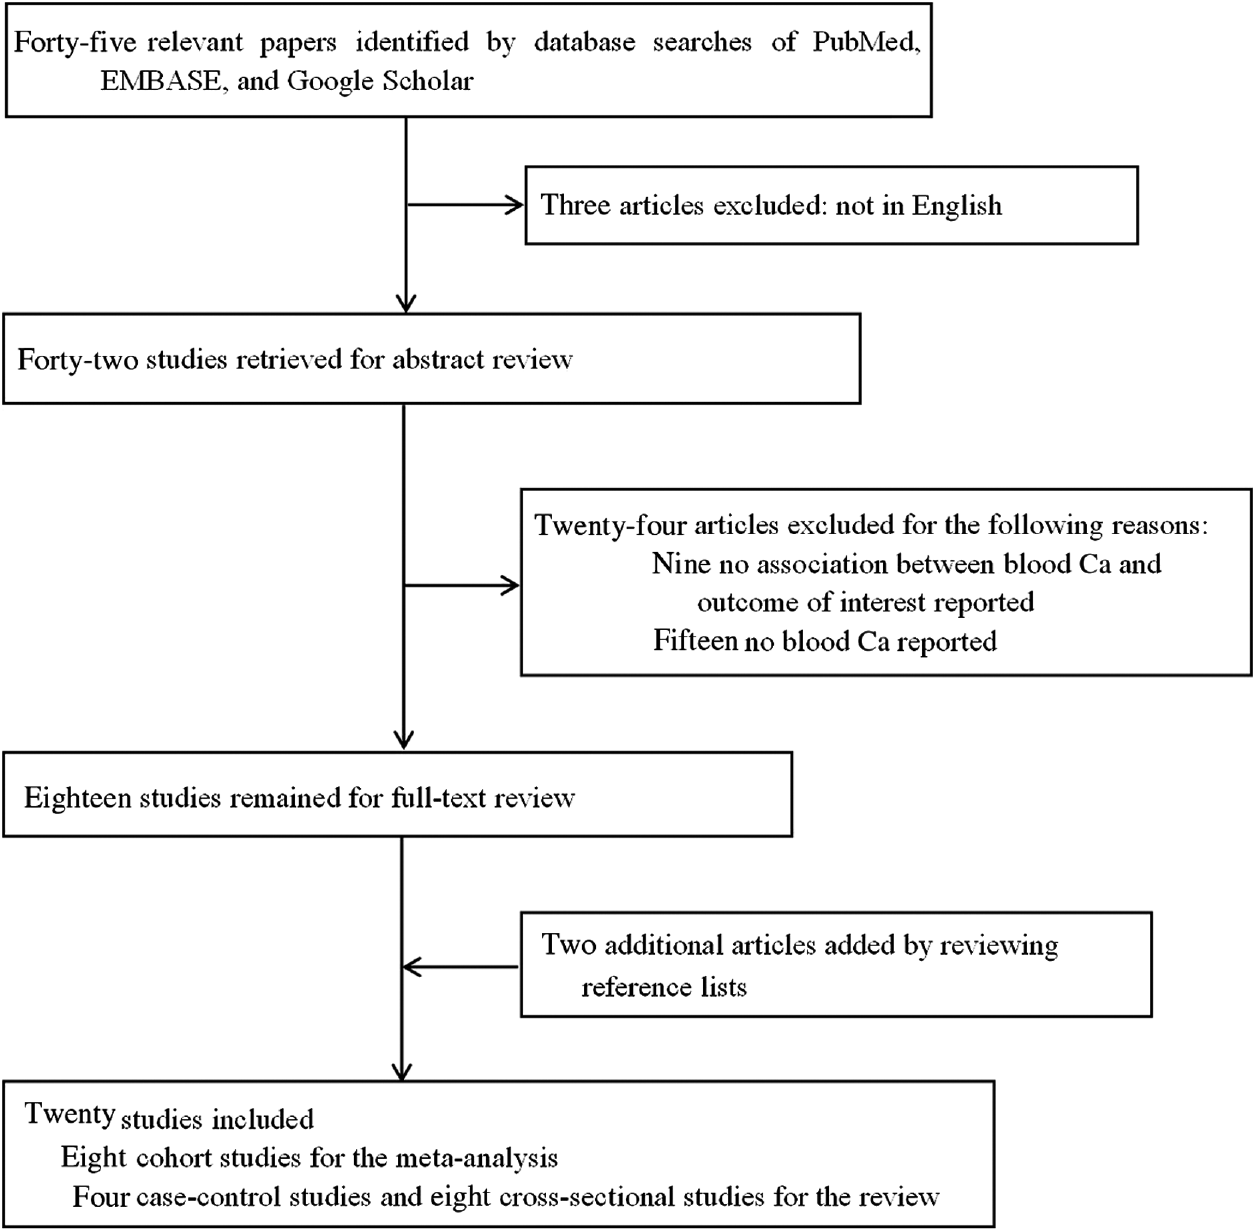
Fig. 1. Flow chart of study selection.
Study characteristics
The information from the eligible studies was extracted (Tables 1–3). The total number of participants of all the included studies was 89 165 (48·6 % males). For eight cohort studies( Reference Jorde, Schirmer and Njølstad 3 , Reference Becerra-Tomás, Estruch and Bulló 4 , Reference Rooney, Pankow and Sibley 6 , Reference Sing, Cheng and Ho 9 , Reference Zaccardi, Webb and Carter 10 , Reference Lorenzo, Hanley and Rewers 17 , Reference Kim, Oh and Hong 22 , Reference Suh, Bae and Jin 27 ), there were 80 359 individuals (49·9 % males) with 6447 incidents of diabetes. For four case–control studies( Reference Sorva and Tilvis 7 , Reference Levy, Stern and Gutman 18 , Reference Heath, Lambert and Service 34 , Reference McNair, Fogh-Andersen and Madsbad 35 ), there were 858 individuals (35·9 % males) with 324 diabetes cases and 534 controls. For eight cross-sectional studies( Reference Kim, Kim and Jang 19 – Reference Sun, Vasdev and Martin 21 , Reference Wareham, Byrne and Carr 23 , Reference Hagström, Hellman and Lundgren 24 , Reference Cho, Shin and Yi 36 – Reference Guasch, Bulló and Rabassa 38 ), there were 7948 participants (37·2 % males) including 740 diabetes cases. The mean age of participants across primary studies was from 25·7 to 80 years.
Table 1. Characteristics of eight included cohort studies on the association between blood calcium concentrations and incidence of type 2 diabetes mellitus (T2DM)
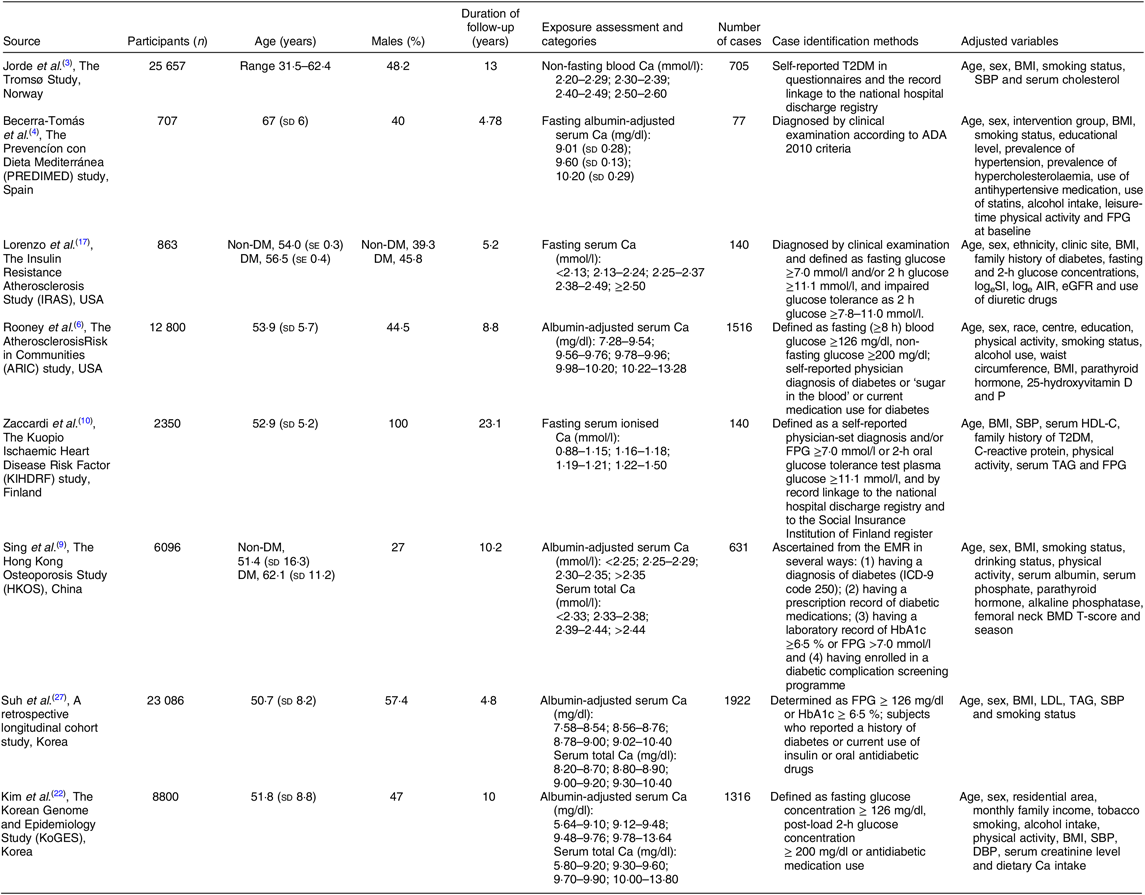
SBP, systolic blood pressure; ADA, American Diabetes Association; FPG, fasting plasma glucose; DM, diabetes mellitus; SI, insulin sensitivity index; AIR, acute insulin response; eGFR, estimated glomerular filtration rate; HDL-C, HDL-cholesterol; EMR, electronic medical record; HbA1c, glycated Hb; BMD, bone mineral density; LDL, LDL-cholesterol; DBP, diastolic blood pressure.
Table 2. Characteristics of four case–control studies on the association between blood calcium concentrations and incidence of diabetes
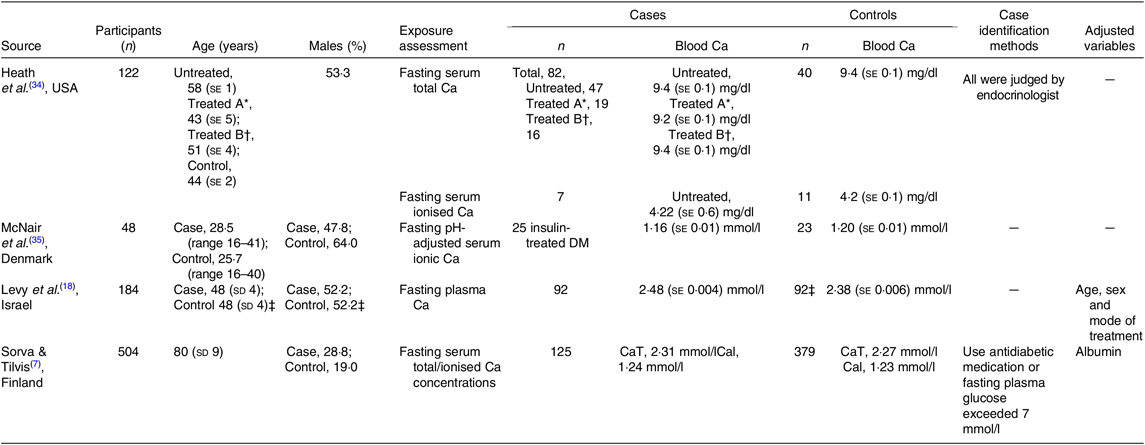
DM, diabetes mellitus; CaT, total Ca; Cal, ionised, actual Ca.
* Treated A: fasting plasma glucose > 200 mg/dl.
† Treated B: fasting plasma glucose < 200 mg/dl.
‡ Matched with the case group.
Table 3. Characteristics of eight cross-sectional studies on the association between blood calcium concentrations and incidence of diabetes or impaired glucose tolerance
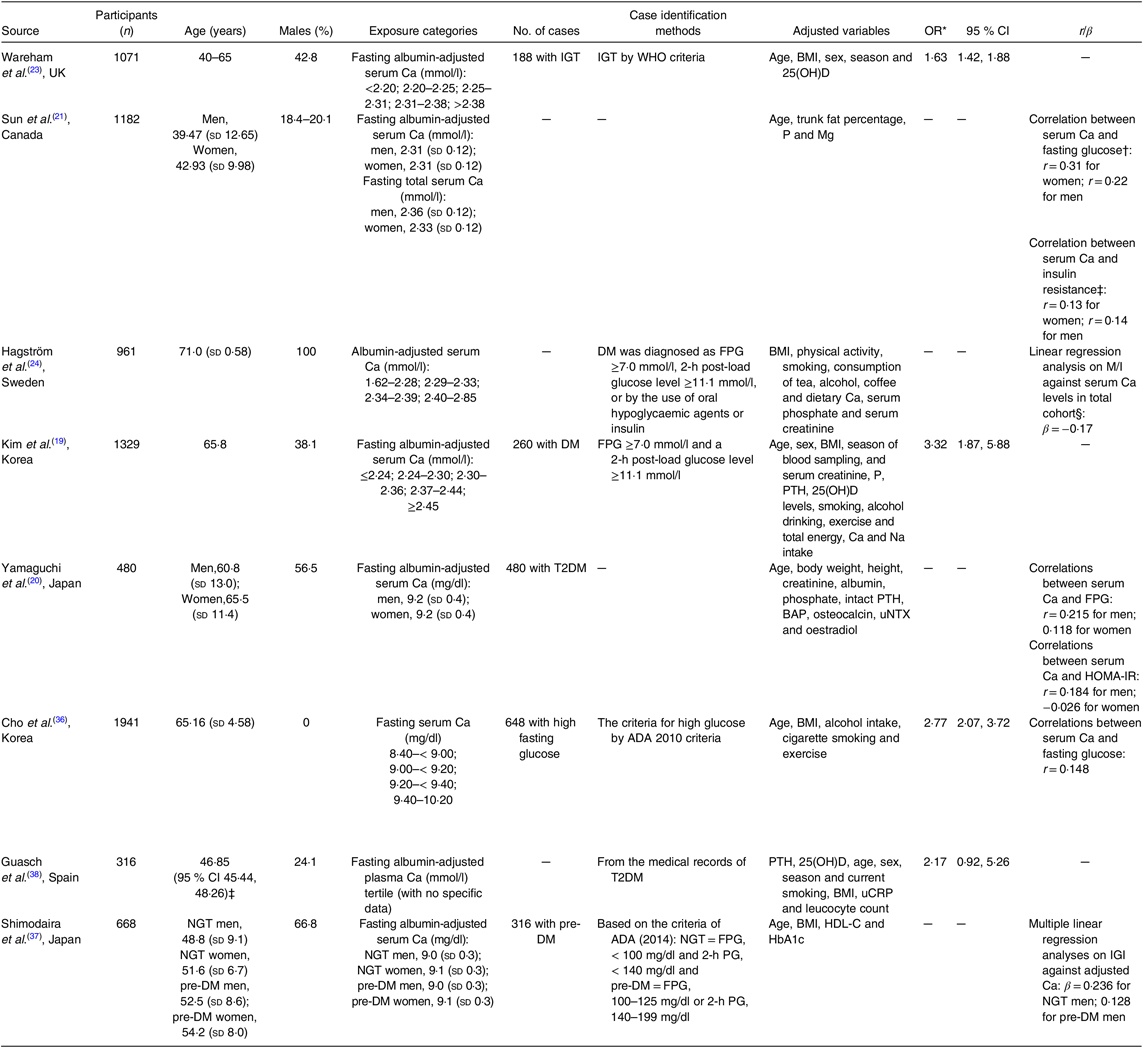
IGI, insulinogenic index; 25(OH)D, 25-hydroxyvitamin D3; DM, diabetes mellitus; FPG, fasting plasma glucose; M/I, glucose disposal rate [M] divided by mean insulin concentration [I]; PTH, parathyroid hormone; T2DM, type 2 diabetes mellitus; BAP, bone-specific alkaline phosphatase; uNTX, urinary N-terminal cross-linked telopeptide of type-I collagen; HOMA-IR, homeostatic model assessment for insulin resistance; ADA, American Diabetes Association; uCRP, ultrasensitive C-reactive protein; NGT, normal glucose tolerance; Pre-DM, pre-diabetes mellitus; PG, plasma glucose; HDL-C, HDL-cholesterol; HbA1c, glycated Hb; IGT, impaired glucose tolerance.
* The highest quintile of blood Ca was compared with the lowest quintile.
† Partial correlations between total serum Ca and fasting serum glucose.
‡ Partial correlations between total serum Ca and insulin resistance.
§ Standard deviation increase in serum Ca was associated with 0·17 mg·kg−1·min−1 (mU/l)−1 × 100 (0·024 mg·kg−1·min−1 (pmol/l) × 100) decrease in M/I.
Regarding the quality of the included eight cohort studies( Reference Jorde, Schirmer and Njølstad 3 , Reference Becerra-Tomás, Estruch and Bulló 4 , Reference Rooney, Pankow and Sibley 6 , Reference Sing, Cheng and Ho 9 , Reference Zaccardi, Webb and Carter 10 , Reference Lorenzo, Hanley and Rewers 17 , Reference Kim, Oh and Hong 22 , Reference Suh, Bae and Jin 27 ), six studies( Reference Jorde, Schirmer and Njølstad 3 , Reference Becerra-Tomás, Estruch and Bulló 4 , Reference Rooney, Pankow and Sibley 6 , Reference Lorenzo, Hanley and Rewers 17 , Reference Kim, Oh and Hong 22 , Reference Suh, Bae and Jin 27 ) were assessed as high quality and two studies( Reference Sing, Cheng and Ho 9 , Reference Zaccardi, Webb and Carter 10 ) as moderate quality (online Supplementary Table S1). Of the included four case–control studies( Reference Sorva and Tilvis 7 , Reference Levy, Stern and Gutman 18 , Reference Heath, Lambert and Service 34 , Reference McNair, Fogh-Andersen and Madsbad 35 ), two studies( Reference Levy, Stern and Gutman 18 , Reference Heath, Lambert and Service 34 ) were assessed as moderate quality and two studies( Reference Sorva and Tilvis 7 , Reference McNair, Fogh-Andersen and Madsbad 35 ) as low quality. For the included eight cross-sectional studies( Reference Kim, Kim and Jang 19 – Reference Sun, Vasdev and Martin 21 , Reference Wareham, Byrne and Carr 23 , Reference Hagström, Hellman and Lundgren 24 , Reference Cho, Shin and Yi 36 – Reference Guasch, Bulló and Rabassa 38 ), two studies( Reference Kim, Kim and Jang 19 , Reference Wareham, Byrne and Carr 23 ) were assessed as high quality and six studies( Reference Yamaguchi, Kanazawa and Takaoka 20 , Reference Sun, Vasdev and Martin 21 , Reference Hagström, Hellman and Lundgren 24 , Reference Cho, Shin and Yi 36 – Reference Guasch, Bulló and Rabassa 38 ) as moderate quality.
Meta-analysis of the cohort studies
A significant association between albumin-adjusted serum Ca levels and T2DM incidence was found (RR 1·14; 95 % CI 1·05, 1·24) (Fig. 2), comparing the highest with the lowest Ca levels based on available data from five cohort studies( Reference Becerra-Tomás, Estruch and Bulló 4 , Reference Rooney, Pankow and Sibley 6 , Reference Sing, Cheng and Ho 9 , Reference Kim, Oh and Hong 22 , Reference Suh, Bae and Jin 27 ). Neither heterogeneity (I 2 = 0·0 %, P = 0·550) nor publication bias (Egger’s test: P = 0·631; Begg’s test: P = 0·462) existed. Consistently, a significant linear association was found (RR 1·16; 95 % CI 1·07, 1·27) with 1 mg/dl increments in albumin-adjusted serum Ca levels. Low heterogeneity (I 2 = 33·8 %, P = 0·183) was observed, but no publication bias (Egger’s test: P = 0·104; Begg’s test: P = 0·452) was evidenced. When adding the cohort study with ionised Ca as the exposure( Reference Zaccardi, Webb and Carter 10 ), the aforementioned results of pooled RR remained (the highest v. the lowest: 1·13 (95 % CI 1·04, 1·22); per 1 mg/dl increment: 1·16 (95 % CI 1·06, 1·27)).
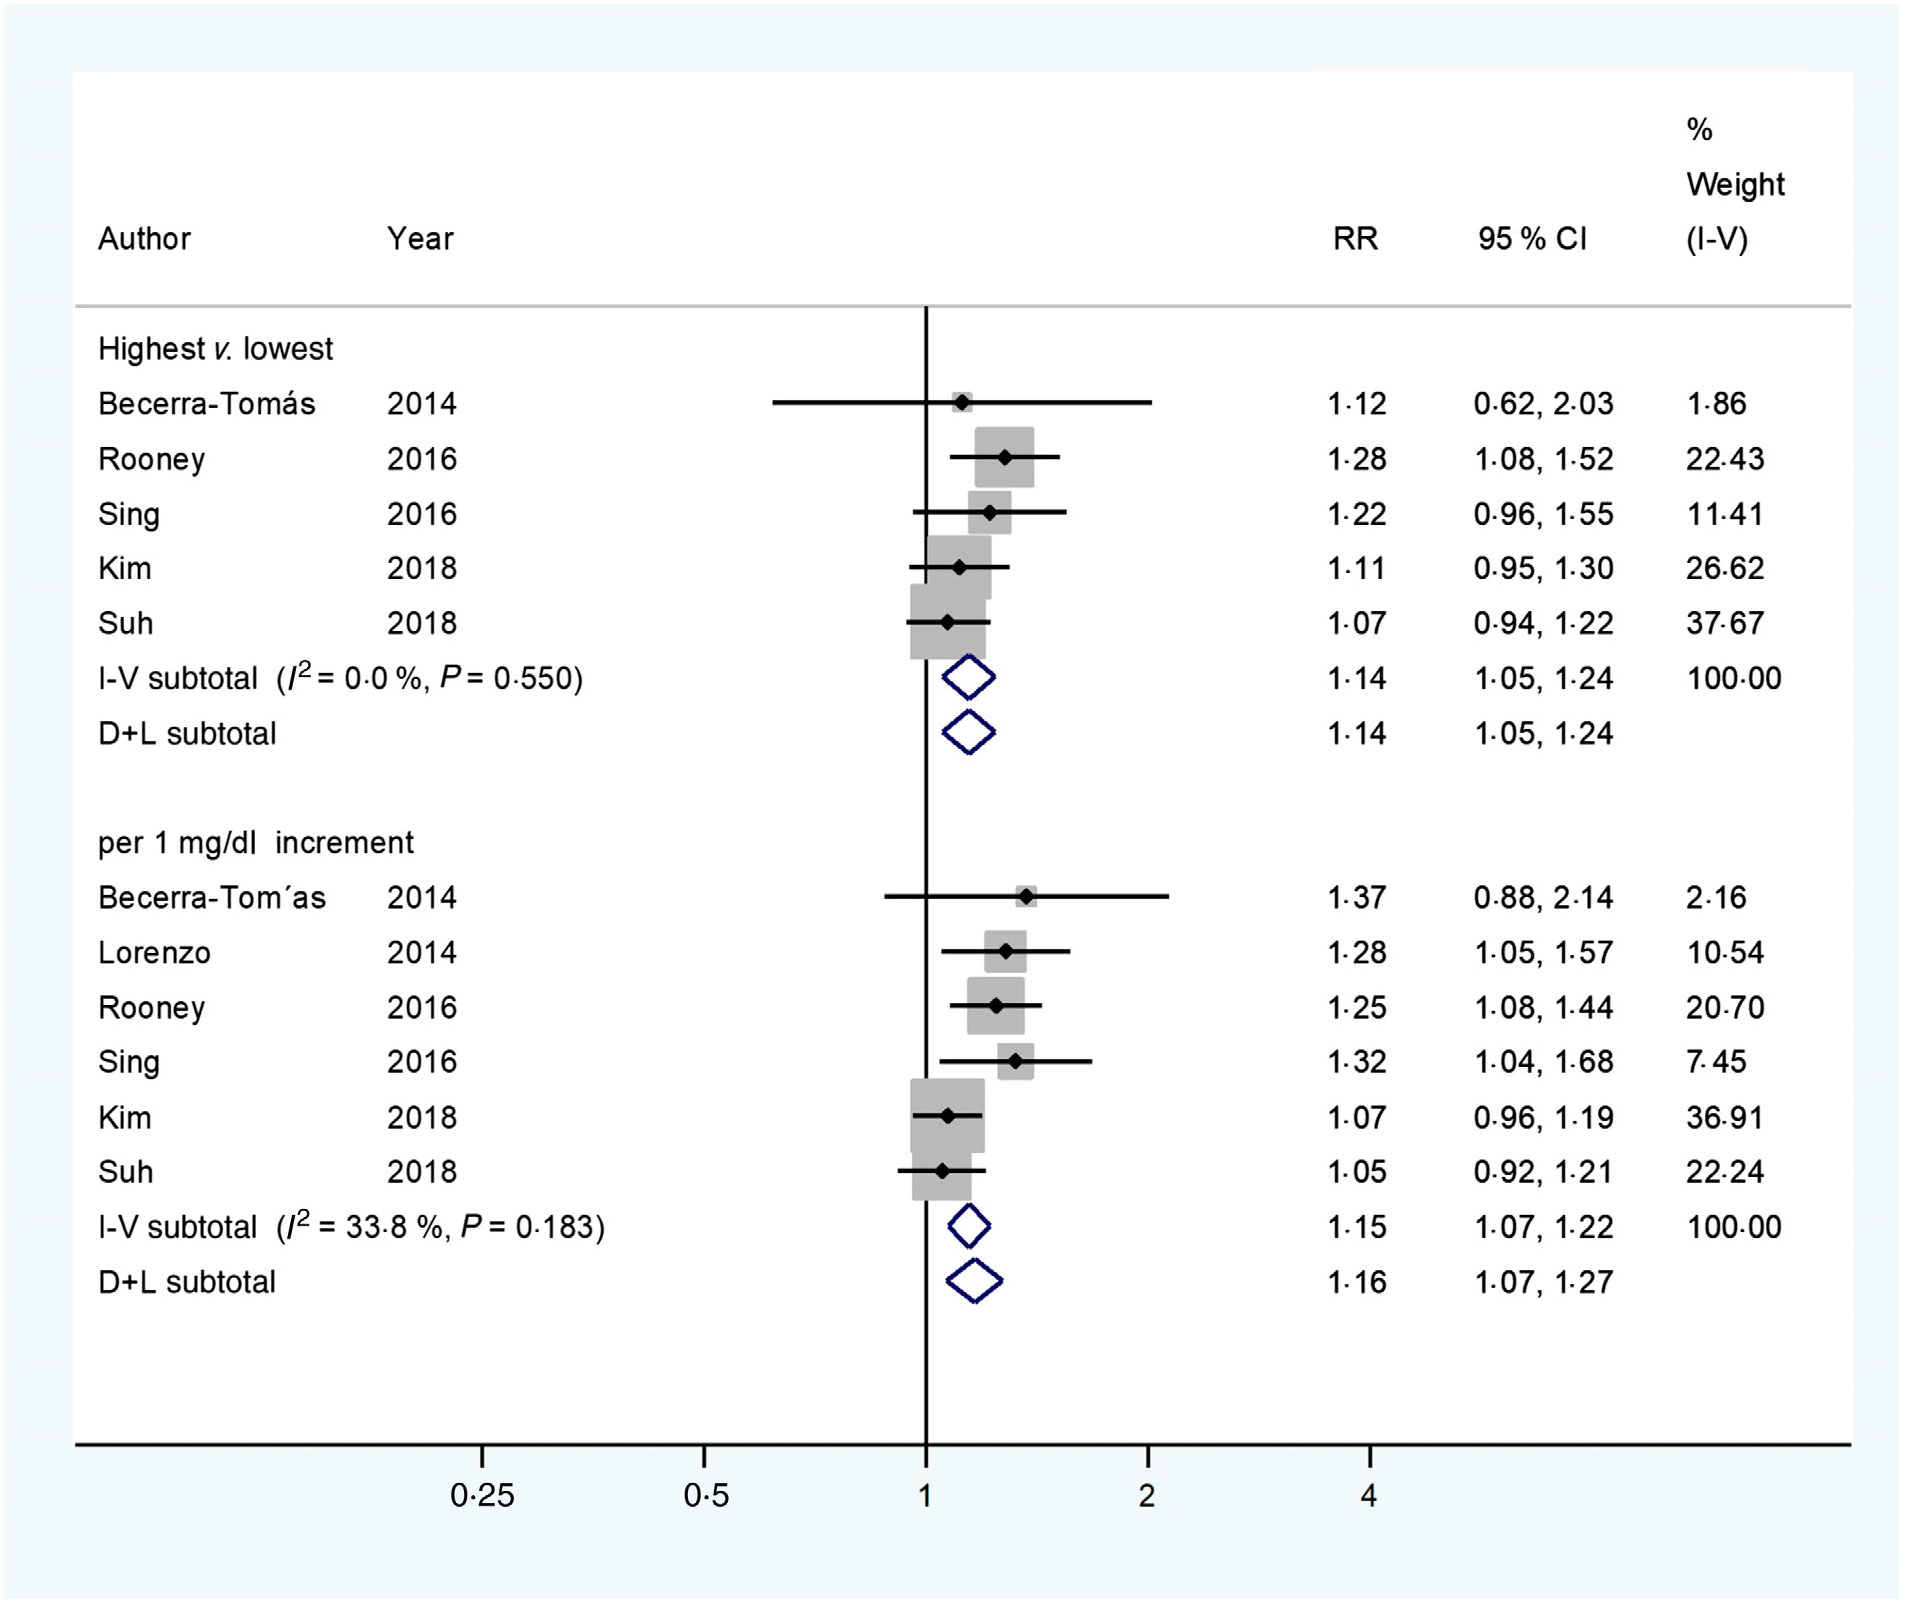
Fig. 2. Multivariable-adjusted relative risks (RR) (![]() ) and 95 % confidence intervals (
) and 95 % confidence intervals (![]() ) of type 2 diabetes mellitus (T2DM) in relation to albumin-adjusted serum calcium levels. The summary assessments (
) of type 2 diabetes mellitus (T2DM) in relation to albumin-adjusted serum calcium levels. The summary assessments (![]() ) were obtained by adopting a random-effects model. Values are adjusted RR comparing the highest with the lowest category levels or per 1 mg/dl increase in albumin-adjusted serum calcium. The size of the shaded square is proportional to the weight of each study. We requested de novo data from the authors of Kim et al.(
Reference Kim, Oh and Hong
22
) and Suh et al.(
Reference Suh, Bae and Jin
27
), respectively.
) were obtained by adopting a random-effects model. Values are adjusted RR comparing the highest with the lowest category levels or per 1 mg/dl increase in albumin-adjusted serum calcium. The size of the shaded square is proportional to the weight of each study. We requested de novo data from the authors of Kim et al.(
Reference Kim, Oh and Hong
22
) and Suh et al.(
Reference Suh, Bae and Jin
27
), respectively.
Similar results (Fig. 3) were found when the pooled analysis was restricted to studies( Reference Jorde, Schirmer and Njølstad 3 , Reference Sing, Cheng and Ho 9 , Reference Lorenzo, Hanley and Rewers 17 , Reference Kim, Oh and Hong 22 , Reference Suh, Bae and Jin 27 ) that measured serum total Ca (RR 1·25; 95 % CI 1·10, 1·42), comparing the highest with the lowest serum total Ca levels. However, low heterogeneity (I 2 = 33·3 %, P = 0·199) and potential publication bias (Egger’s test: P = 0·008; Begg’s test: P = 0·027) were observed. We then used the Duval and Tweedie non-parametric ‘trim and fill’ method and observed the overall RR was 1·21 (95 % CI 1·06, 1·38). A significant linear association was also found (RR 1·19 (95 % CI 1·11, 1 28) with 1 mg/dl increments in serum total Ca levels). No heterogeneity (I 2 = 0 %, P = 0·694) was observed, but potential publication bias (Egger’s test: P = 0·031; Begg’s test: P = 0·221) was evidenced. After using the Duval and Tweedie non-parametric ‘trim and fill’ method, we observed the overall RR was 1·18 (95 % CI 1·10, 1·26). When further including the study that assayed ionised Ca( Reference Zaccardi, Webb and Carter 10 ), the results of pooled RR persisted (the highest v. the lowest: 1·21 (95 % CI 1·06, 1·39) and 1·19 (95 % CI 1·11, 1·27) with 1 mg/dl increments).
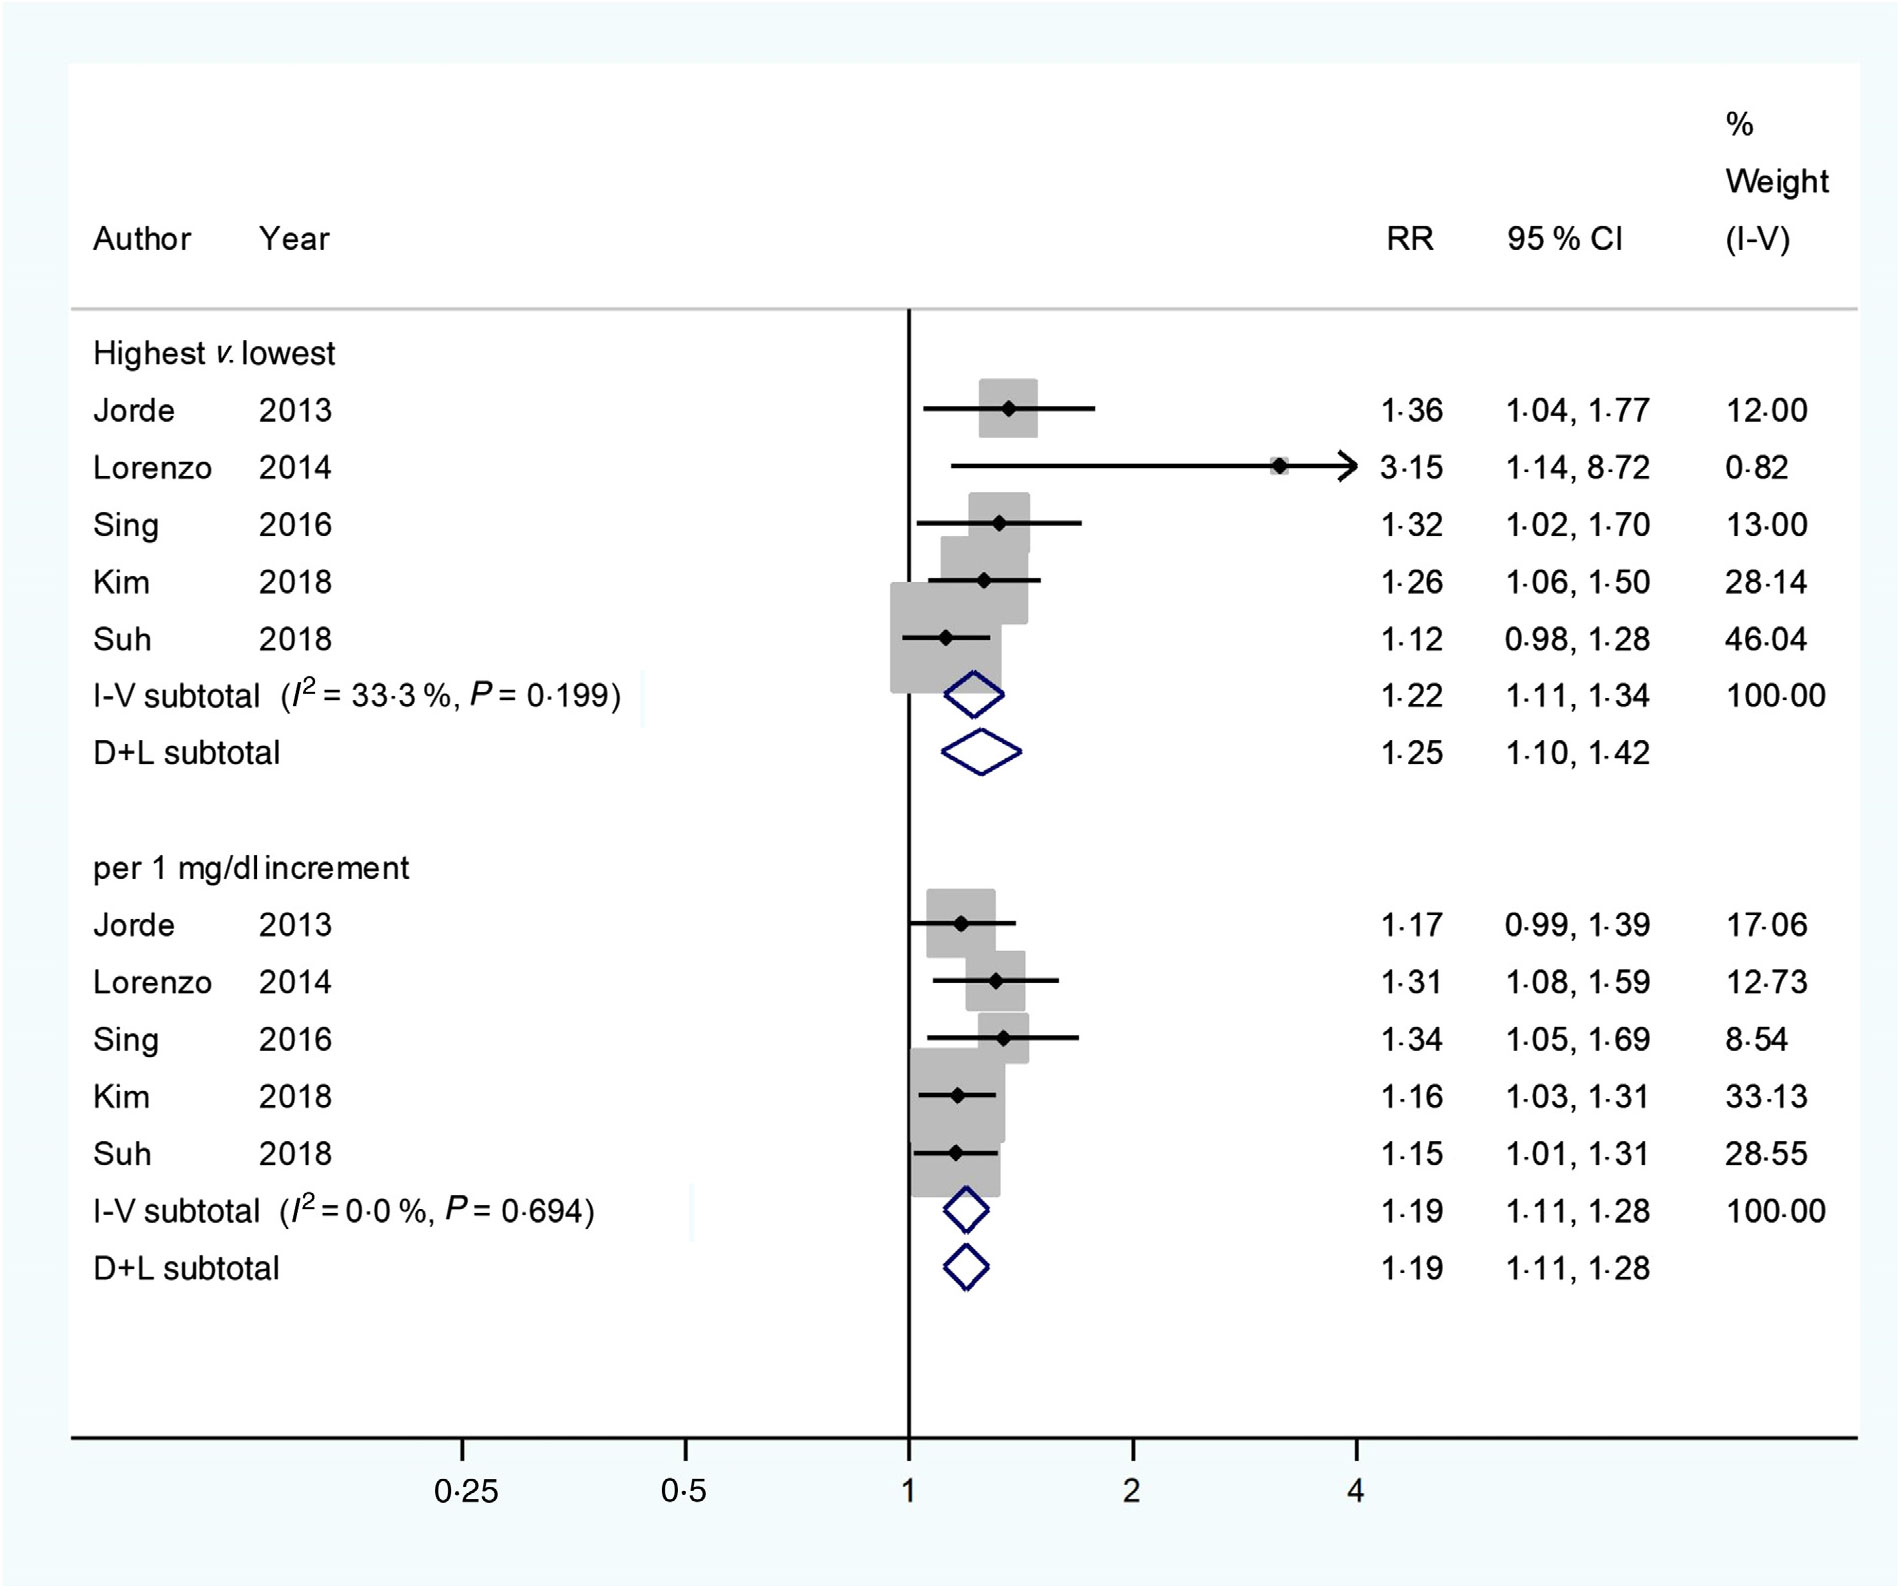
Fig. 3. Multivariable-adjusted relative risks (RR) (![]() ) and 95 % confidence intervals (
) and 95 % confidence intervals (![]() ) of type 2 diabetes mellitus (T2DM) in relation to serum total calcium levels. The summary assessments (
) of type 2 diabetes mellitus (T2DM) in relation to serum total calcium levels. The summary assessments (![]() ) were obtained by adopting a random-effects model. Values are adjusted RR comparing the highest with the lowest category levels or per 1 mg/dl increase in serum total calcium. The size of the shaded square is proportional to the weight of each study. We requested de novo data from the authors of Kim et al.(
Reference Kim, Oh and Hong
22
) and Suh et al.(
Reference Suh, Bae and Jin
27
), respectively.
) were obtained by adopting a random-effects model. Values are adjusted RR comparing the highest with the lowest category levels or per 1 mg/dl increase in serum total calcium. The size of the shaded square is proportional to the weight of each study. We requested de novo data from the authors of Kim et al.(
Reference Kim, Oh and Hong
22
) and Suh et al.(
Reference Suh, Bae and Jin
27
), respectively.
The sensitivity analyses revealed that replacing the random-effects model with a fixed-effects model or any single study did not appreciably influence the pooled results or conclusions (online Supplementary Tables S4–S7).
Systematic review of the case–control and cross-sectional studies
The included case–control studies reported inconsistent results on the association between Ca homeostasis and diabetic risk. Higher serum total Ca levels( Reference Sorva and Tilvis 7 ) or higher plasma Ca levels( Reference Levy, Stern and Gutman 18 ) were reported in the middle-aged and elderly diabetic patients. Contrarily, normal serum total Ca( Reference Heath, Lambert and Service 34 ) and ionised Ca levels( Reference Sorva and Tilvis 7 , Reference Heath, Lambert and Service 34 ) were observed, respectively, in the middle-aged and elderly diabetic patients, and decreased serum ionised Ca concentrations( Reference McNair, Fogh-Andersen and Madsbad 35 ) were also observed in the young diabetic patients, respectively, compared with the non-diabetic individuals (Table 2).
The included cross-sectional studies reported that serum Ca was directly correlated to glucose intolerance( Reference Sun, Vasdev and Martin 21 , Reference Wareham, Byrne and Carr 23 , Reference Cho, Shin and Yi 36 ), insulin resistance( Reference Sun, Vasdev and Martin 21 ), impaired glucose metabolism( Reference Yamaguchi, Kanazawa and Takaoka 20 ), early phase insulin secretion( Reference Shimodaira, Niwa and Nakajima 37 ) and diabetes( Reference Kim, Kim and Jang 19 , Reference Guasch, Bulló and Rabassa 38 ) mainly in middle-aged and elderly individuals. However, serum Ca was found inversely correlated to β-cell function in women( Reference Sun, Vasdev and Martin 21 ) and insulin sensitivity in older men( Reference Hagström, Hellman and Lundgren 24 ) (Table 3).
Discussion
The accumulated evidence from the cohort studies suggests that either albumin-adjusted serum Ca or serum total Ca was directly associated with T2DM risk, though data from case–control and cross-sectional studies were inconsistent and inconclusive. The present study provided updated and robust data to the literature by including additional and de novo results from a few newly published large cohort studies. Also, the present study investigated both categorical and linear associations between circulating Ca and T2DM incidence, which strengthened our conclusion.
The results in case–control and cross-sectional studies were not consistent, which may be partially explained by the different Ca measurements, such as total serum, albumin-corrected serum, serum ionised or plasma levels or heterogeneous study populations with various outcomes.
The results of the present study are inconsistent with findings from studies on dietary Ca intake and the T2DM risk( Reference Kim, Oh and Hong 22 , Reference Pittas, Dawson-Hughes and Li 39 – Reference Kirii, Mizoue and Iso 42 ). One possible explanation is that dietary estimation and blood Ca are different assessments, which are subject to different measurement errors. Another explanation is that the dietary Ca and diabetes association may be confounded by Mg intake, which is highly correlated with Ca intake and associated with diabetes risk( Reference Dong and Qin 43 ). Moreover, circulating Ca concentrations could reflect not only the exogenous Ca intake but also the endogenous capability of maintaining homeostasis( Reference Kim, Oh and Hong 22 ), which is tightly regulated by multiple negative feedback loops involving several target organs and hormones( Reference Jorde, Schirmer and Njølstad 3 , Reference Rooney, Pankow and Sibley 6 , Reference Peacock 8 , Reference Kim, Oh and Hong 22 ). Ca intake may lead to an elevation of serum Ca that activates the Ca-sensing receptor (CaR) in the parathyroid glands to reduce parathyroid hormone (PTH) secretion( Reference Peacock 8 ). The reduced PTH inactivates the PTH receptor (PTHR) in kidney to decrease tubular Ca reabsorption, and PTHR in bone to decrease net bone Ca resorption( Reference Peacock 8 ). The reduced PTH also results in a decreased secretion of 1,25-dihydroxyvitamin D (1,25(OH)2D), which inactivates the vitamin D receptor in intestine to reduce Ca absorption, in the parathyroid glands to augment PTH secretion and in bone to reduce Ca resorption( Reference Peacock 8 ). The rise in serum Ca may also activate the CaR in kidney to decrease Ca reabsorption( Reference Peacock 8 ). When a decrease in serum Ca occurs, this integrated hormonal response is reversed with serum Ca increased, which helps to maintain total serum Ca levels within a physiological range of approximately 10 %( Reference Peacock 8 ). However, emerging evidence showed that hormones (such as PTH, 1,25(OH)2D) that participate in this complex homeostatic system have themselves been related to diabetes( Reference Reis, Selvin and Pankow 44 , Reference Song, Wang and Pittas 45 ). Thus, abnormalities of these pivotal physiological factors may affect the Ca–diabetes association, which warrants further investigation.
The potential mechanisms underlying the role of circulating Ca in T2DM incidence remain unclear. However, growing evidence implies that Ca may mediate insulin secretion via activation of the CaR( Reference Gray, Muller and Squires 46 , Reference Jones, Kitsou-Mylona and Gray 47 ), which is wildly expressed in tissues, such as pancreatic islets of Langerhans( Reference Gray, Muller and Squires 46 ). Glucose-dependent insulin secretion from the pancreatic β-cells is a Ca-regulated process( Reference Mears 11 , Reference Wollheim and Sharp 12 , Reference Henquin 48 ), which requires the influx of Ca through voltage-gated Ca channels to the secretory granules in β-cells( Reference Jing, Li and Olofsson 49 – Reference Ko, Lee and Vo 51 ). Thus, high Ca concentration may induce β-cell dysfunction( Reference Sun, Vasdev and Martin 21 ). Moreover, abnormal Ca status impacts insulin sensitivity and glucose transport in adipocytes and skeletal muscle( Reference Begum, Leitner and Reusch 14 , Reference Draznin, Lewis and Houlder 52 , Reference Draznin, Sussman and Eckel 53 ) through regulating GLUT4 expression, which is a passive transporter necessary for glucose uptake in peripheral tissues( Reference Ojuka, Jones and Nolte 13 , Reference Begum, Leitner and Reusch 14 ). Chronic exposure to increased cytosolic Ca levels has been shown to prohibit GLUT4 expression in skeletal muscle( Reference Park, Scheffler and Gunawan 54 ). Furthermore, elevated or sustained cytosolic Ca levels have been revealed to reduce GLUT4 expression and consequently decrease insulin receptor activity and reduce glucose uptake in adipocytes( Reference Becerra-Tomás, Estruch and Bulló 4 ). Because of the pivotal role of insulin in modulating blood glucose( Reference Khan and Pessin 55 ), abnormalities in circulating Ca levels could potentially impair β-cell secretory function, glucose intolerance and insulin sensitivity. Thus, it may consequently lead to T2DM development( Reference Lorenzo, Hanley and Rewers 17 ). Notably, it has been observed that abnormal intracellular Ca may cause pancreatic β-cell apoptosis( Reference Chandra, Zhivotovsky and Zaitsev 56 , Reference Wang, Bhattacharjee and Zuo 57 ). Intracellular Ca increases may accompany the activation of endoplasmic reticulum stress and dysfunction of organelles, including mitochondria and the nucleus, which may lead to destruction of pancreatic β-cells( Reference Ramadan, Steiner and O’Neill 58 ). Therefore, future studies investigating such targets might help elucidate mechanisms relevant to the Ca–diabetes association and progression to T2DM.
Several limitations need to be acknowledged when interpreting the findings from this systematic review and meta-analysis. First, most observational studies adopted albumin-adjusted serum Ca as exposure assessment( Reference Seshasai, Kaptoge and Thompson 2 , Reference Rooney, Pankow and Sibley 6 , Reference Sing, Cheng and Ho 9 , Reference Lorenzo, Hanley and Rewers 17 , Reference Kim, Kim and Jang 19 – Reference Sun, Vasdev and Martin 21 , Reference Wareham, Byrne and Carr 23 , Reference Hagström, Hellman and Lundgren 24 , Reference Shimodaira, Niwa and Nakajima 37 , Reference Guasch, Bulló and Rabassa 38 ), which is prone to errors because of the assumption that Ca binds to albumin steadily( Reference Calvi and Bushinsky 59 , Reference Zhao, Ford and Li 60 ). In fact, it may neglect other relevant ligands and Ca fractions( Reference Guynn, Veloso and Veech 61 ). Hence, the results of the risk prediction based on measuring albumin-adjusted serum Ca need to be interpreted with caution. Ionised Ca is considered as the physiologically active form( Reference Guynn, Veloso and Veech 61 ) and the ‘gold standard’ of Ca homeostasis assessment( Reference Becerra-Tomás, Estruch and Bulló 4 , Reference Baird 62 , Reference Bushinsky and Monk 63 ). However, only one available cohort study measured ionised Ca and reported a null association with incident T2DM( Reference Zaccardi, Webb and Carter 10 ), though it did not appreciably alter the overall association. The association of ionised Ca levels with T2DM risk merits further investigation. Second, serum Ca is highly modulated by some other factors, such as PTH or vitamin D. However, not all primary studies adjusted for these potential confounding variables. This inherent limitation may somehow affect the combined association. Third, low heterogeneity was evidenced for studies with some serum Ca measurements. The impact should be reduced using a random-effects model in the analyses. Fourth, a potential publication bias could not be completely excluded in some pooled analyses. Nevertheless, the associations were not substantially changed after using the ‘trim and fill’ method to account for the publication bias. Thus, our conclusion should remain.
In summary, data from this systematic review and meta-analysis provide accumulated evidence supporting the conclusion that circulating Ca levels are associated with the incidence of T2DM. Further studies are needed to establish the causal inference and elucidate the underlying mechanism of action.
Acknowledgements
The present study was supported by the National Natural Science Foundation of China (); the US National Institutes of Health (); the Shanghai Key Laboratory of Pediatric Gastroenterology and Nutrition (); the Danone Nutrition Research and Education Grant () and the Shanghai Municipal Commission of Health and Family Planning (, ).
The authors’ contributions were as follows: K. H. conceived the study concept, designed the protocol and supervised the manuscript writing; J. Z. and P. C. X. conducted research, analysed data and wrote the manuscript; J. C. B., J. H. K., D. J. K. and K. F. Y. revised the manuscript. K. H. had primary responsibility for final content. All authors read and approved the final manuscript.
The authors declare that there are no conflicts of interest.
Supplementary material
For supplementary materials referred to in this article, please visit https://doi.org/10.1017/S0007114519001430


