Introduction
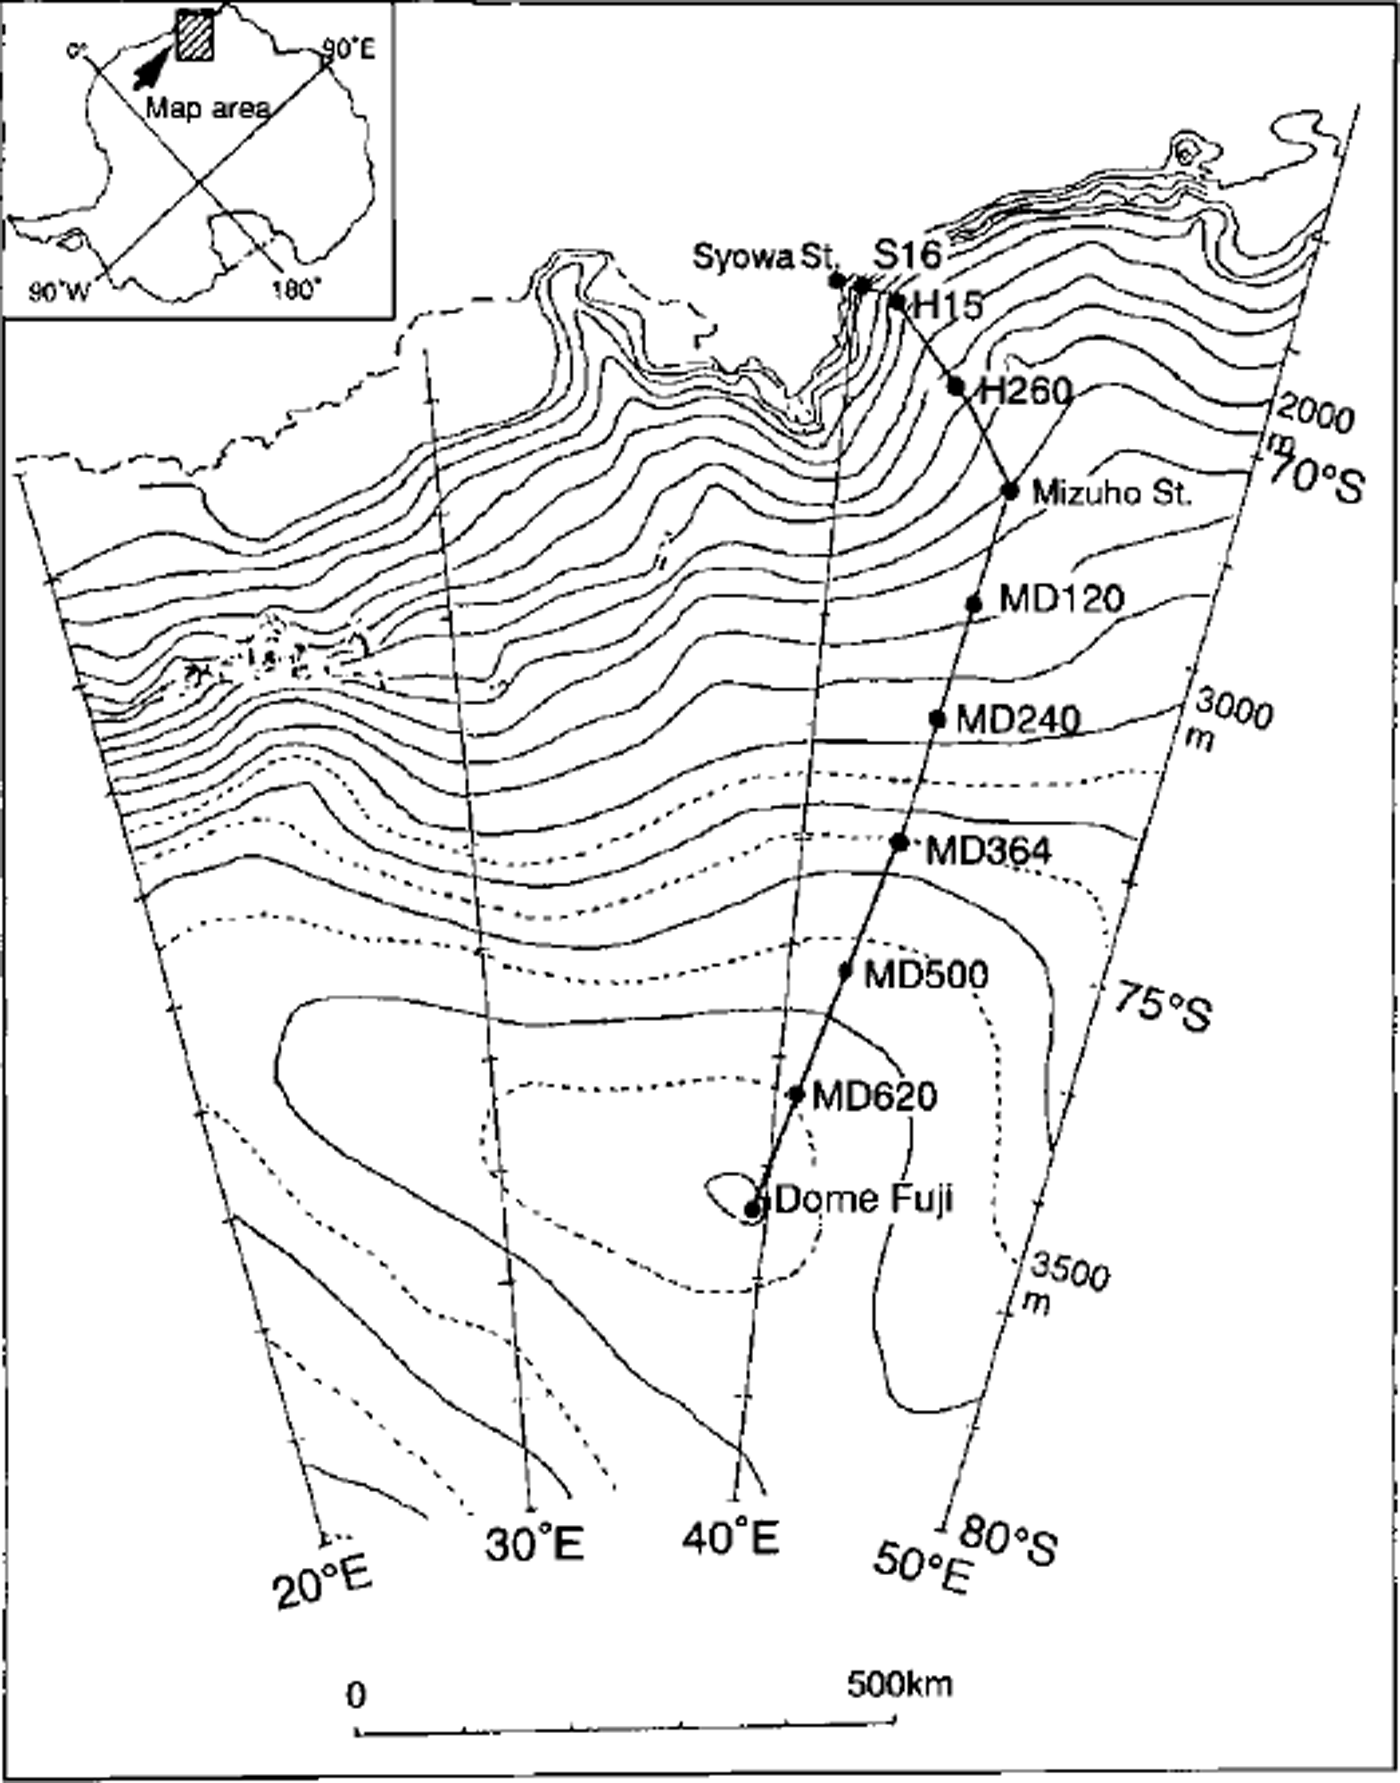
The Japanese Antarctic Research Expedition (JARE) has planned and executed the Dome Fuji Program, a comprehensive glaciological research project focusing on deep ice coring and analysis for retrieving past environmental information recorded in the Antarctic ice sheet. A continuous deep ice core down to 2503 m depth was recovered at Dome Fuji station, east Dronning Maud Land, Antarctica (77°19’01"S,39°42’12"E; 3810 ma.s.L; ice thickness, 3028 m; 10 m snow temperature −58°C) by using a JARE mechanical drill in a liquid-filled hole during the 1993-97 inland operations (Fig. 1). The core quality is excellent even in the brittle zone, 500-860 m deep, where the ice was fragile during the in situ core-cutting procedure (Dome-F Deep Coring Group, 1998; Dome-F Ice Core Research Group, 1998).

Fig. 1. Location of Dome Fuji station and traverse routes between Syowa, MiZuho and Dome Fuji stations.
Stable-Isotope Measurements
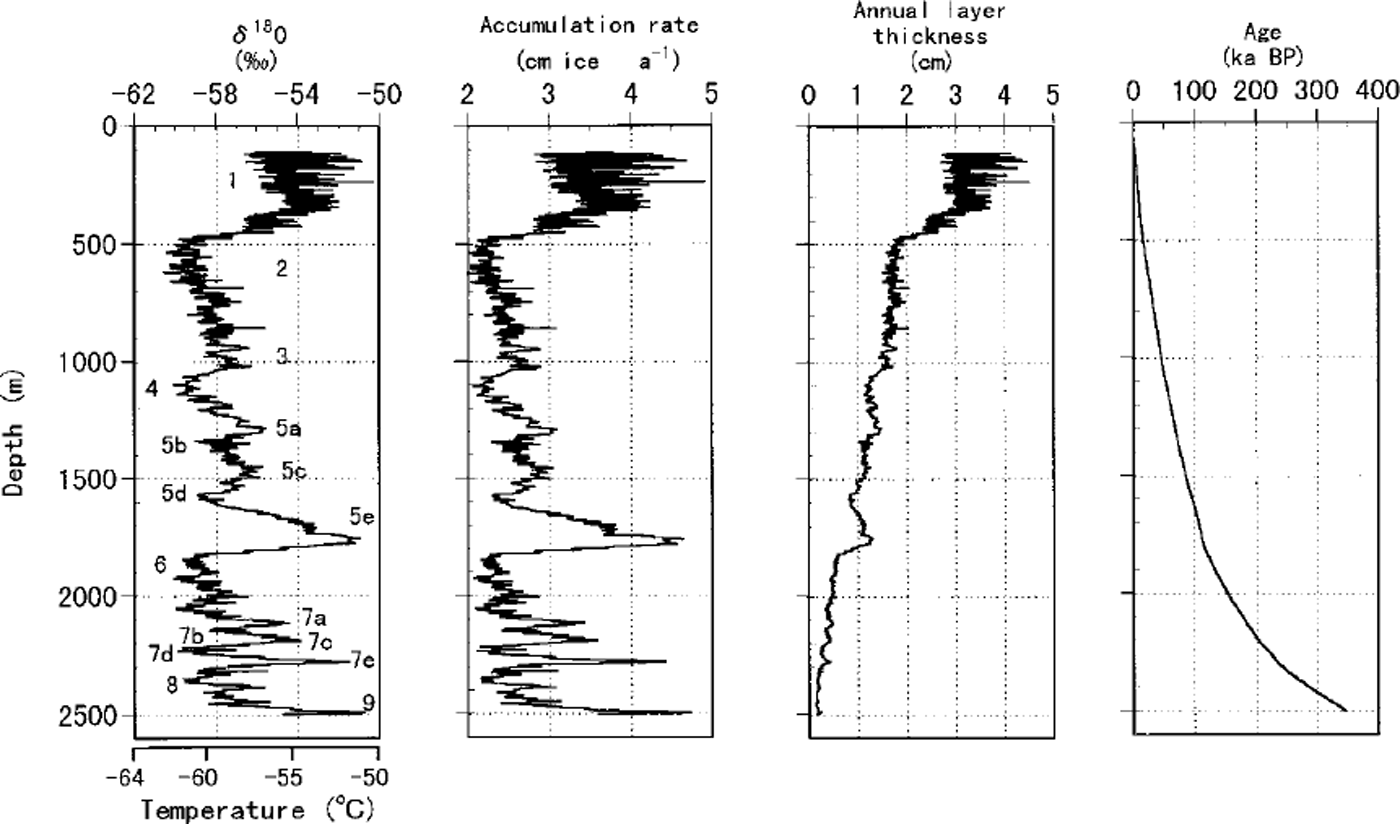
Oxygen-isotope measurements were made on 50 cm long samples selected from the entire core length. The present paper shows the results obtained from samples at 2.5 m depth intervals. The 18O/16O ratio obtained from each sample is converted to δ 18O, the relative deviation from that in Standard Mean Ocean Water (Fig. 2).

Fig. 2. δ180 and estimated accumulation-rate profiles, annual layer thickness profiles and an age-depth curve for the Dome Fuji deep ice core (preliminary results as of July 1998). 1-9, marine isotope stages.
Glaciological data for east Dronning Maud Land (EDML) have been produced by JARE field activities. A systematic glaciological survey has revealed characteristic features of accumulation rate, 10 m depth snow temperature and δ 18O distribution of the snow deposit, related to elevation. δ 18O is a function of the condensation temperature of vapor in the atmosphere, and the average δ 18O of the snow pit or surface snow core can be expressed in terms of the annual mean air temperature which is approximately equal to the 10 m depth snow temperature. An empirical equation was obtained for a relationship between accumulation rate, β (cm ice a−1), and δ 18O (‰) in the area above 2200 m a.s.l. as follows:
This empirical equation gives an accumulation rate of 3.11 cm ice a−1 at Dome Fuji (δ 18O = –54.1‰), which is within the range of 2.8-3.3 cm ice a−1 obtained by a study on a shallow core from Dome Fuji (Reference WatanabeWatanabe and others, 1997).
Another empirical relation obtained from the EDML glaciological survey was used to convert δ 18O (‰) to mean annual temperature (snow temperature at 10 m depth), T10 (°C) as
The β value calculated is also shown in Figure 2, where we assume that the spatial relationship (Equation (1)) is valid in the depth domain. This profile clearly shows three glacial-interglacial cycles.
Chemical Constituents
Chemical samples 7-10 cm long were cut from the core at intervals depending upon the depth. The surface 5 mm of chemical samples were scribed using a ceramic knife in a clean bench in a home cold laboratory. The firn sample was then stored in a Teflon sealed bottle and melted just before the measurement, as reported by Reference WatanabeWatanabe and others (1997). The ice sample was stored in a plastic bag and rinsed with ultra-pure water just before the melting and measurements.
The chemical constituents of the core samples were measured by ion chromatography (isocratic system for cations and gradient system for anions with Dionex DX-500, as reported by Reference WatanabeWatanabe and others (1997)). Ions measured were Na+, NH4 +, K+, Mg2+, Ca2+, F-, Cl−, SO4 2-, NO2 -, NO3 -, HCOO-, CH3COO-, C2O4 2- and CH3SO3 3-.
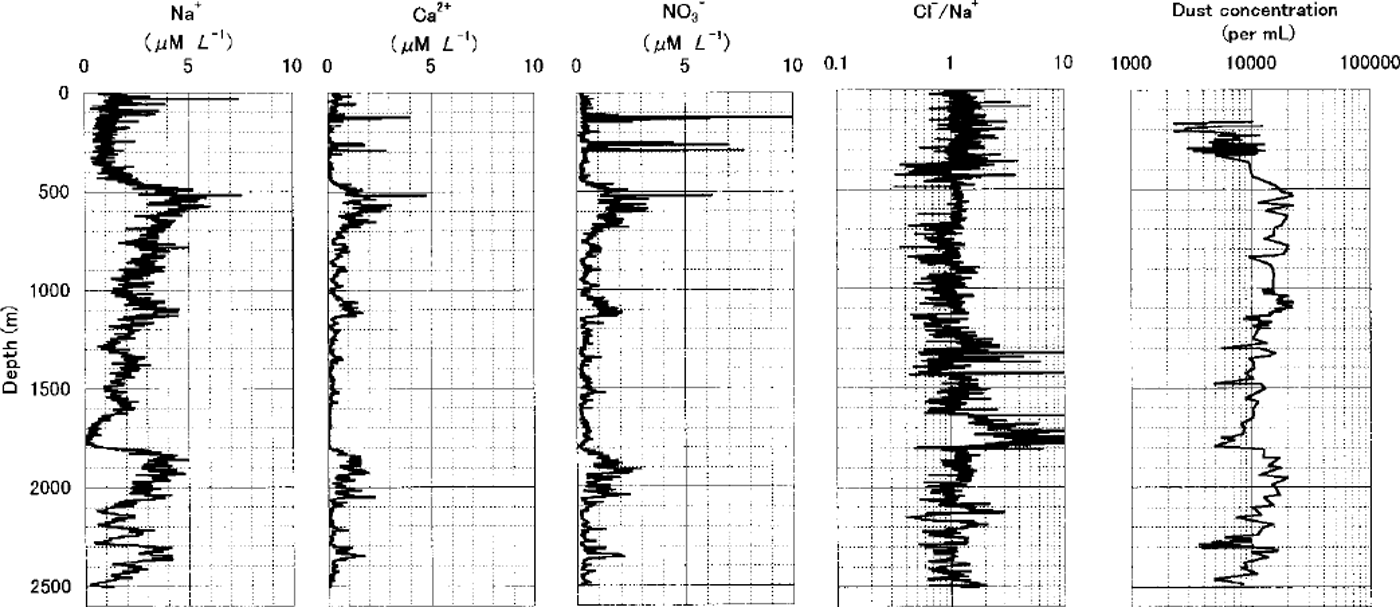
The chemical constituents originate from different sources. Na+ is of marine origin, Ca2+ is of crust origin and NO3 - comes from complex sources. These profiles are shown in Figure 3.

Fig. 3. Profiles of environmental signals in the Dome Fuji deep ice core (preliminary results as of July 1998).
Comparing these profiles with the oxygen isotopic profile shown in Figure 2, a negative correlation between Na+ and δ 18O through the glacial cycles and a positive correlation between Ga2+ and NO3- during the glacial stages are found. The Cl-/Na+ ratio during the glacial stages was close to the sea-water ratio (1.2 molar ratio). In contrast, lower concentrations of Cl- and Na+ and higher ratios of GT to Na+ are found during interglacial stages.
Dust Particle Analysis
Dust concentration and size distribution have been analyzed in ice sections 7 cm long at every 2.5 m interval along the entire core with a laser particle counting system (Met One Co., 9000 Series Liquid-borne Particle Counting System with Model 211 Light Scattering Sensor). As the core has no significant fractures, we assume that drilling fluid has not contaminated samples.
The total number per mL of dust particles larger than 0.52 μm in diameter is shown in Figure 3. Large dust concentrations occur in the depth ranges 500-820, 1050-1110, 1830-2200 and 2300-2350 m. The upper three spikes are similar to spikes appearing in the Vostok ice core. These occur during the colder phases of the glacial stages except in the first cold phase after the interglacial stage, probably due either to insufficient wind speed over the source area or to the fact that sea level was still high and the aridity was then not very different from that of the interglacial stage (Reference Petit, Mounier, Jouzel, Korotkevich, Kotlyakov and LoriusPetit and others, 1990). On the other hand, the lowest concentrations of dust occur in the Holocene (-380 m) and the interglacial stages (1740-1820, 2250-2320 and below 2460 m).
The ratio of average dust concentrations in sections for the Holocene (-360 m) to those for the end of the last glacial (430-700 m) is 1/2.5, compared to 1/6 for the Dome C core and 1/3 for the Byrd ice core (Reference Thompson and Mosley-ThompsonThompson and Mosley-Thompson, 1981)
Ice-Core Chronology
The time-scale of the Dome Fuji ice core was calculated by using Equation (1) and a steady-state ice-flow model. A simple Dansgaard-Johnsen model was used with ice thickness H = 3028 m and shear layer thickness h = 1200 m. The ice-equivalent thickness of the firn layer is 70.4 m (the boundary depth of the firn-ice layer is 106 m).
The ,5180 profile with the time-scale obtained is shown in Figure 2. The major features of the Dome Fuji ice core are as follows, (a) The ice core covers the past 340 ka including three glacial-interglacial cycles, (b) All major features of marine isotope stages (MIS) Nos 1-9 are recognized, although the temperature amplitude for long-term variations for Dome Fuji appears to be a few °C higher than that of the Vostok core, (c) The Eemian interglacial is located around 110-130 ka BP, which agrees with the Vostok data within 5 % uncertainty.
Further studies of the core chronology of the Dome Fuji deep ice core are required. Gross-correlation analysis with other core data obtained from comprehensive physical and chemical studies of the Dome Fuji deep ice core will reveal more detailed information on paleoclimate changes in the Southern Hemisphere.


