1 INTRODUCTION
The structure of elliptical galaxies, as inferred from surface brightness profiles, is the most direct method of deriving the size, luminosity, and density scale parameters that are key to understanding the details of galaxy formation. This type of information has become increasingly important as our successful ΛCDM cosmological simulations begin to focus on smaller scale cluster- and galaxy-sized predictions (Tonini et al. Reference Tonini, Maraston, Thomas, Devriendt and Silk2010; Trujillo-Gomez et al. Reference Trujillo-Gomez, Klypin, Primack and Romanowsky2011). Current formation scenarios range from gravitational collapse on short timescales to extended structure evolution by mergers of gas-rich (wet) and gas-poor (dry) companions in a hierarchical fashion (Steinmetz & Navarro Reference Steinmetz and Navarro2002). Determining the characteristics of structure in present-day galaxies is also a critical step to understanding structural changes at high redshift (Chevance et al. Reference Chevance2012).
The interpretation of surface photometry commonly uses fitting functions, which were introduced to surface brightness profiles to provide parameterisation after it was discovered that ellipticals varied in structure in a uniform fashion with size or luminosity. A simple set of parameters would allow for a quantitative classification of ellipticals and the identification of structure components that might be related to kinematic properties. In addition, describing structure with fitting functions provides an avenue to locate evolutionary signatures (such as mergers, dust lanes, or tidal interactions) and allows for comparison with theoretical predictions of galaxy structure (Mosleh, Williams, & Franx Reference Mosleh, Williams and Franx2013). Ultimately, a uniform structure described by a simple function implies homology for galaxy formation (Bertin, Ciotti, & Del Principe Reference Bertin, Ciotti and Del Principe2002) with the hope of revealing a universal profile shape that reflects the underlying baryonic and dark matter distributions (Navarro, Frenk, & White Reference Navarro, Frenk and White1997; Merritt et al. Reference Merritt, Graham, Moore, Diemand and Terzić2006), although similarity may be a function of both structure and kinematics (Navarro et al. Reference Navarro2010).
The mechanical goal of fitting functions is to reduce the 2D shape of the surface brightness profile to a set of simple parameters that are mathematically related. This would, in effect, allow for the complete reconstruction of the luminosity density of a galaxy from a small set of values. However, simply finding a spline-like function that matches all the data points is inadequate for a description of a profile as it would have too many variables and does not allow meaningful comparison of those values with other photometric or kinematic properties of galaxies. The mathematically simplest formula is expected to be the one that provides the greatest correlation between structural and photometric characteristics and, therefore, revealing more of the underlying physics.
The history of fitting functions is tied to the technological progress of galaxy photometry from the early days of photographic plates to the advent of electronic detectors (e.g., CCDs). Through the infancy of galaxy photometry, the fitting functions for ellipticals progressed from the Reynolds (Reference Reynolds1913) model, to Hubble's (Reference Hubble1930), a modified Hubble (Rood & Sastry Reference Rood and Sastry1972), and lastly a truncated Hubble model (Oemler Reference Oemler1976; see Graham Reference Graham2011 for a complete review). Parallel to these efforts, which focused on the halo fits (the region beyond the half-light radius) in order to reveal mass density, was the r 1/4 law developed by de Vaucouleurs (Reference de Vaucouleurs1953) primarily to confine the curves of growth for aperture photometry.
The r 1/4 surface brightness law, as first outlined by de Vaucouleurs (Reference de Vaucouleurs1948), was first reinforced as the fitting function of choice by its excellent representation of the deep surface photometry of NGC 3379 (de Vaucouleurs & Capaccioli Reference de Vaucouleurs and Capaccioli1979). While shown to be inadequate for dwarf ellipticals, the popularity of the r 1/4 law continued into the 1980s to the point where it was considered a universal fit to all ellipticals, and deviations from a r 1/4 fit were interpreted as the result of tidal interactions (Kormendy Reference Kormendy1977).
The universality of the r 1/4 law was questioned with the discovery that its two variables, effective radius (r e) and surface brightness (μe), were coupled and decreased the meaning of their correlations (Kormendy Reference Kormendy, Crane and Kjar1980; Schombert Reference Schombert1986). In addition, it was shown in Schombert (Reference Schombert1987) that ellipticals deviated from the r 1/4 law in a systematic fashion with luminosity. Clearly, two parameters were insufficient to adequately describe the structure of ellipticals over a full range of luminosities, even excluding dwarfs and giant cD galaxies (Schombert Reference Schombert1987).
The need for additional parameters to capture additional shape beyond the r 1/4 law resulting in the adoption of the Sérsic (Reference Sérsic1963) generalisation, a r 1/n model, where effective radius and surface brightness are joined by a concentration variable, n. This fitting function has the immediate advantage in that the Sérsic r 1/n model runs from exponential (i.e., n = 1, well suited for disk galaxies and dwarf ellipticals) to r 1/4 (i.e., n = 4) and higher values of n for brighter luminosity ellipticals. Another benefit of the Sérsic r 1/n model was its application as a photometric plane for ellipticals (Graham Reference Graham2002), an analogous relation to the Fundamental Plane. Extensions of the Sérsic r 1/n model are used to interpret high-resolution space imaging (Graham Reference Graham, Jerjen and Binggeli2005), but our study focuses only on the outer regions of ellipticals.
The goal of this paper, the second in our series on the structure of galaxies, is to examine the usefulness of fitting functions in describing the outer isophotes of ellipticals. The success of the Sérsic r 1/n model for parameterising the core regions (those regions inside the half-light radius, typically between 4 and 6 kpc) of ellipticals is well established (Graham & Guzmán Reference Graham and Guzmán2003). However, a majority of those studies focus on the inner isophotes, at the sacrifice of information from the halo. In this paper, the usefulness of both the r 1/4 law and the Sérsic r 1/n model to the halos of ellipticals will be examined, and what scaling relations can be extracted for this most common type of galaxy in rich, dense environments.
2 DATA
As described in Schombert & Smith (Reference Schombert and Smith2012, hereafter Paper I), the images for this study are taken from the 2MASS Image archive. The 2MASS project was a NASA ground-based, all-sky, near-IR sky survey (Skrutskie et al. Reference Skrutskie2006). 2MASS uniformly scanned the entire sky using two 1.3-m telescopes (north KPNO and south CTIO). Each telescope was equipped with a three-channel camera, where each channel consists of a 256 × 256 HgCdTe detector. Each camera was capable of observing the sky simultaneously at J (1.25 μm), H (1.65 μm), and K (2.17 μm). The 2MASS arrays imaged the sky in a drift-scan mode. Each final pixel consisted of six pointings on the sky for a total integration time of 7.8 s per pixel. The final image frames have a plate scale of one arcsec per pixel with typical depth of 24 J mag arcsec−2 (errors at 0.5 mag).
The sample was selected by morphological criteria from the Revised Shapley-Ames (RSA) and Uppsala Galaxy Catalogs (UGC). All the galaxies must be pure ‘E’ classification in both catalogs. In addition, the selected galaxies had to be free of nearby companions or bright stars which might disturb the analysis of the isophotes to faint luminosity levels and sufficiently small in angular size to cover only two 2MASS strips. The final sample contained 428 galaxies and covers apparent J magnitudes from 7 to 11.5 and absolute J magnitudes from −21 to −26. In the process of reducing the surface brightness profiles, it was found that the galaxies divided into two subsamples that will be discussed in Paper III (J. M. Schombert, 2014, in preparation). For this study, 311 clean ellipticals with clear single component profiles were isolated.
Images from 2MASS for regions around all the galaxies in the sample were downloaded from 2MASS's Interactive Image Service. These sky images were flattened and cleaned by the 2MASS project and contained all the information needed to produce calibrated photometry. The images were analyzed as described in Section 3 of Paper I. All the reduced photometry can be found at our data website (http://abyss.uoregon.edu/~js/sfb).
3 r 1/4 FITS
Since the r 1/4 law was the fitting function of choice for many decades, this function was fit to all the galaxies in our sample. The shortcomings to the r 1/4 law are well documented in Graham (Reference Graham2011) and, in particular, it was shown by Schombert (Reference Schombert1986) that ellipticals are only r 1/4 in shape for a very limited range of surface brightness (typically between 21 and 24 V mag arcsec−2) and for a limited range in total luminosity (i.e., galaxies less than MV = −20.5 have no portion of their surface brightness profiles which are r 1/4 in shape).
Following the prescription of Schombert (Reference Schombert1986), only that portion of the surface brightness profile which is linear when plotted in the r 1/4 space is fit. This can be done in a subjective manner by visually selecting the inner and outer radii in a plot of μ versus r 1/4, or can be automated by restricting the fit to between 19 and 22 J mag arcsec−2 and searching for the best linear region. Either method produces identical results in terms of similar structural correlations.
Figure 1 displays all the galaxies in our sample, normalised for their best r 1/4 fit. Only data at radii greater than 2 arcsec are displayed to avoid seeing effects. The deviations from r 1/4 are clear to see in this figure, being typically higher in surface brightness at large radii than the r 1/4 law for bright galaxies, less than the r /4 law for faint galaxies. However, for the restricted range of surface brightness, the r 1/4 law is a good description of the interior structure of ellipticals.
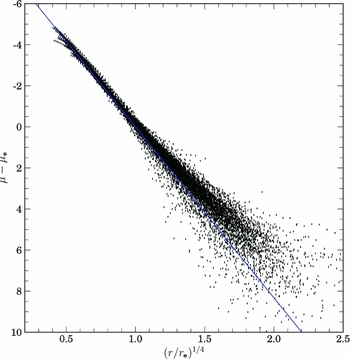
Figure 1. The surface brightness profiles of all 311 ellipticals in our sample normalised to their best r 1/4 fit. The blue line indicates the exact r 1/4 shape, and it is clear that most ellipticals deviate above the r 1/4 law at large radii and that the r 1/4 shape fails for the inner regions (r < 2 kpc). However, despite its limitations for outer isophotes, the r 1/4 shape is so consistent for the middle regions that this fact must be address by any structural model.
It is surprising that the arbitrary nature of the fitting process results in similar structural relations (e.g. Figure 3). However, this is due to the coincidence of interior versus outer structure in ellipticals as compared with the r 1/4 law. Ellipticals, typically, will have some downward turn in surface brightness in their interior regions due to having interior structure following a Sérsic model with n < 10 (Graham Reference Graham2011). Likewise, there is an upward turn in surface brightness at outer radii, as can be seen in Figure 1. This will result in a natural bias toward steeper slopes as one includes interior and exterior data. PSF effects can also contribute to this problem and, as shown in Paper I, 2MASS images have measurable PSF distortions out to 4 arcsec. PSF errors will distribute core luminosity outward, producing a shallower slope for inner isophotes.
An illustration of this effect is seen in Figure 2, where the surface brightness profile of NGC 4187 is plotted in the r 1/4 space. A straight line is a good match to the r 1/4 law, as is shown by the blue line (fit range indicated by blue arrows). However, a formal fit that includes only a few more interior and exterior points (the red line and red arrows) results in a fit that is 20% larger in effective radius (r e) and an effective surface brightness (μe) that is 35% fainter. When previous studies referred to the coupling of r 1/4 parameters (Trujillo, Graham, & Caon Reference Trujillo, Graham and Caon2001), it is this effect that causes the coupling. Notice that the bias in r e and μe results in the change in the measured structural parameters that is nearly parallel to the overall relationship between r e and μe (the errors in the fit produce a ΔΣ ∝ Δr −2, where the relation in Figure 3 is Σ e ∝r −3 e), and is one of the main reasons the scatter is so small over such a large range in galaxy size and luminosity.
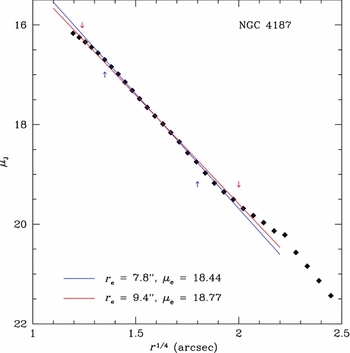
Figure 2. An example of the difficulty in finding correct r 1/4 fits for most ellipticals. The typical behavior for an elliptical profile is to curve fainter toward the core and brighter in the halo. This results in a subjective decision on which isophotes to use for fitting. The two ends drive r e and μe to larger values, although in such a fashion as to preserve the photometric μe–log r e relation. The arrows indicate the range of isophotes used for each fit.
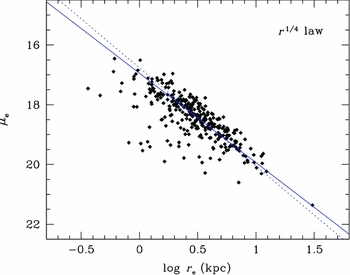
Figure 3. The correlation between effective radius (r e) and effective surface brightness (μe) for r 1/4 fits. The blue line is a jackknife linear fit, and the dashed line is the relation from Kormendy & Freeman (Reference Kormendy and Freeman1997) corrected for a mean B − J color of 3.5. Despite different fitting techniques, three decades in time, and 5000 Å in wavelength, the same relationship is found for the 2MASS sample as the Kormendy sample.
The resulting structural scaling relation, log r e versus μe, is shown in Figure 3. A jackknife linear fit gives μe = 2.99 ± 0.04 log r e + 16.95 ± 0.02. Also shown in the figure is the relationship from Kormendy (Reference Kormendy1977), corrected to an Ho = 72 and a B − J color of 3.5 (μe = 3.28 log r e + 16.77). The outliers with small r e and faint μe values are galaxies where, even with fitting restrictions, they are not well fitted by the r 1/4 law in any region of their surface brightness profile. The correlation is real from the UV to the near-IR, but the low scatter is, in some part, due to the coupling of the fit parameters. The structural values for a particular galaxy are much more uncertain than indicated by the tightness of the correlation.
The quality of the correlation underlies the success of the r 1/4 law for many years. For, even though the r 1/4 law systematically fails to fit the outer portion of ellipticals, it does fit the middle portions where a majority of the light is located. The two fit variables give a crude map of the galaxy shape and correlate with various global parameters, such as total luminosity. So the r 1/4 law, although it fails as a descriptor of central concentration and halo extension, does serve as a basic indicator of mean galaxy size and luminosity density. However, the inclusion of low-luminosity ellipticals, which have no region of their profiles which are r 1/4 in shape, will destroy this relationship.
4 THE SÉRSIC r 1/n MODEL
The success of the Sérsic r 1/n model derives primarily from the fact that it has an additional fitting parameter providing an extra degree of freedom. This immediately addresses the problem with the r 1/4 law in the outer regions by supplying more flexibility to the fitting function at large radii. However, a difficulty for the Sérsic r 1/n model is that the n parameter is sensitive to both the inner and outer shape of a galaxy profiles in a dependent fashion (see Graham & Driver Reference Graham and Driver2005 for a full review of the characteristics of the Sérsic r 1/n model). As can be seen in Figure 4, the n index drives the inner and outer profile fits upward (brighter) in surface brightness for higher values of n (higher n equals more concentration of central light). Normal PSF and core effects (e.g., coreless versus core ellipticals; Kormendy et al. Reference Kormendy, Fisher, Cornell and Bender2009) would serve to drive n downward, while extended halos would drive n upward. Thus, there is no expectation that n inner values are the same as n outer values. An additional problem arises in that, when fitting the entire profile, inner data points have smaller errors (plus more numerous data points as ellipse fitting in high luminosity regions are more compressed) and, therefore, are given greater weight to most fitting algorithms.
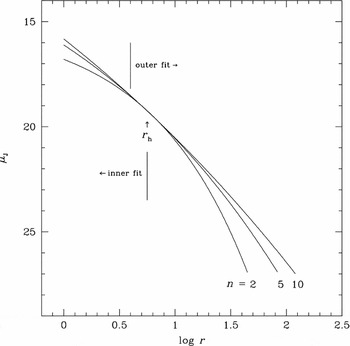
Figure 4. The behavior of the Sérsic r 1/n model n index for typical values of μe and r e. Lower n provides more curvature to a profile shape, particularly useful for fitting low-luminosity ellipticals and the core regions (r less than the half-light radius, r h) of normal ellipticals. However, the outer isophotes of most ellipticals have shallower slopes (i.e., higher n values) producing a conflicting fitting process where lower scatter (e.g., greater weight) core regions drive n downward and shallower outer regions, but with higher uncertainties, drive n to higher values. The regions for our inner and outer fits are indicated with respect to the half-light radius, r h.
For comparison, all 311 ellipticals were fitted with a Sérsic r 1/n model from the inner 5 arcsec out to the half-life radius (r h, this typically corresponds to a surface brightness of μ J = 20). This inner fit sample is then compared with a sample which is only fit from the point where the surface brightness profile becomes r 1/4 in shape outward (this was between 3 and 5 kpc) to the outermost data points. All the fits use the isophote errors (mostly the error in the sky value) to weight the data points. Note that n values above 10 are effectively identical as their differences are asymptotically smaller for higher n.
Unsurprisingly, the inner fit sample displays decreased r e (by 60%) and brighter μe (by 70%, on average) compared with fits made to the halo (i.e., the inner and outer regions are not fitted by the same model). As seen in Figure 5, the n index is smaller for interior fits by an average of 80%. This result is also independent of the fitting constraints, for fits made to the entire galaxy profile simply resulted in Sérsic r 1/n model parameters identical to the inner fits as the outer data points had greater photometric errors and were given less weight by the fitting algorithms.
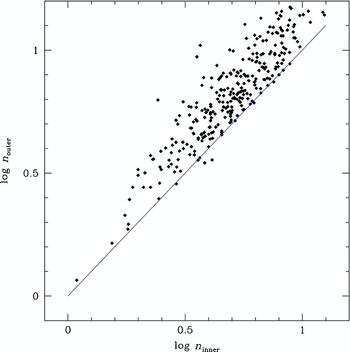
Figure 5. The different Sérsic r 1/n model n values obtained by fitting on the inner surface brightness profile (from 2 arcsec to the Holmberg radius, 22 J mag arcsec−2) versus outer fits (from the r 1/4 region to the outermost isophotes). The shallower halos drive the n index to 80% larger, on average, from the steeper core fits. This effect makes the Sérsic r 1/n model ineffective as a universal description of the full luminosity density profile of an elliptical.
The systematically different n values between inner and outer fits imply that it is impossible to find a photometrically correct match to an entire elliptical surface brightness profile with a single component Sérsic r 1/n model. It should be noted that n inner is weakly correlated with n outer in Figure 5, but the variance is too great for a single component fit. The effect on scaling relations can been seen in Figure 6, the Sérsic r 1/n model effective radius (r e) versus the n index. When the fits are restricted to the inner regions, n serves as a concentration index and has a fair correlation with the effective radius, which is a measure of the scale size of the galaxy (Trujillo et al. Reference Trujillo, Graham and Caon2001). However, when the fits are restricted to the outer regions, the correlation with effective radius degrades, n serving as a measure of the shape of the halo, and becomes very sensitive photometric errors from low surface brightness areas.
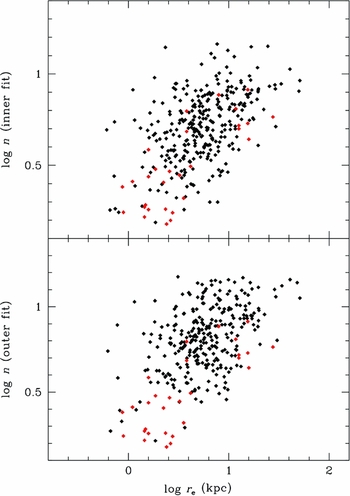
Figure 6. The effective radius–Sérsic r 1/n model n index scaling relation for n values determined from inner fits (top panel) versus outer fits (bottom panel). The typically shallower profiles for ellipticals drive n to larger values for outer fits. While the correlation is still evident, the scatter is much larger than for inner fits. The Caon et al. data are shown as red symbols, based on high-resolution inner fits.
The method of fitting will also clearly influence the results. For example, in Figure 6, the data from Caon, Capaccioli, & D'Onofrio (Reference Caon, Capaccioli and D'Onofrio1993) are shown and clearly agree with the inner fit distribution (although the correlation is less evident than for the Caon et al. data). However, the Caon et al. data have lower n values than those deduced for the outer fit sample, emphasising the importance of n as a concentration indicator for the core region of galaxies (Graham & Guzmán Reference Graham, Guzmán, Block, Puerari, Freeman, Groess and Block2004). PSF effects are a concern with 2MASS images, but the same difference in n inner versus outer n outer is evident even when the inner cutoff for the fit is varied.
For the rest of the analysis in this paper, the Sérsic r 1/n model is constrained to overweight the outer regions during fitting by restricting the fit to only those points from the midpoint of the r 1/4 region to the halo. In other words, the fitting is performed from the radius where the inner isophotes become r 1/4 and continue outward, weighted by surface brightness error for the outer points. This inner limit is always beyond 5 arcsec, so PSF effects are negligible. Other inner radii were tested, for example, 1/4r h, but all produced similar results. The resulting Sérsic r 1/n parameters (r e, μe, and n) are shown in Figures 6 and 7.
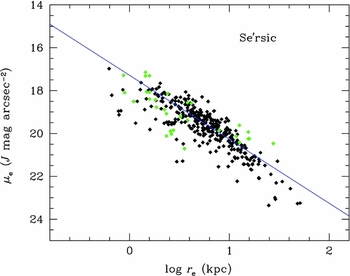
Figure 7. The correlation between effective radius (r e) and effective surface brightness (μe) for the Sérsic r 1/n model fits. The blue line is a jackknife linear fit, resulting in a similar relation to the r 1/4 fits in Figure 3. The green symbols are the data from Caon et al. corrected for color.
Immediately obvious from Figure 7 is that r e and μe have a similar correlation as found from the r 1/4 fits. The slopes are identical, but the zero-point is shifted by 0.3 mag fainter. Even though the n index has a great deal of scatter, μe and r e are well correlated and, again, the low scatter is assisted by the coupling of μe and r e. While the additional free parameter increases the quality of the fits for the Sérsic r 1/n model (as measured by χ2), in fact, there is no significant increase in the quality of the μe versus r e diagram over r 1/4 fits.
The Sérsic n parameter is weakly correlated with r e (Figure 6) and μe; however, the correlation is much weaker than that found by Caon et al. (Reference Caon, Capaccioli and D'Onofrio1993), shown as red symbols in Figure 6. Much of this difference is, of course, that Caon et al. focus on the use of n as a central concentration parameter, giving higher weight to the inner isophotes of a galaxy. Our procedure, to ignore inner isophotes, uses n as a shape parameter for the halo. This appears to have the consequence of decoupling n from r e and μe since these latter parameters are more strongly influenced by inner isophotes than outer ones (see later).
The weakness of the Sérsic n parameter is also related to the large variance in fit parameters for similar quality fits. Figure 8 displays the χ2 space around a range of r e, μe, and n values for NGC 7626. The χ2 test is not the optimal method for determining a best fit to a surface brightness profile as it assumes that the errors in the photometry are Gaussian and random when, in fact, the errors at faint light levels are dominated by systematics in the sky value (Paper I). However, it does have the advantage of simply comparing the fit to the data as a measure of the total residual value, and a straightforward weight by sky error can be applied to the outer isophotes. There is no attempt herein to assign a minimal χ2 value for an adequate fit, merely to use χ2 for comparison between various fit parameters.
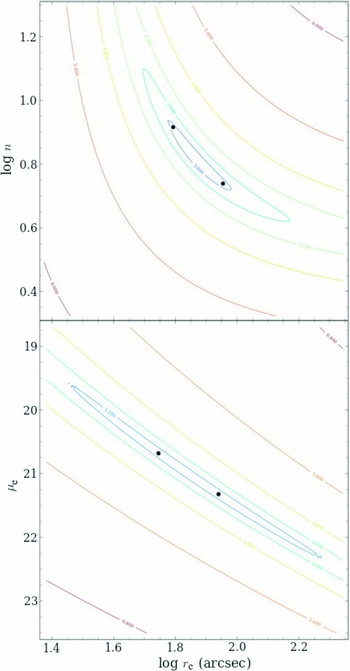
Figure 8. The χ2 parameter space for the Sérsic r 1/n fits to NGC 7626 plotted against effective radius (r e), effective surface brightness (μe), and the n index. Contour lines correspond to lines of constant fit quality, χ2, the square of the difference between the fit and the actual data. The regions of best fit between r e and μe are long, narrow ellipses, meaning that there is a wide range of these parameters that produce equally good fits. Likewise, the χ2 contours for the n index display a non-linear coupling with r e. The two indicated fits (black symbols) are the fits shown in Figure 9.
As can be seen in Figure 8, the χ2 determination for each fit is very shallow, and the slope of the error ellipse is roughly μe∝−3.1log r e compared with the correlation slope (Figure 7, μe∝−3.0log r e). This means that, like the r 1/4 law, small errors in μe and r e vary the parameters along the correlation and errors in the fitting procedure work to reinforce the relationship. Likewise, small changes in μe and r e also result in the n index varying in a non-linear fashion (top panel).
In fact, a wide range of Sérsic parameters equally fit the profiles within the errors of the data. One example is found in Figure 9, where the two fits (indicated in Figure 8 as black symbols) are mapped onto the profile. There is a negligible difference in the quality of the fits, even though the fit parameters vary by up to 40%. While the fit shown in blue is numerally superior to the fit shown in red, within the errors of the photometry either fit is equally valid. Yet, there is a significant difference in the fit parameters whose coupling allows for a much broader range in good fits than one would find acceptable as an analytic technique. The formal errors on the fits do not take this coupling into account, and the true uncertainties in the fitting parameters are much larger than quoted by many authors.
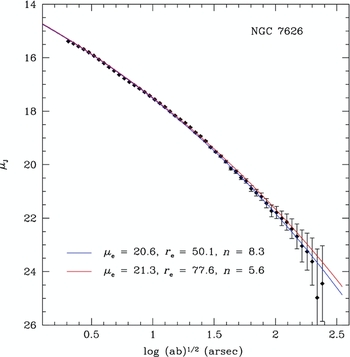
Figure 9. The two Sérsic r 1/n model fits shown in Figure 8 for NGC 7626. While the blue fit has a slightly better χ2 value, it is clear that, within the photometric errors, either fit is equally valid. Yet, the fit parameters (μe, r e, and n) vary by 40%.
5 THE PHOTOMETRIC PLANE
Following the technique outlined in Graham (Reference Graham2002), the best-fit Sérsic r 1/n model parameters have been converted into ‘photometric plane’ (PP) values. The PP is the photometric version of the Fundamental Plane, first presented by Djorgovski & Davis (Reference Djorgovski and Davis1987). For the PP, the n index serves as a proxy for velocity dispersion, which produces an immediate observational advantage as photometric data are much easier to acquire than spectroscopic values. As our n values are not as tightly tied to the interior concentration of an elliptical, it was not immediately obvious that the same photometric relations as found by Graham (Reference Graham2002) could be extracted, although there is a weak connection between n inner and n outer.
A best fit to PP values yields r e∝n 1.28±0.05Σ0.48±0.03 e shown in Figure 10. Also shown are the Caon et al. data, corrected to J with a B − J = 3.5 color. It is somewhat surprising that the near-IR PP exists in our sample as our n values are based on outer fits, whereas the original PP was based on n values that were weighted toward inner regions. Our difference in slope for the n index is primarily due to our different fitting methods, with our n values are larger, on average, than Caon et al. fits.
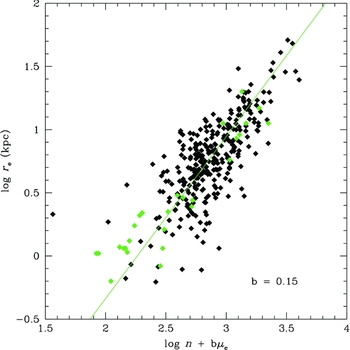
Figure 10. The photometric plane, first proposed by Graham (Reference Graham2002), as a correlation between scale length (r e) and a linear combination of the concentration index n, and luminosity density (μe). The green line is a linear fit to the RMS minimised value of b = 0.15. Green data are the original Caon et al. ellipticals used to formulate the original photometric plane (corrected for a B − J color).
Interior fits are probably superior for the PP and discussions of its meaning with respect to the specific entropy of an elliptical (the Entropic Plane; Lima Neto, Gerbal, & Márquez Reference Neto, Gerbal and Márquez1999) since the interior shape of an elliptical more closely reflects the majority of the gravitational potential. In addition, the original motivation for the PP was the strong correlation between galaxy velocity dispersion and n. Our use of n as an outer profile shape parameter decouples that strong relationship and makes the PP less useful as the outer regions are strongly influenced by post-formation processes.
Despite the differences in the n values, the PP in Figure 10 displays a fair correlation. Errors in r e and μe track along the correlation, but most of the error budget is tied to the uncertainties in n. Typical 3σ fit ranges are 0.14 in log r e, 0.5 in μe, and 0.1 in log n. This results in an uncertainty in the log n + bμe axis of approximately 0.2, which would explain most of the scatter in Figure 10. As the near-IR bands quickly redshift out of the observational windows, the near-IR PP is probably not as useful as a distance indicator as the optically determined version.
6 SCALING RELATIONS
The goal of structural analysis of ellipticals is to search for various scaling relations (Graham Reference Graham2011) that serve to outline a uniform sequence of structural and luminosity (stellar mass) properties that ultimately demonstrate structural homology and might be predicted by galaxy formation models. Before beginning this analysis, it should be noted that the sample used in this study only outlines the upper end of the luminosity function of ellipticals, those ellipticals brighter than −18 B mag (−21.5 J mag). Only 7% of our sample is faint enough to be classified as a low mass or dwarf elliptical. Thus, many of the issues outlined by Kormendy et al. (Reference Kormendy, Fisher, Cornell and Bender2009) and Graham (Reference Graham2011) concerning the dichotomy of bright and faint ellipticals are not addressed by our sample.
Perhaps the simplest structural parameters are the total luminosity (a proxy for total stellar mass) and total galaxy size. Although our technique to use asymptotic functions, guided by a galaxy's surface brightness profile, produces highly reliable total magnitudes, this technique does not lead to accurate total radii. This is easy to see in the sense that small errors in the outer profile will not significantly alter the luminosity (as the light levels are lowest). However, since the curve of growth flattens at large radii, small errors in luminosity will lead to large variations where one would define that last isophote. Instead, the half-light radius (r h) was selected because this has a lower uncertainty and it can be compared with the effective radius as defined by the r 1/4 and Sérsic r 1/n functions.
The luminosity–radius relation is shown in Figure 11, where the top panel displays the empirical half-light radius (r h) which is the point where the integrated light of the elliptical is 1/2 the total luminosity (MT ). The bottom panel displays the total luminosity versus effective radius r e from Sérsic r 1/n model fits. This diagram is very similar to the original luminosity–radius diagram published in Schombert (Reference Schombert1987, Figure 8) based on V photographic photometry. As in the original V study, the correlation with radius appears to break into two separate relationships for the bright and faint ends at approximate MT = −24 J. The break outlines the conflict between the relationship of L ∝ r 1.6, found by Strom & Strom (Reference Strom and Strom1978), and the shallower relationship of L ∝ r 0.7, found by Kormendy (Reference Kormendy1977) and Bernardi et al. (Reference Bernardi, Hyde, Sheth, Miller and Nichol2007). Our original study measured the break at −20.5 in V, which corresponds to −24 J in Figure 11. The interpretation of this effect is that bright ellipticals are more extended than their lower luminosity counterparts, and is a prediction of dry merger scenarios (Schombert Reference Schombert1987).
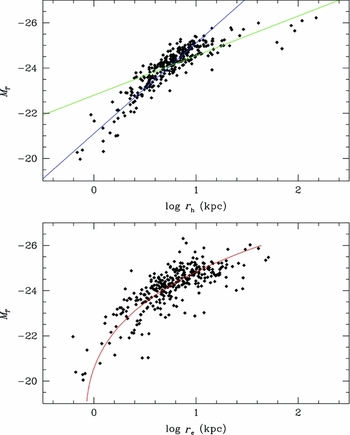
Figure 11. The luminosity–radius relation using the empirically determined half-light radius (r h) and the effective radius (r e) from Sérsic r 1/n model fits. The blue line represents the L ∝ r 0.7 (Kormendy Reference Kormendy1977; Bernardi et al. Reference Bernardi, Hyde, Sheth, Miller and Nichol2007). The green line represents L ∝ r 1.6 (Strom & Strom Reference Strom and Strom1978). The break at MT = −24J was first discovered by Schombert (Reference Schombert1987). The bottom panel displays luminosity versus effective radius with the red line being the relationship from Graham & Guzmán (Reference Graham and Guzmán2003).
The difference between bright and faint ellipticals is less obvious in the bottom panel, the luminosity versus effective radius (r e) diagram. Also shown in that panel is the relationship outlined by Graham & Guzmán (Reference Graham and Guzmán2003), corrected for a mean B − J color of 3.5, a distinctly non-linear relationship that connects bright and dwarf ellipticals. While the data agree with the Graham & Guzmán relationship, the scatter is much larger than the luminosity versus half-light radius diagram. Data points farther from the relationship are not poorer fits to the Sérsic r 1/n model, so poor fitting does not explain the scatter, but probably reflects the poor match between the Sérsic r 1/n model and outer isophotes.
The luminosity versus half-light and effective surface brightness relation is found in Figure 12. Here, the half-light surface brightness (μh) is defined as the surface brightness of the galaxy at the half-light radius (r h). The effective surface brightness (μe) is derived from Sérsic fits. There is no expectation that the luminosity–surface brightness relation be linear (although a linear fit can be made), certainly not by an extrapolation of the relationship of dwarf ellipticals (Graham & Guzmán Reference Graham and Guzmán2003), whose relationship is shown by the red line in both plots. While both distributions display similar shape, again, the scatter in the empirically determined μh is less than μe. And, again as with the luminosity–radius diagram, there is a break at MT = −24, where the data maintain constant surface brightness for decreasing luminosity.
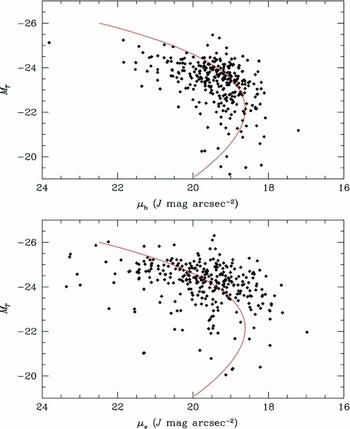
Figure 12. Total luminosity versus half-light and effective surface brightness. The half-light surface brightness (μh) is simply the surface brightness of the galaxy profile at r h. The red line is the relationship between luminosity and surface brightness found by Graham & Guzmán (Reference Graham and Guzmán2003).
The correlation between surface brightness and scale length (μe, r h, and r e) is shown in Figure 13 (the same as Figure 7 for the Sérsic parameters). As with the previous diagrams, the scatter is less for the empirically determined half-light radius (r h), reflecting the added uncertainty induced by fitting functions which are not necessarily an adequate description of the shape of the galaxy's profile. Previous work found this relationship to be linear (Schombert Reference Schombert1987), but extensions to dwarf ellipticals (Graham & Guzmán Reference Graham and Guzmán2003) find that the correlation must drop in effective surface brightness at small effective radii in order to make a continuous sequence from bright to faint ellipticals.
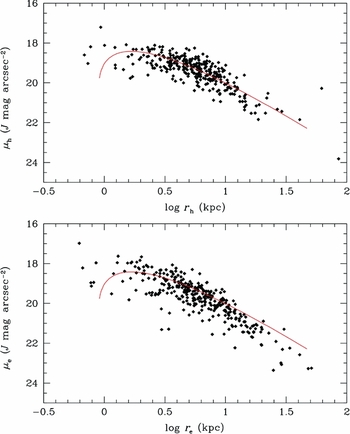
Figure 13. Surface brightness versus scale length comparing empirical half-light values with Sérsic fit values. The red line is from Graham & Guzmán (Reference Graham and Guzmán2003). The apparent linear relation is, in fact, simply the bright end of a more complicated relationship that decreases in effective surface brightness for dwarf ellipticals (not shown).
As noted by Graham (Reference Graham2011), the non-linear relations for μe versus luminosity, and r e versus luminosity, effectively guarantee that μe and log r e will be non-linear as well. The Graham–Guzmán color-corrected relationship for μe versus r e is shown in Figure 13 and, interestingly, fits the empirical μh versus r h better than the Sérsic parameters. The change from a linear slope at large r e to a flattening relationship of constant μe at small r e is well explained by the Graham–Guzmán curve.
The remaining scaling relations between MT , μe, and r e and the concentration index n are shown in Figure 14. Unlike the well-defined correlations found by Graham & Guzmán (Reference Graham and Guzmán2003; shown as red lines in the figure), the relationship between n and the other photometric parameters is practically non-existent. There is a mild trend for increasing n with r e and μe, but there is no relationship with total luminosity.
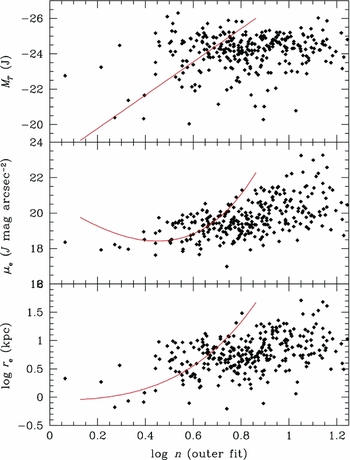
Figure 14. The relationship between the Sérsic n index and MT , μe, and r e. The well-defined relationships found by Graham & Guzmán (Reference Graham and Guzmán2003; red curves) disappear when outer isophotes are used in the fitting process. There are mild trends of increasing n with larger galaxies (shallower profiles), but extracting useful structural information in the halos of elliptical with the Sérsic r 1/n model is lost.
The lack of correlations is simply a strong statement on the nature of the n index in the context of the procedure for fitting a surface brightness profile. Early work (Trujillo et al. Reference Trujillo, Graham and Caon2001) focused on using the n index as a measure of the central concentration of a galaxy. This was achieved by higher resolution imaging of galaxy cores than available from 2MASS images, combined with a restriction of using data from the outer isophotes. In addition, the fitting process weights the data by surface brightness, automatically giving inner isophotes greater weight in the fits compared with the outer isophotes (there are typically more isophotes in the bright regions as well since the typical reduction scheme uses larger and larger apertures in the fainter surface brightness regions).
The wide scatter in Figure 14 underlies the intrinsic problem with the Sérsic r 1/n model for describing the halo of a galaxy (the region beyond the half-light radius). It simply does not have the correct shape to capture the increasing shallow profile slope combined with a sharp cutoff. A clearer example can be found in Figure 15. Here, the surface brightness profile of NGC 6702 is plotted in the r 1/4 space and was selected for its large dynamic range in surface brightness that appears r 1/4 (i.e., Sérsic n = 4). The best r 1/4 (i.e., linear) fit is shown in blue, with a Sérsic n index of 4 by definition. However, the best Sérsic r 1/n model fit (between the two indicated limits) results in a formal fit n index of 6.2. The difference between the fits is negligible with very little curvature at the faint and bright ends, yet a formal fit by a Sérsic r 1/n model wildly disagrees with a value of n = 4 and decouples r e and μe from n.
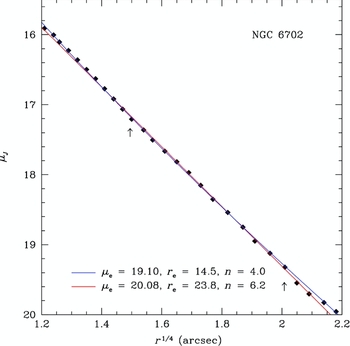
Figure 15. Comparison of an r 1/4 fit versus the Sérsic fit for NGC 6702, a nearly perfect r 1/4 shaped profile (plotted in the r 1/4 space for clarity such that the r 1/4 law is a straight line). Even when constrained to fit only the middle isophotes (indicated arrows), the Sérsic r 1/n model has too much coupling and flexibility to recover a correct profile slope.
In some sense, the Sérsic r 1/n model is too flexible when presented with data with a single power-law slope, but the very shallow χ2 contours. This results in a range of equally valid, but ill-defined fits. A range of values much larger than the formal errors are indicated by the fit algorithm. When a flattened core structure is present, then n can become a well-defined measure of concentration, and r e and μe parameterise the outer isophotes before the halo is reached. However, there is simply too much flexibility in the Sérsic r 1/n model in the outer regions of galaxies for it to be a unique indicator of structure, even if the model fit itself accurately follows the data.
While it is possible, using the Sérsic r 1/n model, to find a set of fit parameters that reproduces a majority of the inner or outer isophotes, the uncertainty in the fit variables, as shown in Figure 8, combined with the inability of the Sérsic n index to simultaneously follow the shape of the inner and outer portions of an ellipticals profile, leads us to conclude that neither the r 1/4 law nor the Sérsic r 1/n model is an adequate describer of the isophotes of a typical elliptical brighter than −20 J mag. As once stated by a famous galaxy photometrist: ‘It appears all fitting functions are simply elaborate French curves to be inflicted on the data’ (A. Oemler Jr 1984, private communication).
7 SUMMARY
The profiles of ellipticals have always held the greatest promise for exposing underlying structural relations as they are uncluttered by ongoing star formation, dust gas, and irregular morphology. Their elliptical isophotes allow for the simplest reduction from 2D images to 1D surface brightness profiles. The analysis of these profiles has, in the past, used various mathematically relations (fitting functions) that, hopefully, would have some analytic connection to underlying kinematics or, at least, match predicted profiles from galaxy formation simulations.
In this work, using a large, uniform sample of ellipticals imaging in the near-IR where the luminosity densities are the highest, the meaning and usefulness of the two most common fitting functions, the r 1/4 law and the Sérsic r 1/n model, have been examined. The results are summarised as follows:
-
1. The original discovery by Schombert (Reference Schombert1986) is reinforced in that the r 1/4 law only accurately describes the surface brightness profile of an elliptical over a limited range of surface brightness and, in that range, only for galaxies brighter than −23J mag. The 1/4 power index is an arbitrary for the power index as equally good fits are found for 1/5 or 1/3.
-
2. With the above restrictions, the relationship between μe and r e is well defined across many wavelengths and studies; however, the correlation is assisted by the strong coupling between the fit parameters which serves to minimise the scatter and distort the true errors.
-
3. The Sérsic r 1/n model is a quantitatively better fit to elliptical profile, mostly due to its additional free parameter. However, there is no clear evidence that the shape of the outer isophotes is correlated with the shape of the inner isophotes. Therefore, the n value deduced from total profile fits will be heavily influenced by the lower photometric error, and typically more numerous, inner isophote profile points.
-
4. Fits made to the inner portion (inside the half-light radius) of a profile versus the outer portions (outside the r 1/4 region) demonstrate that conflicting n values are found. The n values for outer fits are typically factors of two higher than inner fits, reflecting the shallower profiles of the halo regions, and are only weakly correlated with inner shape (see Figure 6).
-
5. Structural parameters extracted from the Sérsic r 1/n model are reproducible between various studies; however, again, the meaning of the fit parameters is highly distorted by the lack of uniqueness to the fits due to strong coupling of the fit parameters. The χ2 space for the fit parameters is wide and shallow, effectively allowing small photometric errors to dominate the resulting fit values. Nearly identical fits are found with widely different fit values (i.e., the fits are not unique, see Figures 9 and 15).
-
6. The Sérsic r 1/n model photometric plane (Graham Reference Graham2002) is reproduced in the near-IR and using the n fits to the outer isophotes. Its slope and scatter are nearly identical to previous determinations, even in light of the difficulty in applying the Sérsic r 1/n model in a coherent fashion. Its linearity may be a reflection of the limited luminosity range in our sample.
-
7. Empirically determined values, such as half-light radius (r h) and surface brightness (μh) are as, if not more, accurate compared with Sérsic r 1/n model fit parameters with respect to scaling relations (luminosity versus μ or scale length). All the scaling relations from Graham & Guzmán (Reference Graham and Guzmán2003) are reproduced in the near-IR, with the exception of correlations using the Sérsic r 1/n model n index.
-
8. While none of the structural relations are linear, the bright end of each sequence (MT < −23J mag) is distinct from the fainter galaxies, with a possible signature of mergers in the flattening of the luminosity–radius correlation. For the bright ellipticals, the scaling relations were found to be L ∝ r 0.8±0.1, L ∝ Σ−0.5±0.1, and Σ ∝ r −1.5±0.1. Although these are only approximate power laws inflicted on a much more complex relationship between structure and luminosity.
If the ultimate goal is to relate some observed analytic function to theoretical galaxy models, then the current suite of fitting functions is inadequate. As empirically defined parameters appear to have less scatter (e.g., Figure 11), then the best scheme to systematically describe the shape of elliptical profiles is to allow the data to stand for themselves. In other words, to follow the prescription of Schombert (Reference Schombert1987) and build template profiles as a function of elliptical luminosity. These have the advantage of correctly containing all the curvature in structure that is not captured by a smooth analytic function, yet are more stable than a spline fit in the sense that each template only has one variable, the galaxy luminosity. This technique will be the focus of our next paper, and the application of this method to discover that ellipticals are composed of two structural families (distinct from the core/cusp problem).
ACKNOWLEDGMENTS
The software for this project was supported by NASA's AISR and ADP programs, and images were obtained by the 2MASS project. Conversations with Alister Graham are gratefully acknowledged.


