Inappropriate use of statistics can seriously undermine the validity of published medical research. This paper aims to make recommendations to authors on the use and presentation of statistics in submissions to the Psychiatric Bulletin. We derive our recommendations from a review of the quality of statistical reporting in 50 consecutive ‘original’ papers published in the Psychiatric Bulletin. However simple the methodology of a study, adequate emphasis needs to be given to the correct and appropriate use and presentation of statistics in scientific papers.
Appropriate use of statistics is crucial in medical research. Use of inappropriate statistical methods and/or faulty interpretation of results can alter research findings significantly. Studies of statistical errors in published medical research have found statistical error rates in the region of 30-75% (Reference Pocock, Hughes and LeePocock et al, 1987; Reference McguiganMcGuigan, 1995). McGuigan (Reference Mcguigan1995) looked at the use of statistics in papers published in the British Journal of Psychiatry over a 1-year period and found that nearly 40% of papers contained statistical errors. More worryingly, he found that these rates were very similar to those noted in an earlier study by White (Reference White1979), and concluded that there was no evidence of a change in the statistical error rate over that period (1977-1993).
Authors, reviewers and editors all have crucial roles to play, at different stages of a paper's pre-publication ‘journey’, in ensuring the statistical quality and rigour of published papers. The aim of this paper is to provide recommendations to prospective authors in their use of statistics in papers submitted to the Psychiatric Bulletin. In order to best tailor this guidance to potential contributors to the Psychiatric Bulletin, we based it on the findings of an analysis of the statistical reporting in 50 papers published in the Psychiatric Bulletin in 2003. As detailed guidelines for authors on the use of statistics in medical research are easily available (see Box 1), rather than reinvent the wheel, we have attempted to tailor our recommendations to address the simple statistics that are relevant and appropriate to papers in the Psychiatric Bulletin.
Method
The Psychiatric Bulletin was hand searched for 50 consecutive ‘ original’ papers published in 2003 (starting with the January 2003 issue). Papers published in this section (i.e. ‘original papers’) were included in the study as they were most likely to have used and presented statistical analyses than papers published in other sections in the journal. We looked at each paper to identify statistical errors, that is, errors in the use and presentation of statistics. For the purpose of this paper, we took ‘statistical error’ to mean any of the following: inappropriate choice of statistical methods, incorrect use of statistical tests, faulty interpretation of results and errors in presentation of statistics as used by Hand & Sham (Reference Hand and Sham1995).
Box 1. Useful references for statistical guidelines for authors
-
• BMJ advice on statistical methods (http://resources.bmj.com/bmj/authors/special-methods)
-
• Balilar, J. C. & Mosteller, F. (1988) Guidelines for statistical reporting in articles for medical journals. Annals of Internal Medicine, 108, 266-273.
-
• Wilkinson, L. & Task Force on Statistical Inference, APA Board of Scientific Affairs (1999) Statistical methods in psychology journals: guidelines and explanations. American Psychologist, 54, 594-604.
-
• International Committee of Medical Journal Editors website (http://www.icmje.org/icmje.pdf)
-
• See instructions for authors section in major psychiatric journals.
Results
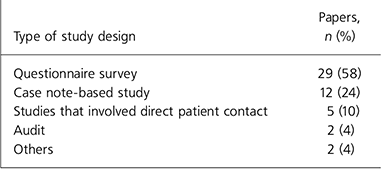
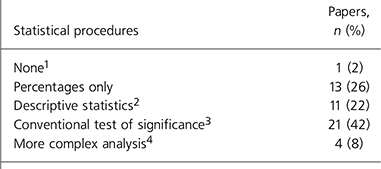
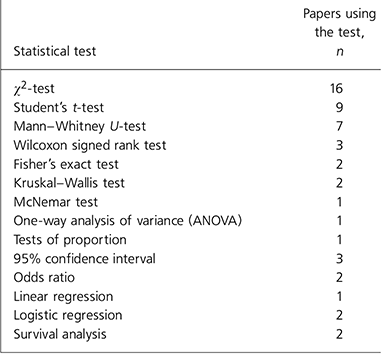
Tables 1, 2, 3 show the types of study design, statistical procedures used and the number of papers using different statistical methods respectively.
Table 1. Types of study design

| Type of study design | Papers, n (%) |
|---|---|
| Questionnaire survey | 29 (58) |
| Case note-based study | 12 (24) |
| Studies that involved direct patient contact | 5 (10) |
| Audit | 2 (4) |
| Others | 2 (4) |
Table 2. Types of statistical procedures used

| Statistical procedures | Papers, n (%) |
|---|---|
| None1 | 1 (2) |
| Percentages only | 13 (26) |
| Descriptive statistics2 | 11 (22) |
| Conventional test of significance3 | 21 (42) |
| More complex analysis4 | 4 (8) |
Table 3. Number of papers using different statistical methods

| Statistical test | Papers using the test, n |
|---|---|
| ϰ 2-test | 16 |
| Student's t-test | 9 |
| Mann-Whitney U-test | 7 |
| Wilcoxon signed rank test | 3 |
| Fisher's exact test | 2 |
| Kruskal-Wallis test | 2 |
| McNemar test | 1 |
| One-way analysis of variance (ANOVA) | 1 |
| Tests of proportion | 1 |
| 95% confidence interval | 3 |
| Odds ratio | 2 |
| Linear regression | 1 |
| Logistic regression | 2 |
| Survival analysis | 2 |
Examples of errors in use and presentation of statistics
Here we present some examples of errors in use and presentation of statistics in the papers looked at. These included
-
• no mention in the Method section as to what statistical methods were used
-
• mean value reported but standard deviation not given
-
• t-test used but did not mention which one (i.e. one-sample t-test or two independent samples t-test or two paired samples t-test)
-
• reported ‘no significant difference’ but no P value quoted
-
• P values quoted but no tests mentioned
-
• analysis of variance (ANOVA) used but degrees of freedom (d.f.) not stated
-
• mean value reported as ‘mean ±’ with no clarification of what ± means (i.e. standard deviation or standard error).
A large majority of the studies (82%) were questionnaire surveys or case note-based studies. Only 5 out of 50 original studies involved direct patient contact (see Table 1). The simplicity of the study designs and methodology reflected the type of statistical tests used in these studies: mostly descriptive statistics and simple tests of significance (see Tables 2 and 3). The most commonly used tests were the χ2-test (16 papers) and the t-test (9 papers). This is consistent with research findings from psychiatric and non-psychiatric medical literature (Reference ElsterElster, 1994; Reference Rigbys, Armstrong and CampbellRigby et al, 2004). Reed et al (Reference Reed, Salen and Bagher2003) studied the use of statistics in six medical journals and noted that χ2-test and t-test were the most commonly used tests. They went on to argue that clinicians could satisfactorily interpret 70% of medical literature if they understood descriptive statistics, chi-squared test and t-test. Although this statement may be an over-simplification, the underlying message may be particularly relevant to authors and readers of the Psychiatric Bulletin.
Recommendations to authors in their use and presentation of statistics
Based on the results described above, we make some simple recommendations on the appropriate use and presentation of statistics for authors submitting papers to the Psychiatric Bulletin. We suggest that these recommendations be read in conjunction with more detailed guidelines published elsewhere (see Box 1).
General
-
• Mention/explain the statistical methods used in the Method section of your paper (as a separate paragraph if appropriate)
-
• Mention the statistical software used in analysing the data
-
• Draw only justifiable conclusions from the results
-
• Avoid overuse of statistical abbreviations
-
• If uncommon statistical tests are used, provide reference
-
• If a statistician has helped with the study, it is good practice to acknowledge their contribution as appropriate.
Presentation of results
-
• Avoid duplication of data in text and table/graph
-
• No value reported should have more than 2 decimal places
-
• Where possible, exact P values should be quoted rather than merely stating ‘a significant result was found’ or ‘ P<0.05’
-
• If the statistical software output shows that the P value is equal to 0.000, then report that the P value is smaller than 0.001 or P<0.001
-
• Whenever the mean value is reported it is good practice to also report with it the standard deviation or the standard error, and clarify which measure is being reported. For example, mean12.3 (s.d.=2.6).
Use of statistics
-
• If using descriptive statistics, report values appropriately (i.e. for continuous data report mean and standard deviation and for discrete data quote median and interquartile range or range)
-
• If using the χ2-test, it should be justified. Note that if the expected cell frequency is less than 5 in 20% or more of the cells, then the χ2-test is not valid
-
• Whenever the t-test is used, the type should be mentioned (i.e. independent samples t-test or paired samples t-test (if using the independent samples t-test, it should also be mentioned whether equality of variance or inequality of variance was used)
-
• Use of parametric tests such as the t-test and ANOVA should be justified (i.e. the data follow normal distribution)
-
• Use appropriate statistical analyses to answer the research question under study.
Authors should ‘describe statistical methods with enough detail to enable a knowledgeable reader with access to the original data to verify the reported results’ (http://www.icmje.org/icmje.pdf).
Conclusions
Inappropriate use of statistics can seriously undermine the validity of published medical research. However simple the methodology of a study, adequate emphasis needs to be given to the correct and appropriate use and presentation of statistics in scientific papers.


eLetters
No eLetters have been published for this article.