1. Introduction
Seed filling is the final stage of soybean growth and marks the translocation of assimilation such as carbohydrate and amino acids from the reserve pools (leaf and stem) to the sink (caryopses) (Schussler et al., Reference Schussler, Brenner and Brun1984; Egli & Bruening, Reference Egli and Bruening2004). The rate and duration of seed filling determine the final seed weight, a key component of the total seed yield while maintaining high yield is a major goal of soybean breeding. The filling period is critical for grain yield and the yield potential is largely based on high biomass accumulation if no water stress exists (Yoshida, Reference Yoshida1972; Nicolas et al., Reference Nicolas, Lambers, Simpson and Dalling1985a, b; Palta et al., Reference Palta, Kobata, Turner and Fillery1994; Plaut et al., Reference Plaut, Butow, Blumenthal and Wrigley2004). In today's crop production systems with their high yield outputs, improvement in a grain filling rate has become vitally important and more challenging than ever.
It was well documented that the high filling rate could increase crop yield (Jones et al., Reference Jones, Peterson and Geng1979; Smith & Nelson, Reference Smith and Nelson1986a; Hunt et al., Reference Hunt, van der Poorten and Pararajasingham1991). For example, Wiegand & Cueller (Reference Wiegand and Cueller1981) reported that the grain filling rate was positively associated with the final grain weight in wheat (Hunt et al., Reference Hunt, van der Poorten and Pararajasingham1991). In rice, a study showed that the grain filling rate was highly correlated with actual panicle weight and 100-grain weight (Jones et al., Reference Jones, Peterson and Geng1979). Although the seed filling duration was different for a given genotype of soybean, the variations of a seed filling rate accounted for the major part of the seed weight variation among different environments (Munier-Jolain & Ney, Reference Munier-Jolain and Ney1998). Lines with high filling rate might help produce new varieties with high yield potential.
In soybean, the seed yield was positively associated with seed filling period, and a significant difference of seed filling period was found in various soybean genotypes (Smith & Nelson, Reference Smith and Nelson1986b; Pfeiffer & Egli, Reference Pfeiffer and Egli1988). The seed filling rate of soybean was partially determined by genetic factors, while the duration of seed filling was more easily influenced by environmental factors, such as temperature, oxygen, photoperiod, ABA and water (Egli et al., Reference Egli, Legget and Wood1978; Thorne, Reference Thorne1981; Schussler et al., Reference Schussler, Brenner and Brun1984; Munier-Jolain & Ney, Reference Munier-Jolain and Ney1998; Egli, Reference Egli and Bruening2004). Therefore, a high seed filling rate of soybean genotype could be referred to as a breeding index for yield and quality improvement.
Epistasis is termed as the interaction between one pair of loci located in the same or different chromosome, and referred to the effect of one locus on a particular phenotype depends on the genotype at a second locus (Cockerham & Zeng, Reference Cockerham and Zeng1996; Carlborg et al., Reference Carlborg, Jacobsson, Ahgren, Siege and Andersson2006). The mechanism of epistasis to the genomic control of complex traits is more complicated to be detected than individual gene effects and might decrease the individual quantitative trait locus (QTL) effects. If epistasis is ignored, individual locus might not be detected and the QTL contribution to the phenotype was neglected, which could lead to an incorrect application to molecular selection assist (MSA) and weaken the ability in QTL identification and reduce the economic gain than predicted (Carlborg et al., Reference Carlborg, Jacobsson, Ahgren, Siege and Andersson2006). In order to gain more accurate and unbiased understanding estimates of the genetic background of economically important traits, epistatic effects should be included in QTL mapping studies (Jannink, Reference Jannink2008). Carlborg & Haley (Reference Carlborg and Haley2004) showed that epistasis is a common response to selection in breeding programmes. Several studies in soft winter wheat based on either first- or second-moment statistics have demonstrated a significant contribution of epistasis to grain yield and flowering time (Goldringer et al., Reference Goldringer, Brabant and Gallais1997).
Epistasis in soybean was particularly important as lots of multiple allelisms were observed in soybean chromosomes, and the duplicate copies of genes were likely to interact with each other (Schmutz et al., Reference Schmutz, Cannon and Schlueter2010). However, non-allelic interaction had been observed between loci controlling important traits such as oil content, protein content, yield and related traits in soybean (Croissant & Torrie, Reference Croissant and Torrie1971; Han et al., Reference Han, Teng, Sun, Du, Qiu, Xu and Li2008; Martin et al., Reference Martin, Xie, Zhang, Zhang and Song2009; Reif et al., Reference Reif, Maurer, Korzun, Ebmeyer, Miedaner and Würschum2011).
Many genetic factors were involved in seed filling of soybean. The identification of these genetic factors at different developmental stages is important for a substantially improving seed filling rate. Epistatic QTL underlying important traits, such as seed weight, protein and oil contents expressed in different seed developmental stages of soybean had been reported (Han et al., Reference Han, Teng, Sun, Du, Qiu, Xu and Li2008; Jiang et al., Reference Jiang, Han, Teng, Zhang, Sun, Li and Li2010) rather than seed mass filling rate.
The objectives of our work were to analyse the dynamic behaviour of seed filling rate at different filling stages and to detect QTL with additive and epistatic effects as well as their QTL×environment (QE) interaction effects using the statistical model of Zhu (Reference Zhu1995) for analysing conditional genetic effects.
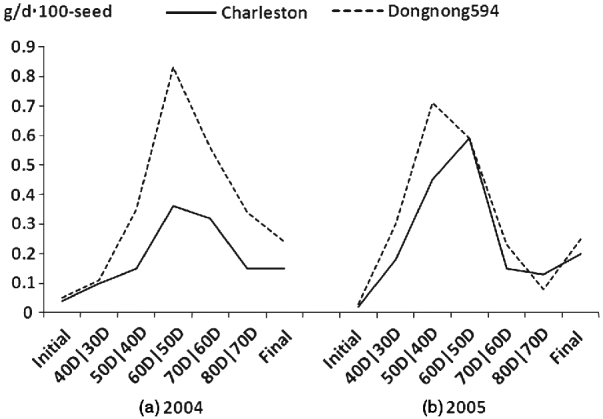
Fig. 1. Seed filling rate for the parents and the RIL population at different developmental stages in 2004 and 2005 at Harbin, China.
2. Materials and methods
(i) Plant materials
The mapping population consisted of 143 F2 derived F5 recombinant inbred lines (RILs) that were advanced by single-seed descent from the cross of ‘Charleston’ (provided by Dr R. L. Nelson, Illinois State University of USA) and ‘Dongnong 594’ (developed by the Northeast Agriculture University, Harbin, China). The RILs and their parents were grown at Harbin during the summers of 2004 and 2005 as two environmental treatments in a randomized complete block. Rows were 3 m long and 0·7 m wide with a distance of 6 cm between plants. Three row plots were used. Pods were picked from the fifth to seventh nodes of main stems every 10 days from 30 days after flowering (30D) until physiological maturity (80D). The 30D sample represented the R3 stage (initial stage) and the 80D sample represented the R8 stage (final stage) of growth with intervening stages at about 10D intervals. Seeds were pre-dried for 30 min in an oven at 105°C and then continuously dried until the seed weight was stable at 50–70°C. All dried samples were weighed (Teng et al., Reference Teng, Han, Du, Sun, Zhang, Qiu, Sun and Li2009). Seed filling rate was calculated as follows: (Wt −W (t−1))/10, and represented by Dt/D(t−1) stage (Li et al., Reference Li, Zhang, Hu, Li, Jiang, Mao, Li and Zhu2006) .
(ii) Random Amplification of Polymorphic DNA (RAPD) analysis
Total DNA of each RIL was isolated from freeze-dried leaf tissue by the CTAB method as described by Doyle & Doyle (Reference Doyle and Doyle1990) . RAPD analysis was carried out with 1200 random decamer primers obtained from Operon Technologies Inc. (Alameda, CA, USA). A 20 μl of reaction mixture containing 2 μl of genomic DNA (15 ng/μl), 1·5 μl of MgCl2 (25 mM), 0·3 μl of dNTPs (10 mM), 2 μl of 10×PCR buffer, 2 μl of RAPD primer (2 μM), 0·2 μl of Taq polymerase (10 units/μl) and 12 μl of H2O. The PCR programme consisted of 2 min at 94°C, and 41 cycles of 1 min at 94°C, 1 min at 36°C and 1 min at 72°C. The final extension step of 10 min was carried out at 72°C. PCR products were separated on 1·5% (w/v) agarose gel and stained with ethidium bromide and UV fluorescence.
(iii) Simple Sequence Repeat (SSR) analysis
SSR analysis was performed with 600 pairs of primers developed by Song et al. (Reference Song, Marek, Shoemaker, Lark, Concibido, Delannay, Specht and Cregan2004) . PCR was performed in a 20 μl reaction mixture containing 2 μl of genomic DNA (25 ng/μl), 1·5 μl of MgCl2 (25 mM), 0·3 μl of dNTP mixtures (10 mM), 2 μl of 10×PCR buffer, 2 μl of SSR primer (2 μM), 0·2 μl of Taq polymerase (10 units/μl) and 12 μl of H2O. The amplification profiles were 2 min at 94°C, followed by 35 cycles of 30 s at 94°C, 30 s at 47°C, 30 s at 72°C, then 5 min at 72°C. PCR products were mixed with loading buffer (2·5 mg/ml Bromophenol Blue, 2·5 mg/ml Diphenylamine Blue, 10 mM EDTA and 95% (v/v) formamide), and denatured for 5 min at 94°C. Denatured DNA was placed on ice for 5 min and separated on 6% (w/v) denaturing polyacrylamide gel by electrophoresis. DNA bands were visualized using silver straining (Trigizano & Caetano-Anolles, Reference Trigizano and Caetano-Anolles1998).
(iv) Statistical analysis
QTLs with additive and additive×additive epistatic effects, as well as their environmental interaction effects in the RIL population, were mapped by QTLMapper version 1.6 (Wang et al., Reference Wang, Zhu, Li and Paterson1999a). For unconditional analysis of seed filling rate at 80D stage, the phenotypic value of the kth RIL in environment h can be partitioned by the following mixed linear model (Zhu, Reference Zhu1999):

The meaning of each parameter is the same as that described by Wang et al. (Reference Wang, Zhu, Li and Paterson1999a)
and Luo et al. (Reference Luo, Li, Mei, Shu, Tabien, Zhong, Ying, Stansel, Khush and Paterson2001)
: where μ is the population mean; ai
and aj
are the additive effects (fixed effects) of two putative loci Qi
and Qj
, respectively; aaiij
is the additive×additive epistatic effect (fixed effect) between the two loci; ![]() ,
,![]() and
and ![]() are the coefficients of these genetic main effects;
are the coefficients of these genetic main effects; ![]() is the random effect of environment h with a coefficient
is the random effect of environment h with a coefficient ![]() ;
; ![]() (or
(or ![]() ) is the random additive×environment interaction effect with a coefficient
) is the random additive×environment interaction effect with a coefficient ![]() (or
(or ![]() ) for Qi
(or Qj
);
) for Qi
(or Qj
); ![]() is the random epistasis×environment interaction effect with a coefficient
is the random epistasis×environment interaction effect with a coefficient ![]() ;
; ![]() is the random effect of marker f nested within the hth environment with a coefficient
is the random effect of marker f nested within the hth environment with a coefficient ![]() ,
, ![]() is the random effect of the lth marker×marker interaction nested within the hth environment with a coefficient
is the random effect of the lth marker×marker interaction nested within the hth environment with a coefficient ![]() ; ∊hk
is the random residual effect. The marker factors
; ∊hk
is the random residual effect. The marker factors ![]() and
and ![]() in the model are used to absorb additive and epistatic effects of background QTL for controlling the noise. The QTL detected by this unconditional mapping method would indicate the cumulative gene effects from the initial time (30D) to the final time (80D).
in the model are used to absorb additive and epistatic effects of background QTL for controlling the noise. The QTL detected by this unconditional mapping method would indicate the cumulative gene effects from the initial time (30D) to the final time (80D).
Conditional QTL analysis was conducted with the phenotypic value at time t, given the phenotypic behaviour at time (t−1), using QTLMapper version 1.6 (Wang et al., Reference Wang, Zhu, Li and Paterson1999a). Similar to that in Equation (1), the conditional value ![]() can be partitioned as
can be partitioned as
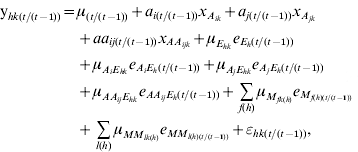
with all the parameters defined as conditional effects. The QTL detected by conditional mapping will reflect the net expression of genes during the time period from time (t−1) to time t, independent of the genetic effects before time (t−1).
The conditional phenotypic value ![]() of filling behaviour was obtained by the mixed model approaches for the conditional genetics of developmental quantitative traits (Zhu, Reference Zhu1995). The likelihood-ratio threshold was chosen at α=0·01 for claiming putative QTL, of which their genetic effects were further tested by a t-test with the jack-knifing re-sampling procedure. QTLs were presented when genetic main effects (a and aa) or QE interaction effects (ae and aae) were significantly different from zero (P⩽0·01).
of filling behaviour was obtained by the mixed model approaches for the conditional genetics of developmental quantitative traits (Zhu, Reference Zhu1995). The likelihood-ratio threshold was chosen at α=0·01 for claiming putative QTL, of which their genetic effects were further tested by a t-test with the jack-knifing re-sampling procedure. QTLs were presented when genetic main effects (a and aa) or QE interaction effects (ae and aae) were significantly different from zero (P⩽0·01).
Broad-sense heritability of seed filling rate was computed as h 2=σg2/((σg2+σe2)/n), where σg2 and σe2 are the estimates of genetic and residual variance, which were, respectively, derived from the expected mean squares of the variance and n is the number of replications (Blum et al., Reference Blum, Klueva and Nguven2001).
3. Results
(i) Phenotypic variation
The mean seed filling rates of Charleston and Dongnong 594 were significant difference at different developmental stages except for the 60D/50D stage in 2005 in which the parents possessed the same seed filling rate. The mean seed filling rate of the two parental cultivars showed an increase at the first four measuring stages including initial stage, 40D/30D stage, 50D/40D stage and 60D/50D stage in the two environments (2004 and 2005) except that Charleston showed a decline at 60D/50D stage in 2005. The highest seed filling rate was observed at 60D/50D stage for the two parents except that parent Dongnong 594 reached the highest seed filling rate at 50D/40D stage and then decreased and reached the lowest value at 80D/70D stage in 2005. To show the mean seed filling rate, the seed filling rate at the final development stage (R8) was analysed, and the result showed that Charleston was low than that of Dongnong 594 across the years 2004 and 2005 (Fig. 1). Individual RILs also varied significantly in their mean seed filling rate. Some RILs had higher mean seed filling rate, while the others had lower mean seed filling rate. In contrast, the variation of mean seed filling rate for each RIL was not significant across the 2 years (data not shown). Therefore, RILs performance was consistent and G×E interaction was limited. Most of the skewness and kurtosis values of seed filling rate were less than 1·0 at different growth stages measured in the two environments, indicating that segregation pattern of seed filling rate fit a normal distributing model. Broad-sense heritability of seed filling rate from the initial phase to the final phase was 0·70, 0·68, 0·46, 0·65, 0·86, 0·43 and 0·49, respectively (Table 1).
Table 1. Statistical analysis of seed filling rate (g/d·100-seed) for the parents and the RIL population at different developmental stages over 2 years at Harbin, China
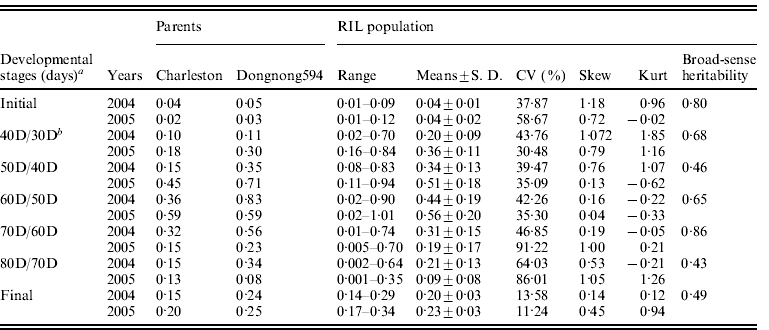
RIL, recombinant inbred line; CV, coefficient of variation; SD, standard deviation.
a 30, 40, 50, 60, 70, 80D represents 30, 40, 50, 60, 70 and 80 days after flowering, with maturity at 80D; initial indicates the initial stage (from flowering to 30 days), and final indicates the final stage (from initial time to 80 days).
b 40D/30D indicates the stage from 30 days to 40 days, and so on.
(ii) Analysis of a and ae effects during seed filling
Eleven QTLs of seed filling rate with significant a and/or ae effects at different seed developmental stages were identified in 2004 and 2005 and were mapped on seven linkage groups (LGs) using unconditional and conditional mapping (Table 2). Of them, six QTLs showed positive additive (a) effects, four QTLs with negative additive (a) effects and one QTL with positive or negative effects at different stages. ‘Dongnong 594’ (higher seed filling rate) contributed the alleles QFRC2_2, QFRF_1 and QFRN_1 that increase seed filling rate at different filling stages, against the alleles QFRA1_1, QFRA1_2 and QFRG_1 that decreased seed filling rate. QFRA1_3 decreased seed filling rate at 60D/50D stage, while it increased filling rate at the final stage, suggesting that the impact of some QTLs was different at different filling stages. QFRC2_2 showed a positive additive effect across the developmental stages and explained 3·68–9·49% of the phenotypic variation. QFRG_1 showed a negative additive effect across four different developmental stages (60D/50D, 70D/60D, 80D/70D and final stage) and explained 1·71–2·36% of the phenotypic variation. Other QTLs showed either positive or negative a effect at different developmental stages and explained the phenotypic variation from 1·6 to 5·9%.
Table 2. Estimated additive (a) and additive×environment interaction (ae) effects of QTL underlying seed filling rate at different developmental stages of soybean seed in 2004 and 2005
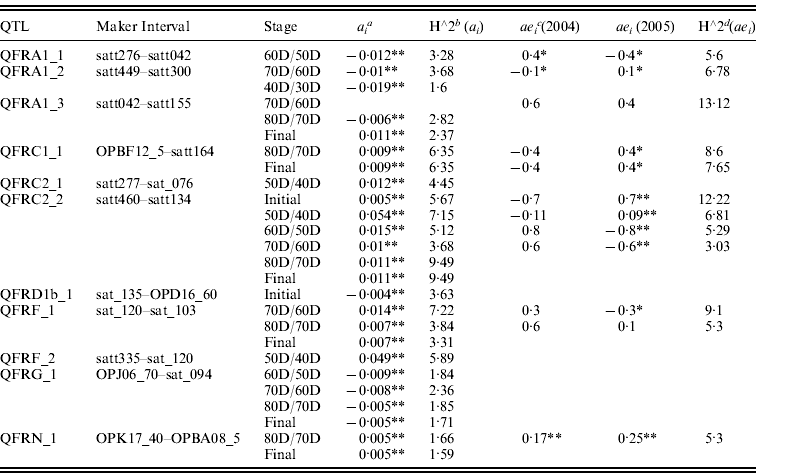
* P<0·01.
** P<0·05.
a ai is the additive effects of the test points i.
b h∧2ai is the percentages of the phenotypic variations explained by ai .
c aei is the effects of the environmental interaction of locus i.
d h∧2aei is the percentages of the phenotypic variations explained by aei .
Seven QTLs were identified to have significant ae effects at different seed filling stages in 2004 and 2005 (Table 2). QFRC2_2 had a significant ae effect across initial stage, 30D/20D, 40D/30D and 50D/40D stage. QFRC2_2 had a significant ae effect at initial stage; 50D/40D, 60D/50D and 70D/60D stage. A significant ae effect was detected in QFRC1_1 (at 80D/70D stage and final stage) and QFRF_1 (at 50D/40D and 60D/50D stage). Four QTLs (QFRA1_1, QFRA1_2, QFRA1_3 and QFRN_1) possessed significant ae effect at only one filling stage, suggesting that the impact of QTL varied at different developmental stages. One QTL (at QFRA1_3 at 70D/60D stage) had a significant ae effect rather than a significant a effect and accounted for 13·12% of the phenotypic variation. Three QTLs (QFRA1_3 at 70D/60D stage, QFRF_1 at 80D/70D stage and QFRN_1 at 80D/70D stage) were identified to have a significantly positive ae effect on seed filling rate in both 2004 and 2005, accounting for 5·3–13·12% of the phenotypic variation. Other QTLs showed either positive or negative ae effects on seed filling rate in both years and explained 3·03–12·22% of the phenotypic variation.
Seven QTLs (QFRA1_1 at 60D/50D stage; QFRA1_2 at 70D/60D stage; QFRC1_1 at 80D/70D stage; QFRC1_1 at the final stage; QFRC2_2 at 50D/40D, 60D/50D, 70D/60D and initial stages; QFRF_1 at 70D/60D and 80D/70D stages; QFRN_1 at 80D/70D stage) were identified with both a and ae effects.
(iii) Analysis of aa and aae effects during seed filling
Both aa (epistasis) and aae (epistasis×environment) effects were analysed using QTLMapper version 1.6 (Wang et al., Reference Wang, Zhu, Li and Paterson1999a). Twenty-three epistatic pairwise of aa QTLs or aae QTLs were identified in different seed filling stages (Table 3). Of them, aa and aae effects of 12 pairs of QTLs were identified by unconditional mapping from the initial stage to the final stage (12 pairs of QTLs with aa effects and two pairs of QTLs with aae effects). Thirteen pairs of QTLs underlying seed filling rate with aa and aae effects were identified by conditional mapping. Of them 11 pairs of QTLs were detected as aa effects and two pairs of QTLs were detected as aae effects. Five pairs of epistatic QTLs were detected across two different stages (QFRC1_2 and QFRF_4 at 80D/70D and final stages; QFRC2_2 and QFRC2_1 at initial and 50D/40D stages; QFRE_1 and QFRC1_4 at 80D/70D and final stages; QFRE_4 and QFRN_2 at 80D/70D and final stages; QFRL_2 and QFRC1_2 at 80D/70D and final stages). One pair of epistatic QTLs (QFRL_2 and QFRA1_2) was detected with only aae effect at 40D/30D stage. Other pairs of QTLs were identified in only one filling stage with aa or aae effects. However, QFRC2_2 was detected to interact with other three different QTLs (QFRC2_1 at initial and 50D/40D stages, QFRC2_4 at 50D/40D stage and QFRC2_5 at initial stage). The epistatic effects of these QTLs explained 0·83–3·04% of the phenotype variation. QFRL_2 interacted with two other QTLs (QFRA1_2 at 40D/30D stage; QFRC2_2 at 80D/70D and final stages) and explained 4·08–7·73% of the phenotypic variation. Three pairs of QTLs (QFRC1_2 and QFRF_4, QFRE_1 and QFRC1_4, QFRE_4 and QFRN_2, QFRL_2 and QFRC2_2) were detected in the late filling stages (all at 80D/70D and final stages), and explained the proportion of phenotype variation by epistatic interactions from 0·86 to 7·73%. Six pairs of epistatic QTLs (QFRC1_2 and QFRF_4; QFRE_1 and QFRC1_4; QFRE_4 and QFRN_2; QFRL_2 and QFRC2_2; QFRC2_2 and QFRC2_1; QFRC2_2 and QFRC2_5) with aa or aae effects were detected only in initial stage or final stage and explained the proportion of phenotype variation from 0·86 to 7·73% (Table 3).
Table 3. Estimated epistatic (aa) and epistasis×environment interaction (aae) effects of QTL underlying seed filling rate at different developmental stages of soybean in 2004 and 2005
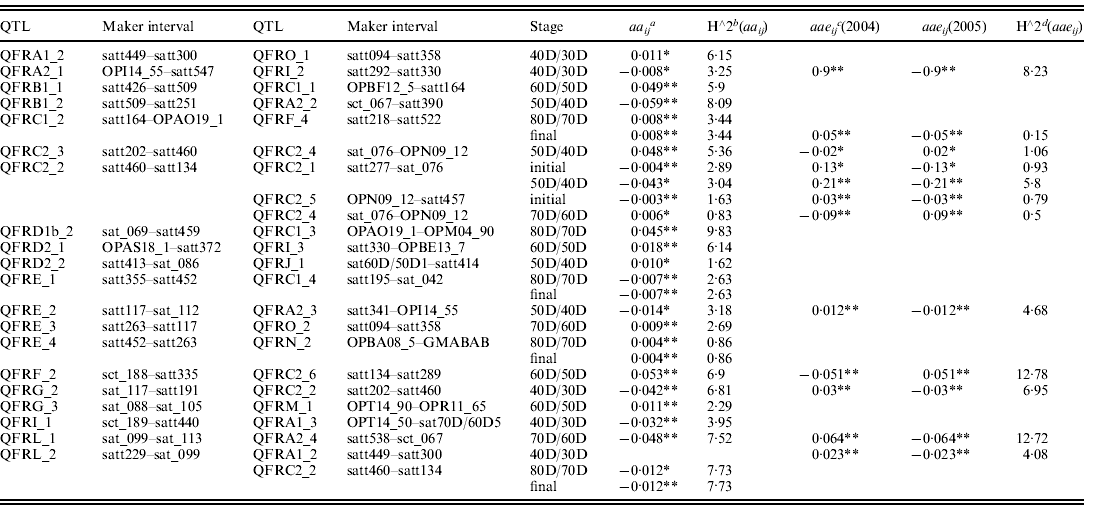
* P<0·01.
** P<0·05.
a aaij is the additive-by-additive interaction between points i and j.
b h∧2aaij is the percentages of the phenotypic variations explained by aaij.
c aaeij is epistatic effect of the environmental interaction of locus i, j.
d h∧2aaeij is the percentages of the phenotypic variations explained by aaeij.
aae was an important component of the total QE interaction effects. Of the identified 23 digenic interactions in this study for seed filling rate, 16 had only aa effects that explained 0·83–9·83% of the phenotype variation by epistatic interactions, and one had only aae effect that explained 4·08% of the phenotype variation. Other pairs had both aa and aae effects and explained the proportion of phenotype variation by epistatic interactions from 0·83 to 7·52% (Table 3).
4. Discussion
Many studies have shown that seed filling rate is the key genetic factor influencing seed yield (Jones et al., Reference Jones, Peterson and Geng1979; Smith & Nelson, Reference Smith and Nelson1986a, Reference Smith and Nelsonb). In crops, seed filling rate and duration could account for the most variation of seed weight (Nass & Reiser, Reference Nass and Reiser1975). Our results indicated that the seed filling rate of soybean was under developmental genetics and environmental control. Similar results were reported in rice (Takai et al., Reference Takai, Fukuta, Shiraiwa and Horie2005), wheat (Wang et al., Reference Wang, Hai, Zhang, You, Yan and Xiao2009) and maize (Wang et al., Reference Wang, Kang and Moreno1999b; Liu et al., Reference Liu, Ji, Cui, Wu, Duan, Feng and Tang2011).
Most previous studies of QTLs were limited on the analyses of individual QTLs rather than the interaction between QTLs (Specht et al., Reference Specht, Chase, Macrander, Graef, Chung and Markwell2001; Hyten et al., Reference Hyten, Pantalone, Sams, Saxton, Landau-Ellis, Stefaniak and Schmidt2004), resulting in the underestimation of genetic variance and the overestimation of individual QTL effects (Carlborg & Haley, Reference Carlborg and Haley2004). Considerable loss in genetic response to marker-assisted selection (MAS) at late generations had been observed (Liu et al., Reference Liu, Zhu and Lu2004) due to the negligence of interaction between QTLs. Twenty-eight pairs of QTLs with epistasis effects at different developmental stages were detected in our study. One pair showed only aae effect at different seed filling stages and others showed both aa and aae effects, suggesting that epistasis was important and should be considered in breeding programmes for increasing seed-filling rate in soybean.
Unconditional and conditional QTL mapping provided an effective way to evaluate the dynamic expression of quantitative traits during soybean development. aa and aae effects of the conditional QTL underlying seed weight and linolenic acid content have been determined using conditional and unconditional QTL strategy in soybean (Teng et al., Reference Teng, Han, Du, Sun, Zhang, Qiu, Sun and Li2009; Han et al., Reference Han, Xie, Teng, Zhang, Chang and Li2011). In the present study, epistatic effect and QTL×environmental interaction of mass filling rate during soybean seed development were determined. Ten QTLs were identified to possess a, ae, aa or aae effects at the final filling stage of seed that explained 0·15–9·49% of the phenotypic variation, while other 34 QTLs were identified to have a, ae, aa or aae effects from initial to 80D/70D stages and explained 0·5–13·12% of the phenotypic variation. Our findings indicated that aa and aae effects existed mostly for a short time period, so that a pair of QTLs was hardly detected during consistent seed filling stages. This was implied by the fact that aa and aae effects were mostly contributed by transient gene expression.
Some studies showed that epistatic variance accounted for a large proportion of the genetic variance of quantitative traits in mapping population (Wilfert & Schmid-Hempel, Reference Wilfert and Schmid-Hempel2008). In our study, the interaction between QFRD1b_1 and QFRC1_3 (aa effect) at 80D/70D stage explained the largest proportion of phenotypic variation (9·83%), followed by the interaction between QFRB1_2 and QFRA2_1 at 50D/40D stage (explained 8·09% of the phenotypic variation), and then by the interaction between QFRL_2 and QFRC2_2 at the final stage (explained 7·73% of the phenotypic variation). The phenotypic variation explained by these aa effects were almost equal to the proportion of the phenotypic variation explained by a effect, such as, QFRC2_2 at 80D/70D stage that explained the largest proportion of phenotypic variation (9·49%). Because of the obvious contribution by epistatic interaction, QTL with significant epistatic effect should be considered in breeding programme for increasing seed filling rate or seed weight in soybean.
QE interaction was an important component affecting quantitative traits. Understanding QE interaction is of importance to the MAS. Usually, QE interaction effect is treated as random effect. This implied that QTL would be affected by different environments. The mixed model approaches for QTL mapping provided an unbiased prediction on QE interaction when the experiment was conducted under multiple environments (Zhu, Reference Zhu1999), which could enhance the efficiency of the analyses for QTL×environment interaction. In the present work, nine QTLs had only a effect at different filling stages, and one QTL (QFRA1_3 at 70D/60D stage) had only ae effect, while other QTLs had both a and ae effects at different seed filling stages. The QTL with only QE effects were mainly determined by environments and was ineffective for MAS. For example, QFRA1_3 at 80D/70D and final stages (with only a effect) explained 2·37–2·82% of the phenotypic variation, while the same QTL QFRA1_3 at 70D/60D stage (with ae effect) explained 13·12% of the phenotypic variation. This result described an environmentally sensitive phenomenon of QTL and could not be desirable for MAS. QTL QFRG_1 showed only a effect at 60D/50D, 70D/60D, 80D/70D and final stages in this study, suggesting that this QTL was stable in different environments and could be a desirable loci to improve seed filling rate of soybean by MAS.
Acknowledgements
This study was conducted in the Key Laboratory of Soybean Biology of Chinese Education Ministry, Soybean Research and Development Center, CARS and the key Laboratory of Northeastern Soybean Biology and Breeding/Genetics of Chinese Agriculture Ministry, financially supported by National High Technology Project (Contract No. 2006AA10Z1F1), National Core Soybean Genetic Engineering Project (Contract No. 2008||ZX08004-002, 2009||ZX08004-002B and 2009ZX08009-089B), Chinese National Natural Science Foundation (60932008 and 30971810), National 973 Project (2009CB118400) and the Provincial/National Education Ministry for the teams of soybean molecular design.
Declaration of interest
None.


