INTRODUCTION
The main goal of highly active antiretroviral therapy (HAART) in HIV-infected patients is to forestall irreversible immune deterioration, and to delay clinical progression to AIDS and death. When HAART became available, some physicians even proposed treating patients at an early stage of HIV infection [Reference Ho1]. Conversely, others proposed to delay the initiation of HAART regimen in patients without a significant decrease in CD4 lymphocyte T (CD4+) cell count because of (i) the low risk of short-term disease progression, (ii) the complexity of treatment administration, (iii) the significant risk of short- and long-term toxicities, and (iv) the risk of resistance selection [2–Reference Gazzard and Moyle4]. In current guidelines, the introduction of antiretroviral treatment is recommended in symptomatic patients and in those with <200 CD4+/mm3, and often has to be considered for patients with a CD4+ count between 200 and 350/mm3 and/or with an HIV viral load >100 000 copies/ml [5–Reference Yeni8]. In other situations a delay in the introduction of HAART is recommended.
These immune and virological thresholds have been primarily drawn from cohort studies which investigated the risk of short-term progression towards AIDS or death [Reference Egger9, Reference Chene10]. Nevertheless, no study has explored the long-term clinical impact of antiretroviral strategy. In order to obtain a global overview of the effect of prognostic factors on each stage of HIV infection, some authors proposed modelling the progression of HIV infection by combining the immunological and clinical evolution using Markov modelling [Reference Schechter11–Reference Kousignian13]. Multi-state Markov modelling is perfectly suited to analyses that involve many disease stages as, it can be used (i) to estimate the effects of each variable of interest on the risk of transition from one disease stage to another, (ii) to compare the effects of each factor on the different transitions, (iii) to estimate the probabilities of evolving from one stage to another, which could be of particular interest in predicting the evolution at an individual level [Reference Alioum14, Reference Dancourt15]. However, these few previous models did not take into account the impact of HAART, or only focused on specific situations.
Thus, the aim of the present study is to estimate the effect of HAART on patients' clinical and immunological progression, adjusted for the main known prognostic factors, in a prospective cohort including all the patients followed in the Northern and Eastern part of France.
PATIENTS AND METHODS
Study design
This study was designed as an observational prospective cohort study.
Study population
The population study included all consecutive HIV-1-infected patients (assessed by two ELISA assays and confirmed by Western blot), seen for the first time in one of the participating centres in North-Eastern France (Belfort, Besançon, Dijon, Nancy, Strasbourg, Tourcoing) from 1 July 1996 to 15 June 2004. For each patient, at each visit or hospitalization, clinical, biological, immunological, virological and therapeutic data were prospectively collected. Patients were required to consent to computerization of their data. Standardized assays were used to determine CD4+ cell count. HIV viral loads were prospectively measured, by using one of the following assays: RT–PCR (Amplicor™, Roche Diagnostics, Meylan, France), Ultra-sensitive RT-PCR (Amplicor™, Roche), and bDNA (Quantiplex™, Chiron, Emeryville, CA, USA).
Patients had to be aged >15 years at the first visit, to be followed at least twice at one of the participating centres and, to have at least two measures of CD4+ cell count available before the end of the follow-up (30 September 2004). Overall, of the 2597 HIV-1 patients aged >15 years and followed at least twice, 471 were excluded because of insufficient immunological and virological data (160 because of missing baseline values and 311 with only one CD4+ count measurement and lost of follow-up after two visits), Thus 2126 patients were finally included in our analysis.
Statistical analysis
A parametric continuous-time Markov model with constant transition intensities allowing for the introduction of time-varying covariates [Reference Alioum and Commenges16] was used in order to estimate the impact of prognostic factors on transitions through different HIV disease stages including clinical progression and immunological evolution defined according to different strata of CD4+: (1) CD4+ count (CD4+) ⩾500 cells/mm3; (2) ⩾350 to <500 cells/mm3; (3)⩾200 to <350 cells/mm3; (4) <200 cells/mm3 and (5) AIDS or death. These five stages in which a patient may be at any time t, and the different transitions between them are represented in Figure 1. Note that stage (5) is an absorption stage; once a patient has reached this stage no further transition is possible. In this model, the distribution off waiting times is implicit and follows an exponential law. According to Figure 1, the progression of the disease can be described by 10 transition intensities: three intensities of immune deterioration (λ12, λ23, λ34), three intensities of immunity improvement (λ21, λ32, λ43), and four intensities of clinical deterioration (AIDS or death), each corresponding to a different initial CD4+ cell count stratum (λ15, λ25, λ35, λ45). Since the first goal of HAART is to prevent immune deterioration and clinical evolution, the analyses were focused on these specific transitions.
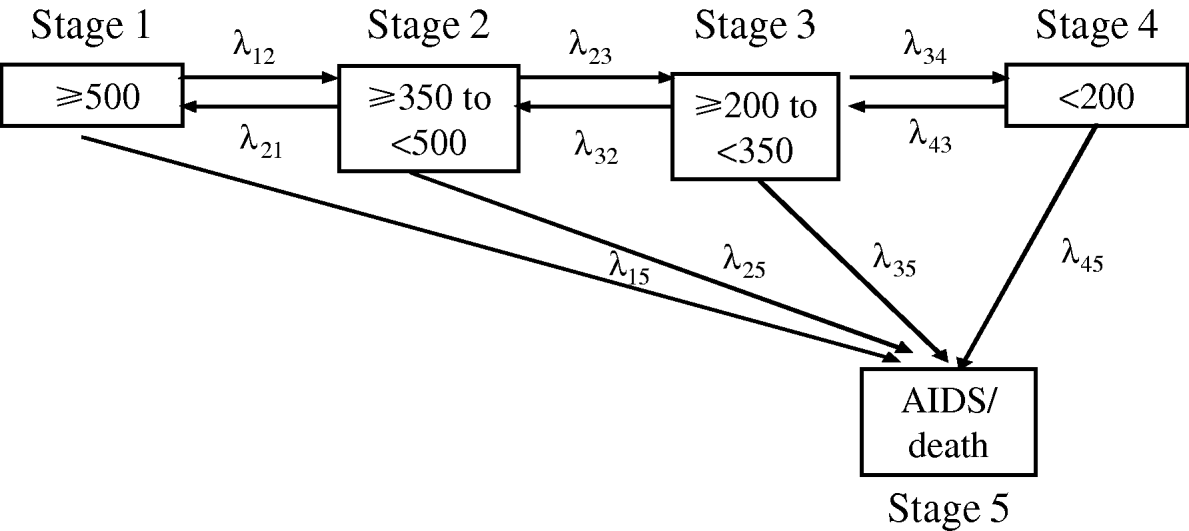
Fig. 1. Graph of potential transitions between each stage (defined by the CD4 cell count and clinical progression towards AIDS or death) in the Markov model. λ12, λ23 and λ34 represent the three intensities of immune deterioration; λ21, λ32 and λ43 correspond to three intensities of immunity improvement; λ15, λ25, λ35 and λ45 represent the four intensities of clinical deterioration (evolution towards AIDS or death).
In this dynamic process, we considered the date of the first visit to one of the participating centres as the baseline date. The time is measured as a continuation from the baseline. In the main analysis, immune deterioration was defined as the decrease in the CD4+ cell count from a given stage to a lower one between two visits; while immune restoration was defined as the increase in the CD4+ cell count to a higher stage, between two visits. An alternative, more rigorous definition of immunological evolution was used in a sensitivity analysis, where two consecutive measurements, both in the same new stratum of CD4+ cell count, were needed to validate the change.
To model the transition intensities, we relied on a five-state time-homogeneous Markov model [Reference Alioum14, Reference Alioum and Commenges16]. The transition intensity λhj can be interpreted as the ‘instantaneous risk’ of experiencing a transition from stage h to stage j. To assess the impact of covariates on each ‘instantaneous risk’, the time-homogeneous Markov model can be extended to the multivariable proportional-intensities regression model [Reference Alioum14, Reference Alioum and Commenges16]:
with h, j=1, …, k; h≠j and p the number of covariates, where λhj0 is the baseline hazard function, i.e. the hazard of transition from stage h to stage j corresponding to z 1=…=z p=0, and βj is a logarithm of the hazard ratio that represents the effect of covariate Z j on transition from h to j. Notation z(t) indicates that covariates are time-dependent, i.e. are updated each time a new value becomes available.
In this model, a covariate (Z i) is assumed to affect the baseline intensity λjk by a proportional (constant over time) factor (exp [βijk]), so that a model with ten transitions requires ten different regression coefficients to be estimated for each covariate. The effects of the different covariates are assumed to be multiplicative and constant over time, both assumptions being consistent with the conventional proportional hazards model [Reference Cox17]. Therefore, the interpretation of exp [βijk] is similar to that of the adjusted hazard ratio in the Cox model. All baseline intensities λhj0 and all regression coefficients βijk are simultaneously estimated using the maximum- likelihood method [Reference Alioum14].
We introduced into the five-state Markov model [Reference Marshall, Guo and Jones18], consistent with Figure 1, all the following covariates categorized according to the classifications used in previous studies: age at the first visit (15–30, 30–45, ⩾45 years), gender, transmission group, hepatitis B virus (HBV) (positive HBs antigen) and hepatitis C virus (HCV) (positive HCV serology) status at inclusion, initial CD4+ cell count (⩾500, 350–499, 200–349, <200 cells/mm3). Viral load (<2·3, 2·3–5, ⩾5 log10 copies/ml), haemoglobin level (<11, ⩾11 g/dl), CD8 lymphocyte count (<500 vs. ⩾500 cells/mm3), weight changes (compared to former weight: no weight loss, weight loss <10%, 10–19%, ⩾20%), types of antiretroviral treatment grouped into seven categories: (1) no treatment, (2) one or two nucleoside reverse transcriptase inhibitor (NRTI), (3) protease inhibitor (PI)-based HAART without non-nucleoside reverse transcriptase inhibitor (NNRTI), (4) NNRTI-based HAART without PI, (5) NRTI-only HAART, (6) HAART including both PI and NNRTI, and (7) >6 antiretroviral drugs or other associations. Number of changes in antiretroviral treatment type (never treated, first-line treatment, 2–4 treatments, >4 treatments), were all considered as time-updated covariates. Since antiretroviral drugs and their use have evolved since 1996, a period effect (first visit before January 2000 vs. first visit after January 2000) was also considered. Thus 35 parameters had to be estimated for each transition.
Finally the Markov model allowed us to estimate the probability of transition from one stage to another during time interval of length t. Intensities are assumed to be constant over time and the transition probabilities depend on patients' ‘risk profile’ (i.e. their covariate values) and on the length of time interval. We then estimated 3-year probabilities of transition for three a priori-selected covariate profiles representing schematically the early, intermediate and advanced stages of HIV infection at inclusion that thus allowed us to estimate, in a schematic way, the prognosis of patients at these different stages.
For all hypotheses tested, a significance level, α=0·05, was used. Conventional analyses were performed using Stata version 9.0 (Stata Corporation, College Station, TX, USA). The Markov model was estimated using the MKVPCI version 1.0 program [Reference Alioum and Commenges16].
RESULTS
Population study
Overall, 2126 patients were included in this study of whom 1048 (49%) had their first visit after 1 January 2000 (Table 1). Participants were predominantly male (n=1515, 71%). Mean age (±s.d.) was 36±10 years. At-risk heterosexual intercourse was the most frequent HIV transmission category (44%), followed by man-to-man sexual intercourse (37%). At baseline, the median CD4+ count was 358 cells/mm3 [interquartile range (IQR) 204–550] and 24% of the patients had a CD4+ cell count <200 cells/mm3. The median HIV RNA level was 4·5 log10 copies/ml (IQR 3·7–5·1). The comparison of the eligible patients who were excluded (n=471) with those who were included showed that the excluded patients more often had their first visit in one of the participating centres before 2000, were slightly older (38±11 years), had a lower CD4+ (median 104 cells/mm3, IQR 34–305) cell count at baseline as well as a higher median viral load (5·1 log10 copies/ml, IQR 4·6–5·7). On the other hand, excluded patients were less likely to have received antiretroviral treatment.
Table 1. Baseline characteristics of the 2126 patients included in the study (ICONE Group, n=2126, 1996–2004)
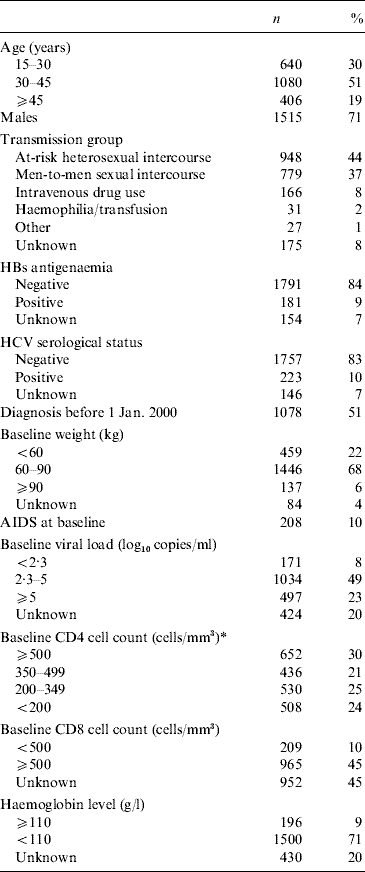
* Missing values of CD4 cell counts were imputed using previous or next measurement, if the time-lapse between the two follow-ups was <3 months for patients without any antiretroviral treatment, or <1 month for treated patients.
Evolution over time
Patients were followed for a median of 2·2 years (IQR 0·8–4·8 years) and had a median of 13 visits (range 2–117). Overall, during 5979 person-years of follow-up, 176 patients (8·2%) experienced clinical progression (67 deaths and 109 AIDS-defining events, i.e. 2·9 progressions per 100 person-years) mainly when their CD4+ cell count was <200 cells/mm3 (75%). Of the 208 patients with AIDS at baseline, 28 died (13·5%) during follow-up. Of the 1918 patients without AIDS at baseline (90·2%), 109 evolved to AIDS (5·7%) and 39 died (2·0%). In the patients who did not experience clinical progression at the end of their follow-up, 44% had a CD4+ count >500 cells/mm3, 25% between 500 and 350, 20% between 200 and 350 and 11% <200 cells/mm3.
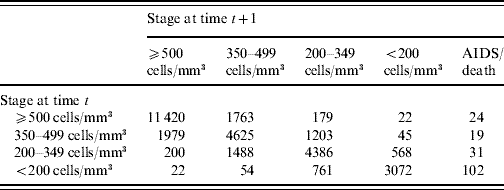
The evolution of the CD4+ cell count with regard to baseline values is shown in Figure 2. The number of transitions from one stage to another during the study period is presented in Table 2. Apart from the transitions towards AIDS or death, transitions corresponding to deterioration in the immune status occurred more than 600 times. The overall 3-year probability of immune deterioration was 41·5% [95% confidence interval (CI) 38·2–45·0] for patients with a CD4+ count >500 cells/mm3, 34·5% (95% CI 31·1–38·0), for patients with a CD4+ count between 500 and 350 cells/mm3, and 18·5% (95% CI 15·7–21·7) for patients between 200 and 350 cells/mm3.
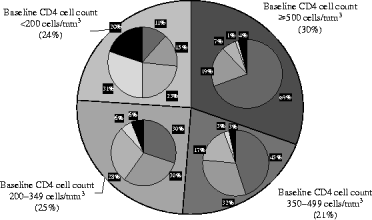
Fig. 2. Distribution of final CD4 cell count (measured at last follow-up) according to baseline CD4 cell count (ICONE Group, 1996–2004). Final CD4 cell counts are represented in the small charts superimposed on the large chart divided according to the baseline CD4 stage. For example, 45% of the patients with a baseline CD4 cell count between 350 and 499 cells/mm3 will have a CD4 cell count ⩾500 CD4/mm3 at their last follow-up.
Table 2. Number of transitions from one stage to another (ICONE Group, n=2126, 1996–2004)
Overall, 468 study subjects (22%) were not treated during the study period (Table 3). Most of the patients who were treated (89%) received a HAART regimen including PI or NNRTI at least once. In the treated patients, 29% received the same category of treatment since inclusion, 19% changed treatment once, 13% twice, 7% three times, and 11% at least four times. Overall, 44% of treated patients (n=941) stopped their treatment at least once, with a median interruption of 35 days (IQR 20–63 days).
Table 3. Description of treatments (ICONE Group, n=2126, 1996–2004)
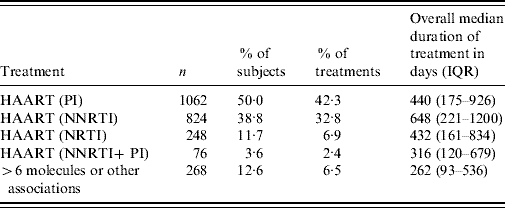
HAART, Highly active anti-retroviral therapy; IQR, interquartile range; NNRTI, non-nucleoside reverse transcriptase inhibitor; NRTI, nucleoside reverse transcriptase inhibitor PI, protease inhibitor.
Multi-state Markov model
Epidemiological and clinical prognostic factors of deterioration
Patients with a CD4+ cell count <200 cells/mm3 were more likely to progress to an updated CD4+ cell count <200 cells/mm3 to AIDS or death. Thus, only this transition was taken into account for the study of clinical progression. The 3-year probability of clinical progression was 21·8% (95% CI 18·3–25·9).
Age was not found to be significantly associated with disease progression. In contrast, women had a lower risk of disease progression to AIDS or death [hazard ratio (HR) 0·48, P=0·007], after adjustment for all other factors. Women with the most recent CD4+ cell count ⩾350 CD4+ cells/mm3 also had a reduced risk of CD4+ decrease (P=0·008 and P=0·04 for women with a CD4+ cell count ⩾500 cells/mm3 and between 350 and 499 cells/mm3, respectively).
Past or present intravenous drug users (IDUs) had an increased risk of disease progression (HR 1·76, 95% CI 1·10–2·82, P=0·018). However, IDUs also seemed to have a reduced risk of immune deterioration, although this tendency was statistically only significant for patients with a CD4+ cell count between 200 and 350 cells/mm3 at time t (P=0·004).
Co-infection with HCV at baseline favoured immune deterioration in patients with an updated CD4+ cell count between 350 and 500 CD4+ cells/mm3 at time t (P=0·001). In contrast, positive HBs antigenaemia was associated with a reduced risk of immune deterioration for subjects with a CD4+ cell count between 200 and 350 cells/mm3 (P=0·022).
A weight gain of >10% was associated with a higher risk of disease progression. A weight loss between 10% and 20% was also associated with a higher risk of CD4+ cell count decrease (HR 1·54, P=0·002).
CD4+ cell count, HIV viral load and other biological factors
Although CD4+ cell count at baseline did not appear to have a significant impact on clinical progression, patients with a baseline CD4+ cell count <500 cells/mm3 (and especially <350 CD4 cells/mm3) were at an increased risk of immune deterioration (Table 4). This negative impact of the lower baseline CD4 cell count was significantly stronger in patients who had an updated CD4 cell count >500 cells/mm3 than in those with a lower updated CD4 cell count (P<0·0001).
Table 4. Estimations of the impact of the main prognostic factors on immune evolution and clinical progression. Markov model (ICONE Group, n=2126, 1996–2004)
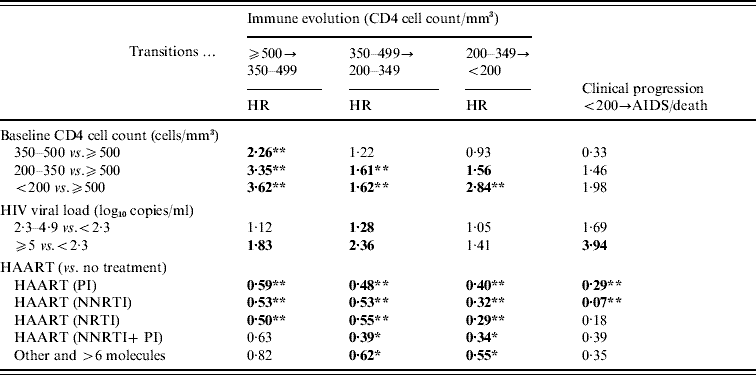
HR, Hazard ratio; NNRTI, non-nucleoside reverse transcriptase inhibitor; NRTI, nucleoside reverse transcriptase inhibitor PI, protease inhibitor.
Bold indicates that the corresponding P value is <0·05.
* Indicates that the corresponding P value is <0·01.
** Indicates that the corresponding P value is <0·001.
The risk of disease progression to AIDS or death was increased for patients with an updated HIV viral load >5 log10 copies/ml (P=0·008). Moreover, an HIV viral load >5 log10 copies/ml was found to be a significant prognostic factor of immune deterioration for patients with a CD4 cell count >350 cells/mm3 (Table 4). In general, the higher the HIV viral load, the higher the risk of immune deterioration, even though the relationship was not always statistically significant.
A higher risk of disease progression was observed for individuals with a lower updated CD8 cell count (<500 cells/mm3vs. ⩾500 cells/mm3: HR 6·67, 95% CI 2·63–16·67, P<0·0001) or haemoglobin level (<11 g/dl vs. ⩾11 g/dl: HR 3·33, 95% CI 1·85–5·56, P<0·0001).
Antiretroviral treatment
Treated patients were at a lower risk of disease progression to AIDS or death compared to untreated individuals. However, this association was statistically significant only for patients with a regimen including PI or NNRTI, even after taking into account the period of inclusion (Table 4). Similar results were obtained when considering only first-line treatments (data not shown).
Overall, treated patients had a lower risk of immune deterioration than did untreated ones whatever the updated CD4 cell count. Indeed, we observed no meaningful differences between treatment effects, according to CD4 strata. PI-based regimens reduced the risk of immune deterioration by between 41% and 60%, while for NNRTI-based regimens, the reduction ranged from 27% to 68%.
Sensitivity analysis
Overall, similar results were obtained in the Markov analyses, in which two consecutive measurements were considered necessary to decide that a transition had really occurred. The only meaningful differences were that positive HBs antigenaemia and past or present IDU were no longer associated with immune evolution (data not shown). Baseline CD4 T-cell count had a very similar effect on both clinical and immunological evolution as shown in Table 4. The results were also similar for the impact of updated viral load and for the treatment effects (data not shown).
Transition probabilities
The Markov model allowed us to estimate the probability of disease evolution for patients with specific profiles [Reference Alioum and Commenges16]. The probabilities of relevant transitions during the following 3 years for three pre-specified risk profiles were estimated (Fig. 3).
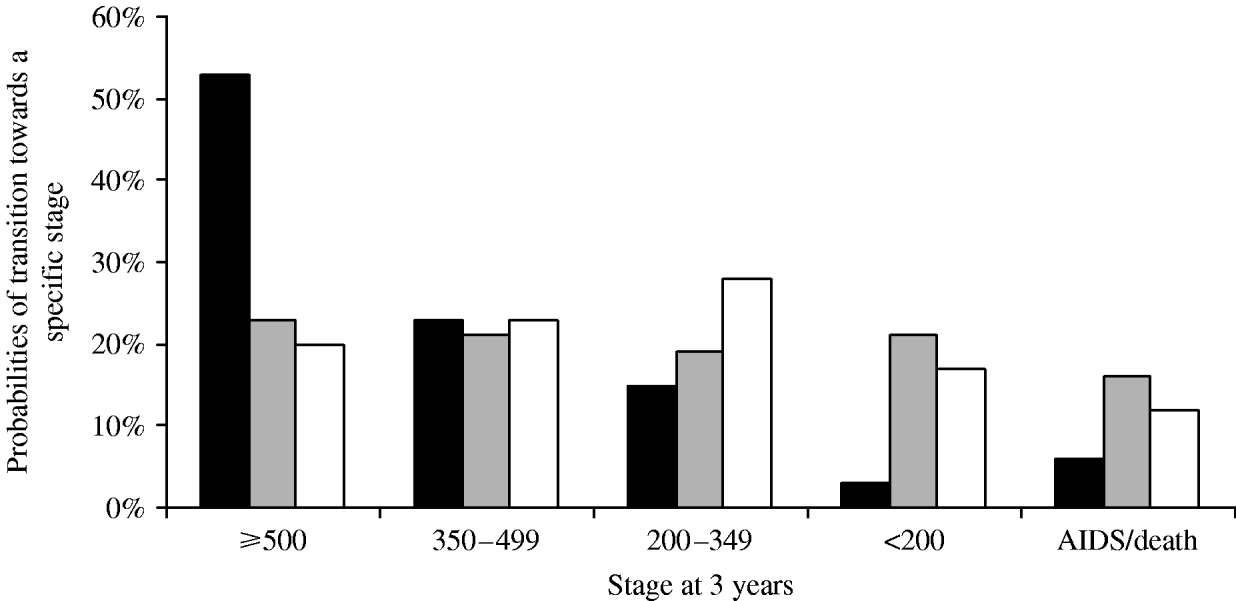
Fig. 3. Probabilities of disease evolution for specific profiles of patients; multi-state Markov model. The first profile (![]() ) corresponds to patients aged <30 years, initially untreated, with a CD4 cell count between 350 and 499 cells/mm3 at baseline. The second profile (
) corresponds to patients aged <30 years, initially untreated, with a CD4 cell count between 350 and 499 cells/mm3 at baseline. The second profile (![]() ) corresponds to patients with baseline CD4 cell count between 200 and 349 cells/mm3, HIV viral load >5 log10 copies/ml, treated at baseline. The third profile (□) corresponds to patients with AIDS-defining illness at baseline, with a CD4 cell count <200 cells/mm3 at inclusion, initially treated by PI-based HAART.
) corresponds to patients with baseline CD4 cell count between 200 and 349 cells/mm3, HIV viral load >5 log10 copies/ml, treated at baseline. The third profile (□) corresponds to patients with AIDS-defining illness at baseline, with a CD4 cell count <200 cells/mm3 at inclusion, initially treated by PI-based HAART.
The first profile corresponded to patients aged <30 years, initially untreated, with a CD4 cell count between 350 and 500 cells/mm3 at baseline. Of the patients corresponding to this profile in our cohort, 26% were subsequently never treated and 74% started a treatment after a median delay of 80 days (IQR 25–236 days). Finally, 53% of patients with such a profile would have >500 cells/mm3 3 years later (Fig. 3), and <6% would develop AIDS or would die during the 3 years after inclusion.
The second profile corresponded to patients with a baseline CD4 cell count between 200 and 350 cells/mm3, an HIV viral load >5 log10 copies/ml, and treated at baseline. At 3 years, there was a 45% probability that patients would have <350 cells/mm3, with a 12% risk of clinical progression during this time interval.
Finally, the third profile corresponded to patients with AIDS-defining illness at baseline, with a CD4 cell count <200 cells/mm3 at inclusion, and initially treated by PI-based HAART. The 3-year modelled evolution showed that these subjects would be almost equally distributed in the four strata of CD4 cell counts, with a 16% probability of death.
DISCUSSION
The results presented above were obtained using a cohort of consecutive patients followed in North-eastern France. Moreover, since the patients included in the cohort were followed only after 1996, all could benefit from HAART according to the guidelines used and updated regularly since that date [2–Reference Yeni8, Reference Yeni19]. However, 471 (19%) patients had to be excluded because of missing CD4 cell counts. Since these patients were more often at an advanced stage of immunodepression (which could increase the difference between treated and untreated patients due to a significant positive impact of HAART), and/or were more often lost to follow-up (which could lower the difference due to potential adherence and observance difficulties), it could be advocated that these two biases counterbalance each other.
Very few other studies used a multi-state Markov model to identify the factors associated with immune deterioration as well as with clinical progression [Reference Alioum14, Reference Sypsa20]. However, multi-state models are appropriate because they efficiently handle any informative censoring which may occur, e.g. when immunological progression is under study: as the risk of death is higher for patients experiencing immunological progression, the censoring of subjects who have died is thus informative [Reference Dancourt21]. Moreover, multi-state models make it possible to identify different covariates associated with different transitions, and to estimate the probability of evolving to a different stage. Indeed, we showed that a majority of patients with >500 CD4+ cells/mm3 initially would be in the same CD4+ stratum 3 years later, and that patients already at an advanced stage of the disease had a high probability of at least partially restoring their immunity. This result could be of interest for counselling individual patients as well as an input in decision analyses aiming at comparing different strategies of care in patients with HIV infection.
CD4+ counts are commonly used to define stages of the immune deterioration since they are one of the major biomarkers of clinical progression and a specific intermediate target for treatment [Reference Rizzardi, Lazzarin and Pantaleo22]. However, this marker exhibits considerable variability over time [Reference Hughes23] which may induce some misclassification. An alternative approach could have been to model CD4+ measurements as a continuous variable jointly with the risk of death or AIDS in a bivariate model. However, we aimed to explore the impact of the covariates at each step of the immune deterioration defined using the standard threshold used in the literature and in international guidelines and classification to allow comparison with existing data and easy clinical interpretation. Some methods that involve smoothing the CD4 count before discritizing this variable and applying Markov modelling [Reference Sypsa20], or incorporating the measurement error into likelihood estimation [Reference Satten and Longini24] could be of interest. However, by using broad CD4 strata, we reduced the risk of potential over-estimation of transition intensities due to this variability. Moreover, the confirmation of a transition from one stratum to another by two consecutive measurements of CD4 cell count in the same new stratum led to similar results, and suggested that our conclusions are robust.
Markov models also imply that the risk of progression from one CD4+ stage to the next is independent of the risk of progression through previous stages. This hypothesis may be questionable. A semi-Markovian model avoiding this assumption could be of interest in this context. In addition, this type of model would allow non-parametric modelling of waiting-time distribution, conversely to the model applied which imposes exponential distribution. However, despite the flexibility offered by semi-Markovian models, the interpretation of their regression coefficients is less convenient as they cannot be assimilated directly to hazard ratios, and transition probabilities are more difficult to obtain.
Overall, our results are consistent with those found in other cohorts. Indeed, other studies have already reported better evolution in women [Reference Arici25, Reference Nicastri26], and increased risk of clinical progression in IDUs [Reference Egger9, Reference Sterne27]. Although losing weight was also a marker of a faster evolution towards AIDS or death [Reference Wheeler28, Reference Wheeler29], our Markov analyses also suggested that weight loss could be associated with some deterioration in patients' immunity. Since unintentional weight loss became more frequent despite better control of HIV in recent years [Reference Tang30], these results emphasize the need to pay attention to weight loss in patients infected with HIV.
Updated values of HIV viral load, CD8 cell count or haemoglobin levels were significantly associated with clinical progression, as previously reported [Reference Binquet31, Reference Thiebaut32]. In agreement with previous publications [Reference Konopnicki33, Reference Rockstroh34], HBV and HCV co-infections at baseline did not appear to be significantly associated with 3-year clinical progression towards AIDS or death, despite the increased risk of liver-related mortality observed in cohort studies [Reference Salmon-Ceron35, Reference Gebo, Diener-West and Moore36].
CD4+ cell count at baseline had no impact on 3-year clinical progression, even though only the transition from the lowest stratum of CD4+ cell count towards AIDS or death was investigated in our model. It has already been argued that baseline CD4 cell count has a lower prognostic value than the updated CD4 cell count [Reference Chene10]. On the other hand, in our model, baseline CD4+ count was significantly associated with the risk of immune deterioration, independently of other prognostic factors including antiretroviral treatment. Reaching a CD4+ count >500/mm3 is a pivotal goal of HIV therapy, because it is associated with a better clinical outcome [Reference Lewden37–Reference Gras39]. It can thus be advocated from these data and the results of our model that, although an updated CD4+ count is an important prognostic factor of clinical evolution, the likelihood and the speed to reach high CD4+ levels is partly and significantly dependent on baseline CD4+ count. This could lead to significant medium- and/or long-term differences in clinical evolution.
Although our Markov model did not provide perfect control for any potential indication bias, which could have induced an underestimation of the treatment effect [Reference Sterne27], it showed that HAART greatly reduces the risks of immune deterioration, and of clinical progression to AIDS, whatever the number of regimen changes and the updated CD4+ count stratum. Point estimates were in favour of the protective effect of all treatment regimens compared to no treatment, even though no distinction was made between unboosted and boosted PI. Moreover, in naive patients, HAART including PI or NNRTI reduced the risk of clinical progression and immunological deterioration to a greater extent than did the three NRTI-only regimens.
Our results suggest some advantages of early antiretroviral treatment. Indeed, patients with a HAART regimen are at a lower risk of immune deterioration and clinical progression, even when they have a relatively high CD4+ cell count. However, our model did not determine how this immunological advantage of early HAART may be counterbalanced by an increasing risk of developing resistance and intolerance, even though these potential negative effects are indirectly taken into account in this model from a real-life cohort (with modifications in antiretroviral therapy due to resistance and tolerance difficulties). Since tolerance to HAART has significantly improved over time, and considering that nearly half of the patients were followed before 2000, it could be advocated that these results would be strengthened by the currently available, more potent and better tolerated antiretroviral treatments.
Decision analyses could be particularly appropriate and helpful in order to better determine the best therapeutic strategy, as this allows simulation of the long-term evolution of patients infected by HIV according to the different strategies used, and the taking into account of both the positive and negative consequences of these strategies [Reference Tebas40]. This study, which provided ‘real life’ transition probabilities from one immunological stage to another, could lead to a future decision analysis, which may be helpful in determining the potentially beneficial therapeutic strategies for HIV-infected patients with different risk profiles. Such a decision analysis based on our study population is ongoing.
ACKNOWLEDGEMENTS
The authors thank all the physicians and the technicians involved in this study: Patricia Eglinger (Belfort); Christelle Braconnier, Benoit Broussolle, Romain Cailliod (Dijon); Marie-Pierre Bouillon, Mireille Stenzel (Nancy); Edith Ebel, Patricia Fischer (Strasbourg); Chantal Roche (Besançon); Philippe Choisy, Francis Marysse (Tourcoing); as well as Philip Bastable for rewriting and editing.
DECLARATION OF INTEREST
None.


