


I
There is a large literature documenting how familiarity bias affects investing decisions, and the role of networks in influencing individual decision making. In this article, we connect that literature to a study of the decisions of wealthy people to purchase Citibank stock in the 1920s. This is the first study of which we are aware that uses the list of stockholders in a firm to analyze who decides to buy the firm's stock. We are able to do this because of three unique features of this historical example that make this analysis possible. First, we are able to access the information about the identity of stockholders. It generally is not possible to analyze the identities of shareholders because such data are confidential. Historical data on ownership remain confidential, but we were granted permission to use historical Citibank shareholder lists because we found a way to match individuals’ names to names from other sources without jeopardizing confidentiality. Second, the historical context of our example (a large New York City bank, whose shares were owned only by the rich) permits us to identify a list of individuals – members of the New York City business network – that includes both those who chose to be stockholders and those that could have been shareholders but were not. Third, the network's structure allows us to trace how business connections affect purchase decisions.
We begin by examining holdings across the US counties and in other countries to investigate whether the proximity of a Citibank branch affected ownership of Citibank shares. Our county-level analysis also considers the effects of distance from New York and various demographic characteristics. We then turn to our main, individual-level analysis. We construct a mapping of the network of business executives in New York City, and investigate how the characteristics of executives – including income, influence within the network, and familiarity with finance – mattered for determining who invested in Citibank. We also investigate the extent to which members of the network influenced each other's investment decisions. Specifically, we explore how one's proximity within the network to Citibank officers and directors, or to those holding Citibank shares, influenced executives’ decisions to purchase Citibank stock. We believe ours is the first study of its kind; we are not aware of other studies that examine individual stock purchase decisions by combining a company's list of stockholders with a list of individuals (New York City executives in our case) who comprise the most relevant population of potential purchasers of that company's stock.
During our sample period, Citibank was rapidly growing its businesses, transforming its business structure and actively issuing new equity, all of which suggest an environment in which differences in information (and in familiarity) should have been relevant influences on the individual share purchasing decisions of potential investors.
Citibank stock was not an investment option for everyone. It had a high price per share. It also was sold mainly in the over-the-counter (OTC) market, where it was uncommon for very small numbers of shares to be traded in any transaction.Footnote 1 Furthermore, mutual funds had not yet come into existence as a means of owning shares.Footnote 2 Therefore, Citibank shares could only be held by the wealthy. Consistent with evidence from today's markets, the willingness to own shares also was limited by distance: wealthy individuals were less likely to own Citibank shares, ceteris paribus, the farther away from New York City they lived.
We find that constraints related to wealth and location were not the only barriers to purchasing Citibank shares. Despite the substantial expansion in the number of Citibank shareholders during the 1920s (which we link, at least in part, to the frequent issuance of shares by Citibank during the 1920s), only a tiny fraction of the wealthy business elite living in the New York City metropolitan area owned Citibank shares (roughly 1 percent in January 1925, and 2 percent in January 1929).
In our county-level and country-level analysis, we find that the presence of a Citibank branch substantially mitigated the effect of distance on the propensity to own Citibank shares. In our analysis of individual shareholding within the New York City metropolitan area, we find that in addition to individual characteristics related to wealth, other factors mattered: knowledge about financial services and one's influence within the network increased the probability of becoming a Citibank shareholder. Those influences, however, were reduced after 1927. In fact, highly influential people became less likely than others to purchase Citibank shares during the price boom of the late 1920s. These results all point to the role of familiarity in influencing stock purchase decisions. As Merton (Reference Merton1987) argues, information costs can be a barrier to purchasing shares. Proximity to branches, knowledge of the financial sector, and personal connections to Citibank shareholders all can be seen as ways of increasing familiarity and reducing information costs.
Network connections were an important contributor to individuals’ purchase decisions. Having business connections with Citibank officers and directors, even indirectly, substantially increased the probability of buying Citibank shares. Furthermore, having a business connection with a Citibank shareholder who was not a Citibank officer or director also had an important positive effect on the decision to buy Citibank shares. The fact that both kinds of network connections mattered for the decision to buy shares indicates that influence reflected more than the transmission of inside information; executives imitated each other's behavior, perhaps because connections with existing shareholders increased familiarity with Citibank stock. The role of some network influences, like many other identifiable influences, became less important in explaining who became a new shareholder during the price boom of the late 1920s. We conjecture that this most likely reflected the rising importance of other information and influences during the price boom, which overcame barriers to familiarity (i.e. media coverage of the price boom).
To identify network influences on purchases, we exploit two plausibly unidirectional linkages. First, we assume that Citibank officers and directors influence the share purchases of others in the network, but not vice versa. Second, when analyzing new shareholders (those that have become shareholders in the past two years), we assume that current shareholders (those who have owned Citibank shares two years before and still own them) influence the share purchases of others in the network, but not vice versa. We measure these two channels of influence separately by constructing variables that capture either the network influence of current Citibank officers and directors, or the influence of current shareholders who are not Citibank officers and directors.
We also perform a placebo test to see whether network connections to Citibank officers and directors had a different influence on Citibank shareholding than network connections to other large banks’ officers and directors. This test investigates whether contact with influential New York bankers produced a general sectoral interest in New York bank stocks, of which Citibank was one. We find that network influences from Citibank officers and directors remain unchanged after controlling for network influences of other large New York banks’ officers and directors. Once-removed connections to those people, however, did increase the probability of purchasing Citibank shares, which suggests that once-removed connections via the network may have affected broader sectoral perceptions. Interestingly, we also find that business connections to other large New York banks reduced the probability of owning Citibank shares. Apparently, familiarity with a close substitute for Citibank shares made the purchase of Citibank shares less likely.
We find some of these results unexpected, if not surprising. First, the very small proportion of relatively wealthy New York business executives holding this important stock is striking. We expected portfolio diversification considerations to encourage much broader participation. Second, our finding that familiarity (not inside information, per se) is a key influence on stockholding is interesting, given that stockholders had no access to any information aside from disclosures that were readily available to non-stockholders. Third, the varying importance of familiarity over time is an interesting counterpoint to the importance of familiarity: as people observe stock prices rising in 1927–8, familiarity becomes less important.
Our discussion is divided as follows. Section II reviews the most important recent academic literature on familiarity and home bias. Section III reviews trends in Citibank shareholding during the 1920s, and provides relevant background relating to Citibank's circumstances as a national bank operating in New York City during the 1920s. Section IV summarizes the data sources that we employ in our analysis of the stock purchase decisions by business executives residing in the New York City metropolitan area. Section V analyses county-level and country-level data on the locational characteristics of Citibank shareholders, and shows the influence of proximity to a Citibank branch, as well as distance from New York and various demographic characteristics. Section VI presents logit and tobit regression analysis of individual shareholder purchase decisions and network influences of New York business executives. Section VII concludes.
II
Familiarity and stock purchases
Distance (i.e. positive home bias) is a well-recognized influence on investors (French and Poterba Reference French and Poterba1991; Tesar and Werner Reference Tesar and Werner1995; Coval and Moskowitz Reference Coval and Moskowitz1999; Dahlquist et al. Reference Dahlquist, Pikowitz, Stulz and Williamson2002; Strong and Xu Reference Strong and Xu2003; Speidell and Xing Reference Speidell and Xing2004; Craft Reference Craft2006; Giannetti and Laeven Reference Giannetti and Laeven2012; Philips et al. Reference Philips, Kinniry and Zilbering2010; Philips et al. Reference Philips, Kinniry and Donaldson2012).
Notwithstanding the advantages of portfolio diversification, home bias has been found to be an important influence on investor decisions to buy a company's shares. Karlsson and Norden (Reference Karlsson and Norden2007) find that home bias is negatively related to wealth and positively related to age. Keloharju, Knupfer and Linnainmaa (Reference Keloharju, Knupfer and Linnainmaa2012) find that consuming a firm's product increases the probability of investing in the firm. This builds on other research about factors that influence investor interest as the result of greater familiarity, financial literacy, physical proximity and education (Huberman Reference Huberman2001; Coval and Moskowitz Reference Coval and Moskowitz1999; Hong, Kubik and Stein Reference Hong, Kubik and Stein2004; Giannetti and Yafeh Reference Giannetti and Yafeh2012; Hong and Kostovetsky Reference Hong and Kostovetsky2012; Okawa and van Wincoop Reference Okawa and van Wincoop2012; Bekaert et al. Reference Bekaert, Hoyem, Hu and Ravina2016).
The literature suggests several factors that should be relevant in understanding differences across investors and issuers in the identities of stockholders in the 1920s, including the distance between the issuer and the investor, the economic and demographic characteristics of the investor (wealth, education, consumption of issuer's product), previous returns on the issuer's equity and recent issuance activity (which may influence the firm's attempts to broaden its investor base, and investors’ familiarity with the issuer).
When analyzing investor behavior in the 1920s there are historical factors that should be considered. In the early twentieth century, and especially in the period 1917–29, the United States experienced a major shift in the distribution of shareholdings in publicly held firms. On average, the number of shareholders in publicly traded firms doubled from 1900 to 1917, and then doubled again from 1917 to 1928. Judging from many firms’ experiences, the number of shareholders appears to have continued to grow rapidly during the boom of 1927–9 (comparable figures are not available for 1929).
As H. T. Warshow (Reference Warshow1924) and Gardiner Means (Reference Means1930) showed, the rapid average growth in the number of shareholders over 1917–28 differed dramatically across sub-periods and across different industries and firms. According to Means, new financing needs and tax policies during World War I (especially the highly progressive taxation of income)Footnote 3 drove firms that had previously relied on wealthy investors to search out ‘persons of moderate means’. While the income of the rich was subject to high taxation, on average, per capita disposable income grew significantly (cumulatively by about 5 percent) from 1916 to 1919, which led issuers to target this ‘middle class’ to fund growth. On average, 1923–8 saw a smaller rate of growth in the number of shareholders for the firms in Means’ sample (3.8 percent per year, compared to 11.3 percent per year for 1917–23), and that led Means to conclude that the increase in stockholders observed for the period 1917–28 was mainly due to special factors related to World War I, and ‘not the result of a permanent [acceleration of the ownership dispersion] trend’.
Means’ view that shareholder ownership distribution was not shifting dramatically in the 1920s was based on calculations of the average experience of 31 firms. But for some firms (such as International Paper, which was included in Means’ sample, and Citibank, which was not), during the 1920s, the number of shareholders increased by roughly an order of magnitude. For Proctor and Gamble, the number of shareholders more than tripled, while it doubled for American Telephone and Telegraph, and increased by about 50 percent for Du Pont and General Electric. For many other firms, however, the number of shareholders was static or declining: US Rubber and US Steel saw declines while Standard Oil and Swift experienced slight increases. Firms in established industries – which were over-represented in Means’ sample – saw little growth in shareholders. Firms in the most technologically dynamic sectors saw higher growth in shareholders, and these were also the sectors experiencing the biggest growth in equity capital, and much higher equity returns (Nicholas Reference Nicholas, Lamoreaux and Sokolof2007). From many high-growth firms’ perspective, the period 1923–29 was the one that most transformed their ownership structure.
New York banks in the 1920s
Several of New York City's largest banks grew especially quickly by issuing stock in the 1920s. As Table 1 shows, Citibank was the largest bank in New York City and it was among the fastest growing in assets and capital. Citi, Chase, Chemical and Bank of Manhattan were the fastest growing in assets of the large New York City banks from 1924 to 1928, and all of them expanded their capital in 1926–8, as well. Of these, only Citi and Chase also increased their capital substantially from 1924 to 1926. Increasing capital also meant increasing their number of shareholders. Citibank's number of shareholders increased by an order of magnitude from 1925 to 1930. Large New York banks, like path-breaking non-financial firms such as General Electric and General Motors, were highly innovative during the 1920s. Citibank dramatically changed its structure and lines of business in the 1920s. It spread its branch network throughout the world, as well as throughout the five Boroughs of New York, and it entered aggressively into the growth areas of portfolio management and securities underwriting. Innovative, growing firms like Citibank also needed to raise new capital repeatedly, which meant that they had an interest in attracting new investors.
Table 1. Large NYC banks’ asset and capital growth, 1924–8

All values are as of 31 December of each year.
* Uses values as of 31 Dec. 1925.
** Uses value as of 15 Nov. 1924.
Data source: Moody's Manual.
Limits on the expansion of shareholders in the 1920s likely reflected informational barriers. Even rich New Yorkers may have lacked an understanding of stock valuation, and may have been unfamiliar with Citibank's changing structure and prospects. Disclosures by public firms were quite limited. Basic balance sheet information was available (and was required to be reported publicly for all national banks). Information about dividends and stock prices (available in the form of ‘tear sheets’ handed out by stockbrokers) was also available. But even the most basic information about Citibank's revenues and profits from various lines of businesses remained obscure, with the exception of selective tidbits revealed in the annual letter from the president to the stockholders, or aggregate profits reported annually in investment manuals such as Moody's Finance Manual.
Networks of business relationships may have been an important source of information transmission that wealthy New Yorkers relied upon when deciding on stock investments. As we show below, it is possible to reconstruct the networks of corporate executives – officers and directors of all corporations operating in New York CityFootnote 4 – and trace potential influences related to network contacts. When doing so we can identify the influence of Citibank officers and directors on executives with whom they had network connections, as well as the influence of other banks’ officers and directors, and Citibank shareholders, all of whom may have influenced business associates’ purchase decisions.
Sorting between those two influences can provide unique insight about why network connections influence stock decisions. If someone is influenced only by contact with a Citibank insider, that is more likely to reflect the communication of relevant private information. In contrast, influence through network connections by stockholders who are outsiders is more likely to reflect other kinds of communication, or possibly just simple imitative behavior (Banerjee et al. Reference Banerjee, Chandrasekhar, Duflo and Jackson2013)..
To date, there are no studies analyzing which investors became stockholders in which firms during the 1920s, or the possible influences of networks in encouraging stock purchases.Footnote 5 The reason is simple: data about the identities of stockholders are confidential, and even historical data on stockholders’ identities are considered sensitive and proprietary.
Our study was made possible when we found a way to use confidential shareholder data without compromising confidentiality. We thus are able to identify shareholders, measure their relevant characteristics, and locate them within the New York business network. This was accomplished by assembling the relevant pieces of the dataset at the Citibank archive, with the active participation (and patience) of its staff, and then anonymizing the data for use outside the archive.
III
Citibank's formal name was National City Bank of New York. It was chartered under the National Banking Act as a successor to a state-chartered bank whose charter began in 1812. By the 1920s, Citibank was one of the leading commercial banks in New York City and in the world. In 1922, its president, Charles E. Mitchell, wrote that ‘directly through our own branches and those of our affiliates, The National City Company and the International Banking Corporation, we are in daily touch with and giving service to banks and individuals in every city and hamlet in every state of the Union. Spanning the world, itself, we stand at the crossroads of the world's commerce in contact with all nations…’
There are several factors that made bank stocks like that of Citibank different from other publicly traded stocks. First, until 1927, national banks like Citibank were prohibited from splitting their shares (Kane and Wilson Reference Kane and Wilson1998). That resulted in high share prices per share, which limited Citibank's shareholders to the wealthy. As Figure 1 shows, Citibank's price per share was the same order of magnitude as per capita national income during the 1920s (per capita national income grew to $715 in 1929; Kuznets Reference Kuznets1941, p. 25). Citibank did split its shares five-for-one in January 1929 (Figure 1 maintains consistent pricing per share, as if the split had not occurred). The split occurred just after our January 1929 observations of shareholders.

Figure 1. Citibank's share price, 1924–30
Source: Commercial & Financial Chronicle weekly quotations.
Note: A five-for-one stock split occurred on 12 January 1929. The figure adjusts by multiplying share prices by five from that date.
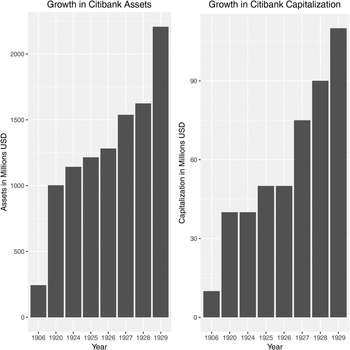
Other factors may have influenced Citibank's stockholder base. First, Citibank – like other firms at this time – relied on rights offerings to sell new shares. Citibank issued shares several times in the 1920s, as its growing capital stock indicates (Figure 2). Citibank's growth was similar to the growth rates of Chase, Chemical and Manhattan.Footnote 6 From 1920 to 1929, Citibank issued shares into the market several times (in 1920, 1925, 1927, 1928 and 1929). Those share issues supported the more than doubling of its total assets from 1924 to 1929 (the capital stock shown in Figure 2 consists of roughly equal amounts of ‘paid in capital’ and accumulated ‘surplus plus undivided profits’). Existing stockholders had the option to buy new share offerings, although they could also transfer the right to buy to others (and these rights to buy traded as assets in the market). Given that Citibank was an active equity issuer during the 1920s, it is important to bear in mind that its paid in capital was growing rapidly in this decade. It remains somewhat unclear how widely traded the rights to buy new shares were, and it is possible that during the 1920s new share issues may have been purchased initially mainly by preexisting stockholders, although our analysis below of the growth in shares owned by preexisting shareholders suggests that a large number of rights were purchased by new shareholders.

Figure 2. Citibank assets and paid in capital
Source: Citibank Annual Reports.
Note: All figures are for December of each year except for asset values in 1906 (June) and 1920 (February).
Second, bank shares were traded in the OTC market within a network of dealers specializing in bank and insurance stocks (the prices plotted in Figure 1 are weekly OTC quotations from the Commercial and Financial Chronicle). These markets appear not to have been as liquid as the New York Stock Exchange (NYSE), with transactions occurring infrequently (Loeser Reference Loeser1940; O'Sullivan Reference O'Sullivan2007), in bundles of a few shares, and in small volume. Some of that illiquidity reflected the high prices of bank shares and the selective nature of their shareholder base (Forum 1925; Gorton and Tallman Reference Gorton and Tallman2015).
Third, from 1926 to 1928, the largest New York banks actively discouraged small-sized stock trades.Footnote 7 Several New York banks delisted from the New York Stock Exchange simultaneously in January 1928 in reaction to what they regarded as unsustainable increases in their stock prices, which they (wrongly) saw as the result of the exchange's new practice of executing and reporting small stock purchase transactions for their shares.Footnote 8 The New York banks did not return to the New York Stock Exchange for decades after delisting in 1928. New York banks, like other US banks, traded primarily in the OTC market before that delisting, and exclusively in the OTC market after the delisting.
These regulatory and institutional factors made Citibank somewhat unusual as an issuer, both during the 1920s, and in comparison to present issuers.Footnote 9 The combination of the prohibition on stock splits, the use of rights offerings to distribute shares, and the reliance on OTC markets for trading in shares, should have limited the number of shareholders in Citibank, compared both to other fast-growing issuers of the time and even more with respect to current issuers.
IV
We collected the lists of Citibank stockholders for January 1925, January 1927 and January 1929. These data contain the names, addresses and number of shares owned for more than 80 percent of all shares on those dates.Footnote 10 Because the data list names and addresses, it is possible to match these data with other sources to link names across data bases. Our Online Data Appendix describes our sources in detail. Table 2 reports which data are gathered from which sources. Table 3 defines the variables used in our empirical analyses. The remainder of this section provides a brief summary.
Table 2. Data sources

Table 3. Variable definitions

In our country-level analysis, we use a list of countries from Wimmer and Min (Reference Wimmer and Min2006) and match it with the shareholding and branch location information obtained from Citibank's archive (from voting records and annual reports, respectively). We restrict our list of countries to exclude those in Africa, given that no African country had any Citibank shareholders. We define countries as both imperial colonies and sovereign nations. In our county-level analysis, data on demographic characteristics are from various Censuses, taken from the ICPSR database. We also use information from Security Dealers of North America to identify the locations of securities dealers throughout the US.
In our logit and tobit analysis of individuals’ shareholdings, we focus our attention on the sample of individuals contained in the Directory of Directors in the City of New York for 1929–1930 and examine how individual characteristics and network influences can explain which of those business executives became a Citibank shareholder. The analysis is performed separately for 1925, 1927 and 1929. This source lists each director and officer of each corporation based in the New York City metropolitan area. Summary statistics for all the variables used in our individual regression analysis are reported in Online Appendix Table A1. Correlations are reported in Online Appendix Table A2.
For the sample of names contained in the Directory of Directors, we matched names with several other sources. We matched names with our list of Citibank stockholders, with a list of federal income taxpayers, with Citibank Annual Reports (which list officers and directors) and with lists of names appearing in Poor's Register of Directors for 1928 and Who's Who In America for 1928. Similarly, for other large New York banks, we collected names of their officers and directors from the Directory of Directors. Other large New York banks are defined as Bank of Manhattan, Chase National Bank, Chatham-Phenix National Bank & Trust Co., Chemical National Bank, Corn Exchange Bank, First National Bank of the City of New York, National Bank of Commerce and National Park Bank. We also identify individuals who work for securities dealers. Those firms are identified using the Securities Dealers of North America (1929).
In many cases, using exact address matches or distinctive names, or both, we were able to verify matches immediately. In other cases, where matches were not immediately obvious, we employed a variety of methods to obtain additional matches while ensuring the accuracy of our matching procedure. We used a variety of sources to verify that matches were correct, including Ancestry.com, phone books, Manuscript Census data, and other information. Generally, we had very few uncertain matches (only 18 cases in our matching of Citibank shareholders with the Directory of Directors, and similarly small percentages for other datasets). If we were unable to be sure of a match, despite our efforts, in the case of Citibank shareholder identity, we conservatively assumed that the individuals were not matches. In the other matching, we conservatively assumed that ambiguous matches were actual matches. (The reason for this difference in procedure is that one of these variables is our dependent variable, the others are independent variables.) Alternative treatment of ambiguous matches (such as dropping them) does not affect our results. The full description of the methods used for matching are reported in the Online Data Appendix.
Our taxpayer information comes from a unique release of information by the Internal Revenue Service (IRS). In 1925, the IRS made income tax information on all taxpayers available to the public. Newspapers throughout the country published this information, with varying levels of detail and completeness. Typically, the published data list the name, address and the amount of income tax paid. Coverage differs somewhat across locations. In some cities, published names include only the highest-paying taxpayers, while in other cities, the list is more comprehensive. Data for the country as a whole, with particular emphasis on residents located in the New York area, were collected from the New York Times, which provides the most comprehensive list of taxpayers for the New York City area. Although the data are only available for 1924, this source provides a unique window into the levels of income of individuals.
Data from other business network sources (Poor's Register of Directors for 1928 and Who's Who in America for 1928) are used as indicators that an individual is sufficiently prominent to be listed in those directories.
V
As Figure 3 shows, the number of Citibank shareholders grew dramatically from 1925 to 1930. The use of shares in the June 1926 acquisition of Peoples Trust Co., the February 1925, February 1927 and June 1928 rights offerings of new shares, a five-for-one stock split in January 1929, the February 1929 rights offerings of new shares, the use of shares to acquire shares of Farmers’ Loan & Trust Co. in June 1929, and perhaps the continuing price boom itself resulted in the more than tripling of the number of stockholders during 1929 alone. From January 1925 to January 1929 – the period studied here – the number of shareholders nearly tripled, even in the absence of a stock split, and despite the rising price per share. Between January 1925 and January 1927, 5,315 new shareholders bought at least one share of Citibank stock and held it until January 1927. Between January 1927 and January 1929, the comparable number was 6,334. The numbers of new shareholders who bought five or fewer shares were 3,489 for 1925–7 and 3,045 for 1927–9.

Figure 3. Number of Citibank shareholders
Source: Reports of votes at Citibank annual meetings (Jan. 1925, Jan. 1927 and Jan. 1929). Moody's Manual of Investments (31 Dec. 1929 and 31 Dec. 1930).
As Figures 4 and 5 show, the size composition of shareholders changed from January 1925 to January 1929. In 1925, 5.7 percent of shares were held by those that owned only one share, but by January 1929, that had risen to 11.6 percent despite the steep rise in the price per share. Mostly shares were owned by individuals; companies and organizations accounted for less than 5 percent of shareholders and less than 15 percent of shares in both 1925 and 1929.

Figure 4. Shareholding size distribution
Source: Reports of votes at Citibank annual meetings (Jan. 1925 and Jan. 1929).

Figure 5. The changing size distribution of shareholders
Source: Reports of votes at Citibank annual meetings (Jan. 1925, Jan. 1927 and Jan. 1929).
Online Appendix Figure A1 provides a map of Citibank shareholding in the US by county. The Northeast (as defined by the Census) accounted for 85 percent of Citibank's shares, and more than 61 percent of its shareholders in 1925. In January 1929, the proportions of shares and shareholders in the Northeast were 79 and 64 percent. The Midwest (which was the next largest region) accounted for 15 percent of shareholders in 1925 and 14 percent in 1929, and 6 and 9 percent of shares, respectively, in 1925 and 1929. Shareholding was concentrated in cities. In January 1925 and January 1929, respectively, Manhattan alone accounted for 71 and 62 percent of all Citibank's shares, and 20 and 24 percent of its shareholders. In both January 1925 and January 1929, the 15 counties (including Manhattan) that contained the greatest number of shareholders accounted for 42 percent of Citibank shares and 52 percent of its shareholders. In most counties (2,474 counties in 1925 and 2,379 in 1929), no Citibank shares were held (there were a total of 3,064 counties in the United States in 1930).
A minority of shareholders sold their shares in Citibank from 1925 to 1929. A total of 1,416 shareholders (or 26 percent of all shareholders) sold some or all of their shares between January 1925 and 1927 (that is the number who either were no longer listed as shareholders, or who reduced their number of shares). The number of sellers for the period January 1927 to January 1929 was 3,590 (or 38 percent of all shareholders). A large majority of current officers or directors, or their family members we have been able to identify (which accounted for roughly a fifth of total shares in 1925), never sold shares from January 1925 until January 1930. This contradicts the conjecture by Kane and Wilson (Reference Kane and Wilson1998) that the sharp increase in the number of shareholders for New York banks may have represented a shareholder ‘run’ in which blockholders shed stock during the price boom.
The small number of shareholders who sold shares from 1925 to 1929 – a period when the number of shareholder rose by roughly 12,000 – exemplifies the potentially important relationship between the rise in shareholders and issuance of new shares. The warrants to purchase new shares distributed via the several rights offerings could be transferred from existing shareholders to new shareholders via the network of dealers.
Using our data on shareholders in 1925, 1927 and 1929, along with data on the rightsFootnote 11 to purchase new shares offered to existing shareholders in February 1925, February 1927 and June 1928, we examine stockholders who are present at both times and calculate the increase in their number of shares for the period January 1925 to January 1927. We compare that increase with the amount of increase that would have occurred by fully exercising the right to purchase offered in February 1925. We find that 27 percent (or 1,098) of shareholders did not fully exercise their purchase rights. Similarly, we examine the shareholders present in both January 1927 and January 1929 who did not fully exercise their rights to purchase shares offered in February 1927 and June 1928. We find that 33 percent (or 2,052) of those shareholders did not fully exercise their purchase rights. Presumably, those shareholders sold their warrants in the market. This suggests that stock offerings may have played a major role in expanding the number of Citibank shareholders in the 1920s. More generally, this evidence may help to explain why it was that fast-growing firms (i.e. those more likely to be offering shares into the market) were more likely to experience dramatic increases in their number of shareholders during the mid 1920s.
County-level and global regressions
As a first step toward analyzing trends in ownership, we aggregate shareholders and shares at the county level, and employ tobit regressions to explore the relationships between the propensity for shareholding and county characteristics that capture attributes that we expect to be relevant to the propensity to own shares. The dependent variable is defined alternatively as the county's proportion of shares, or its proportion of shareholders.
The vector of county characteristics, informed by the literature reviewed above, includes 19 variables, which capture eight sets of influences: I. Distance from New York City, II. Demography (total population, percentage white, percentage native white, percentage rural, percentage of land in farmland, population per square mile, whether the county contains a ‘megacity’ – one of the 20 most populous cities as of 1930, the number of manufacturing wage earners, and the percentage of population over age 45), III. Access to Media (number of radios per family in the county), IV. Education (percentage illiterate, percentage 16–17-year-olds attending school), V. Wealth (the number of homes worth more than $10,000 divided by the population, the total farm value per farm), VI. Presence of Securities Dealers (number of dealers per capita in the county), VII. Economic Environment (unemployment rate, rate of population growth from 1920 to 1930), and VIII. Presence of a Citibank Branch (defined as any Citibank-affiliated office, exclusively consisting of securities affiliate offices, located in that county). By 1928, there were 45 domestic branches outside of New York City mostly located in the 50 largest cities based on the 1930 Census and 107 international branches, including both deposit-taking branches and securities affiliate offices, in 28 countries in various regions such as Europe, Asia (China, Japan, India and Southeast Asia) and the Americas (Canada, Caribbean islands, Central America and South America).
Tobit regression results are reported in Table 4 for the percentage of Citibank shareholders as a fraction of county population (Online Appendix Tables A3 and A4 report similar regressions using percentage of shares held in the county, and the number of shares, as alternative dependent variables). Counties closer to New York,Footnote 12 with more expensive homes, older residents and higher population density all exhibit greater shareholding.
Table 4. County-level regressions (percentage of shareholders in county)

Note: *, **, *** indicate statistical significance at the 10%, 5% and 1% levels. Dependent variable is the percentage of shareholders in the county multiplied by 100. All regressors are defined in Table 3. For 1929–1925, the dependent variable and Citi Branch variable is calculated as the difference between the 1929 value and 1925 value. Marginal effects at the mean are reported in parentheses. For indicator variables, this captures the effect of a change from zero to one. For continuous variables, this captures the effect of a standard deviation increase calculated at the mean. Average percentage of shareholders is also multiplied by 100.
Table 4 reports tobit regressions for 1925 and 1929, and the change from 1925 to 1929. Distance from New York City and several other county characteristics are significant in one or both years for explaining the propensity to own Citibank shares. All eight categories of regressors capture important determinants of share ownership. Shareholding declines with distance from New York (although this is less important in 1929 than in 1925), a greater share of rural residents (also less important in 1929) and a higher proportion of farmland. It increases with a higher share of expensive housing, greater population density, megacity status, a greater share of older residents, total population size and more radios per family (which is less significant in 1929). Interestingly, the presence of manufacturing is associated with a lower percentage of shareholders, but a larger number of shares (Online Appendix Tables A3 and A4). It may be that manufacturing is associated with a greater degree of inequality (capitalists hold more shares, workers do not). After controlling for all these county characteristics, the presence of a Citibank branch significantly raises the percentage of shareholders in both 1925 and 1929, although the effect is much larger in 1925. In Online Appendix Tables A3 and A4, we find it also is associated with a higher percentage of shares and a higher number of shares in that county. Interestingly, the effect of the presence of a Citibank branch is much more persistently large (in 1929 relative to 1925) in its effect on the percentage of shares or the number of shares 1929 than it is on the percentage of shareholders. This suggests that over time, the availability of a Citibank branch matters more for the intensive margin (more shares purchased by shareholders) than the extensive margin (the number of new shareholders).
The results that examine the effects of these regressors on within-county changes in shareholding from 1925 to 1929 tend to show smaller, and often insignificant, coefficients. There are several possible interpretations of those findings. First, it could be that stockholding adjusts slowly to changes in the environment. Second, it could be that the observable county characteristics used in the regressions partly proxy for unchanging unobservable characteristics. Under the latter interpretation, new branches are not as highly correlated with changes in the important unobservable characteristics. Third, it may be that there is structural change over time in the importance of some influences. For example, if familiarity with shareholding increases over time for some segment of the population, that could reduce the importance of other influences for explaining shareholding. In particular, this could explain the reduced coefficients on distance from New York, and on Citi branch, as well as some of the other coefficients. Finally, with respect to the Citi branch effect, the number of new branches established between 1925 and 1929 outside of New York is small (six), which also could explain the lack of significance of the estimate of the effect of within-county change in branch presence.
As a robustness check, we report Poisson regression findings in Table A5 to ensure that Table 4's results do not reflect bias from the inclusion of counties with zero stockholders. The results are similar.
Table 5 reports country-level tobit results that examine the effects of Citibank branches on the percentage of shareholders in the population of each country (Online Appendix Tables A6 and A7 report results for percentage of shares and number of shares). We find that both the existence of a Citibank branch, and the number of branches, are associated with substantially greater Citibank shareholding. As in the county-level regressions, the within-country coefficient estimate (examining the effect of change from 1925 to 1929 in branch locations) tends to be small and statistically insignificant. As before, there are four alternative explanations for that finding (including the fact that only three countries saw Citibank enter between 1925 and 1929).
Table 5. Country-level regressions (percentage of shareholders)

Note: *, **, *** indicate statistical significance at the 10%, 5% and 1% levels. Dependent variable is the percentage of shareholders in the country multiplied by 100. All regressors are defined in Table 3. CitiBranch is an indicator that is 1 if the country has a Citibank branch and 0 otherwise. For 1929–1925, the dependent variable and all independent variables are calculated as the difference between the values in 1929 and 1925. Marginal effects at the mean are reported in parentheses. For indicator variables, this captures the effect of a change from zero to one. For continuous variables, this captures the effect of a standard deviation increase calculated at the mean. Average percentage of shareholders is also multiplied by 100.
Thus, although the results in Tables 4 and 5 are suggestive of the importance of familiarity, they are not conclusive. In particular, they do not allow us to discern whether the small and insignificant coefficients related to the change in Citibank branches from 1925 to 1929 reflect adjustment lags, unobservable heterogeneity, changes in the importance of the influence over time, or a small sample of new branches. Our analysis of individual decisions in Section VI is helpful in providing less ambiguous evidence of the importance of familiarity.
VI
Business executives sample, variables and methods
Here we analyze the determinants of New York City business executives’ decisions to become Citibank shareholders. We analyze the decisions separately for each of our three sample years: 1925, 1927 and 1929. We report both logit and tobit results, where the logits predict whether an individual is a shareholder, and the tobits predict the number of shares owned. For the 1927 and 1929 analysis, we are also able to identify ‘new’ shareholders, defined as those that were not present in the prior sample of shareholders.Footnote 13
Citibank shareholding was relatively uncommon. In 1925, 1 percent of New York business executives in our sample were Citibank shareholders.Footnote 14 That percentage rose to 1.5 percent in 1927 and 1.9 percent in 1929. Our model includes a variety of individual characteristics and several variables that capture network attributes of businessmen, or network influences on share ownership. Among the individual characteristics we capture, we include measures of each individual's importance within the business network, which we capture with the individual's Number of Affiliated Firms, the individual's Eigenvector Network Centrality, the individual's Number of Network Connections, and the individual's Network Betweenness Centrality, all of which measure aspects of an individual's importance in the network (see, for example, Banerjee et al. Reference Banerjee, Chandrasekhar, Duflo and Jackson2013). We also include a High Position Indicator, which captures whether the individual serves as both an officer and a director at any particular firm. Finally, we include indicator variables for whether the individual is listed in Who's Who, or in the Poor's Register of Directors. Given that our direct measures of individual wealth are noisy (whether the individual is listed in the New York Times as a taxpayer in 1924, and if so, the amount of tax paid), we believe that these network measures capture a combination of the wealth, knowledge and sophistication of the individual, all of which should be positively associated with share ownership.Footnote 15
We expect that, ceteris paribus, individuals that work in the financial industry may be more likely to purchase Citibank shares, owing to their greater familiarity with banking. We include an indicator variable that captures this effect.
To measure network influences on share purchases, we identify linkages that are plausibly unidirectional. We do so in two ways. First, when analyzing all shareholders as of a given date, we assume that Citibank officers and directors are a source of influence on the share purchases of others in the network, but are not themselves influenced by others to buy Citibank shares.Footnote 16 For that reason, we drop Citibank officers and directors from the dependent variablesFootnote 17 in our regressions (because their stock ownership was not a choice in the same way as others’ decisions were), but we include them as influencers in the measures of network influence. Second, when analyzing new shareholders (those that have become shareholders in the past two years) we assume that, with respect to network influences coming from non-Citibank officers and directors, those influences are causal only if the presumed influencing shareholders had owned Citibank shares two years before, and still own them. We regard this as a conservative assumption.
We measure these two channels of network influence separately by constructing variables that capture either the network influence of current Citibank officers and directors, or the influence of prior (and still holding) shareholders who are not Citibank officers and directors.Footnote 18 We allow both of those measures to influence stock purchasing either through a direct network connection (where the subject and the influencing party share an affiliation as officers or directors of the same firm) or through a one-off connection (where they are each connected to a common person, but not connected directly to each other). In various robustness tests we considered additional indirect connections, but found no evidence of their importance.Footnote 19
Our measure of share ownership includes shares owned by a corporation in which the individual is an officer or director. We allocate those shares equally among officers and directors. In cases where we lacked a complete list of officers and directors, we divided by five when assigning shares to executives present in our sample. In Online Appendix Tables A10–A19, we report results where we exclude corporate-owned shares and confine the definition of shareholding to shares actually owned by individuals. Results are very similar.
If shares are owned by the spouse of a business executive present in our network, and if that spouse is not listed in the Directory, we assign those shares to the spouse listed in the Directory. Concerned that very large shareholdings might distort our analysis, we tried truncating the number of shares in the tobit regressions at the 95th percentile; tobit results using truncated measures of numbers of shares are similar to those reported here.
Some shareholders managed their voting through a financial institution. Citibank branches in New York were particularly common as addresses to which shareholder proxies were sent. From 1925 to 1929, the number of shareholders whose proxies were sent to Citibank branches in the New York area grew from 109 to 369, while the number of shares associated with those shareholders more than quadrupled. For the New York area as a whole, the rate of growth in the number of shareholders was similar, but the growth in the number of shares merely doubled. It is possible that contact with New York branches may have encouraged Citibank shareholding, but it is not possible to reliably measure differences among those living in New York City in their exposure to Citibank's presence.
Logit results for all shareholders in 1925, 1927 and 1929
Online Appendix Table A1 provides summary statistics for all the variables used in the regressions reported in subsequent tables. Logit results for all shareholders present in the proxy list for January 1925 are reported in Table 6. Variables that capture income, and whether the individual is employed in the financial sector – which provide a baseline parsimonious specification (excluding network influences) – are reported in column (4). Those variables are highly statistically and economically significant. If an executive works in the financial sector, that increases the probability of owning Citibank shares in 1925 by 1.95 percent. Thus financial executives are nearly three times as likely to own Citibank shares as other executives (the unconditional mean proportion of New York executives owning shares is 0.94 percent). After controlling for other influences, the marginal effect falls to 0.91 percent in column (8), which is still nearly equal to the unconditional mean. Being wealthy enough to be on the reported IRS list raises the probability by 1.21 percent in column (4) and by 0.80 percent in column (8). The amount of tax recorded is also highly significant, but the magnitude of the effect is small. If an individual pays a standard deviation more ($15,915) tax than the mean of $1,467, the marginal effect implies a 0.03 percentage point increase in the probability of being a shareholder in column (4), and third that effect in column (8).Footnote 20
Table 6. Logit for all 1925 shareholders

Note: *, **, *** indicate statistical significance at the 10%, 5% and 1% levels. Dependent variable is an indicator that equals one if the individual holds shares and zero otherwise. All regressors are defined in Table 3. The number of shares includes shares owned by firms rather than individuals. Corporate holdings are equally distributed among the officers and directors of the shareholding firm. A firm lacking information on the number of officers and directors is assumed to have five officers and directors. Sample includes all voting shareholders excluding Citibank officers and directors. Marginal effects at the mean are reported in parentheses. For indicator variables, this captures the effect of a change from zero to one. For continuous variables, this captures the effect of a standard deviation increase calculated at the mean.
One of the variables (the Poors Indicator) capturing individual status (reflecting income, wealth, sophistication, or knowledge) is robustly statistically and economically significant. The Poors Indicator marginal effect implies that being listed in Poor's raises the probability of being a shareholder by 0.28 percentage point in column (5), and by a bit less in columns (6)–(8). These effects are large relative to the unconditional mean of nearly 1 percent.Footnote 21 The No. of Network Connections is also an important predictor of share ownership in 1925; a standard deviation increase raises the probability of owning Citibank shares by 0.16 percent. Other individual characteristic variables are not economically and statistically significant.
Contact with Citibank officers and directors influences share purchase decisions by 1925, and those influences are economically and statistically significant.Footnote 22 Moreover, we find that indirect network influences are large and statistically significant, not only direct ones. Table 10 reports various approaches to gauging the importance of network influences, using the estimated coefficients from the final columns of regressions reported in Tables 6 and A8–9 and the estimated coefficients from each column in Table 9. For purposes of comparison, Table 10 also gauges the importance for increasing the probability of being a Citibank shareholder of being included in the IRS tax data.
The entry in the first column and first row of Table 10 calculates that, in 1925, replacing a direct network connection that is a non-Citibank officer/director with a Citibank officer/director raises the probability of being a Citibank shareholder by 0.51 percent, which is more than half of the unconditional mean of 0.94 percent. We gauge the importance of the effect of once-removed (indirect) network connections in two ways in Table 10. First, we consider replacing one indirect connection that is not a Citibank officer/director with one that is. This raises the probability of being a shareholder by 0.05 percent in 1925. Note, however, that the number of indirect connections is much larger than the number of direct connections. While the number of direct connections averages about 7.4, the number of indirect connections averages about 110.7. One way to compare the magnitudes of the direct and indirect effects is to consider replacing non-Citibank officer/director indirect connections with a 1/7.4 proportion of Citibank officer/director indirect connections. The third column of numbers in Table 10 reports that marginal effect, which is 0.4 percent (which is roughly comparable to the direct effect).
An individual's importance in the network is gauged by three variables: No. of Network Connections, Eigenvector Network Centrality and Network Betweenness Centrality. The first of these displays a robust positive and significant coefficient, while the latter two are negative and not significant statistically in the final column of Table 6.
The Pseudo-R2 and AIC statistics show that adding network influence effects (the first two variables in the table) improves the overall fit of the model, even after controlling for other influences (the Pseudo-R2 rises from 0.137 in column (6) to 0.142 in column (8)). The results for Appendix Tables A8 and A9, which report identical models to those for Table 6, but for the years 1927 and 1929, are broadly similar to Table 6, with some exceptions.Footnote 23
Interestingly, the Pseudo R2 of the models in column (8) of the tables declines from 1927 to 1929 (it is 0.142 in 1925 and 0.142 in 1927, and falls to 0.108 in 1929). The incremental effect of our network influences (the change in Pseudo R2 from column 6 to column 8) is similar across the three years. One interpretation of the decline in Pseudo R2 in 1929 is that a general broadening of shareholding is occurring during the market boom of the late 1920s. During the run-up in price, it may be that new influences on behavior that we do not observe (conversations with people outside the network, or media reports) become more important in explaining new shareholding over time. Our analysis of the influences on new shareholders, reported in Tables 7 and 8, is consistent with that interpretation.
Table 7. Logit for new 1927 shareholders

Note: *, **, *** indicate statistical significance at the 10%, 5% and 1% levels. Dependent variable is the number of shares an individual owns. All regressors are defined in Table 3. The number of shares includes shares owned by firms rather than individuals. Corporate holdings are equally distributed among the officers and directors of the shareholding firm. A firm lacking information on the number of officers and directors is assumed to have five officers and directors. Sample includes new voting shareholders excluding Citibank officers and directors. Marginal effects at the mean are reported in parentheses. For indicator variables, this captures the effect of a change from zero to one. For continuous variables, this captures the effect of a standard deviation increase calculated at the mean.
Table 8. Logit for new 1929 shareholders

Note: *, **, *** indicate statistical significance at the 10%, 5% and 1% levels. Dependent variable is an indicator that equals one if the individual holds shares and zero otherwise. All regressors are defined in Table 3. The number of shares includes shares owned by firms rather than individuals. Corporate holdings are equally distributed among the officers and directors of the shareholding firm. A firm lacking information on the number of officers and directors is assumed to have five officers and directors. Sample includes new voting shareholders excluding Citibank officers and directors. Marginal effects at the mean are reported in parentheses. For indicator variables, this captures the effect of a change from zero to one. For continuous variables, this captures the effect of a standard deviation increase calculated at the mean.
Logit results for new shareholders in 1927 and 1929
Tables 7 and 8 report logit regressions analyzing entry by new shareholders – those who enter between January 1925 and January 1927, or between January 27 and January 1929. Because we observe prior periods (1925 when analyzing 1927, and 1927 when analyzing 1929) we can include network influences coming from %Shareholder Connections and the %Once-Removed Shareholder Connections, in addition to the network influences coming from proximity to Citibank officers and directors. The significance of those influences suggests that factors other than the transmission of insider information – that is, imitation of other outsiders’ behavior, rather than just learning privileged information from insiders – were relevant in explaining network influence.
Coefficient magnitudes and significance for new shareholders in 1927, reported in Table 7, are similar to those in Table A8 (for all shareholders in 1927). Additionally, we find that %Shareholder Connections enters positively and significantly in the specifications. The indirect effect, measured by %Once-Removed Shareholder Connections, is not as robustly significant (it is significant at only the 10% level in 1927 in column (11) of Table 7).
The importance of %Shareholder Connections is measured in Table 10. For the 1925–7 period, replacing a non-Citibank shareholder as a direct connection with a Citibank shareholder raises the probability of becoming a Citibank shareholder between 1925 and 1927 by 0.15 percent, which is a quarter of the mean probability of becoming a Citibank shareholder during that period (0.59 percent). This is comparable in magnitude to the effect of replacing a non-Citibank shareholder with a Citibank officer/director (which raises the probability of becoming a shareholder by 0.25 percent in the period 1925–7, as shown in the first column and second row of numbers in Table 10).Footnote 24
Not only is the Pseudo-R2 of the 1929 model for new shareholders lower than for new shareholders in 1927, the explanatory power of the once-removed network influences of officers and directors, and of shareholders, is diminished relative to prior years, although other network marginal effects remain similar for 1925–7 and 1927–9. The incremental improvement in Pseudo-R2 (the increase from column 6 to column 11 of Table 8) is only 0.002, in comparison to the much greater 0.021 difference visible in Table 7. In other words, the models, and network influences in particular, do not tell us as much about becoming a new shareholder in 1929 as they did in 1927. This is consistent with the view that other influences that may be more relevant during a price bubble (conversations with people outside the network, or media reports) became relatively important after 1927.
Tobit results
In Online Appendix Tables A31–A35 we report tobit regressions comparable to the logits. In Table 9, we summarize the tobits by reporting the final columns from Online Appendix Tables A31–A35. Tobit specifications allow for differences in the number of shares held when making comparisons across individuals. Our tobit findings for individual characteristic variables are similar to our logit findings, but the High Position Indicator is more significant in the tobits.Footnote 25
Table 9. Summary of tobit regressions

Note: *, **, *** indicate statistical significance at the 10%, 5% and 1% levels. Dependent variable is the number of shares an individual owns. All regressors are defined in Table 3. The number of shares includes shares owned by firms rather than individuals. Corporate holdings are equally distributed among the officers and directors of the shareholding firm. A firm lacking information on the number of officers and directors is assumed to have five officers and directors. Marginal effects at the mean are reported in parentheses. Columns (1)–(3) show the tobit regressions for all voting shareholders excluding Citibank officers and directors in 1925, 1927 and 1929. Columns (4)–(5) show the tobit regressions for new voting shareholders excluding Citibank officers and directors in 1927 and 1929. For indicator variables, this captures the effect of a change from zero to one. For continuous variables, this captures the effect of a standard deviation increase calculated at the mean.
In the tobit regressions, Eigenvector Network Centrality becomes much larger and more statistically significant for the 1927–9 period than for the 1925–7 period, and the difference is highly statistically significant (unlike in the logits). One way to interpret this is that highly influential people were much less likely to become new shareholders after 1927. When one considers that the presidents of the largest New York banks, including Citibank, were openly discussing what they regarded as unsustainably high valuations of their banks’ stock prices by the middle of 1927, and that they agreed to delist their stocks from the New York Stock Exchange in January 1928 to try to remedy that situation, this is not surprising. This is reminiscent of the pattern described by Temin and Voth (Reference Temin and Voth2004) regarding the actions of Hoare's Bank during the South Sea Bubble. Hoare's Bank (a very informed market participant) sold its positions and profited from getting out before the bubble burst.
The patterns of marginal effects for network influences in the tobit regressions (reported in the bottom half of Table 10) are roughly comparable to those in the logits, although their scaling is different (as these measure numbers of shares rather than probability of being a shareholder).
Table 10. Importance of Citibank network connections

Note: Marginal effects are derived from the coefficients reported in the last columns of Tables 6–10, and in all columns of Table 11. *, **, *** indicate statistical significance at the 10%, 5% and 1% levels. For logits, (1) measures the increase in the probability of being a Citibank shareholder in 1925, or becoming one either during 1925–7 or 1927–9, if one of your direct network connections (those serving as an officer or director in the same firm that you also serve in) changes from being a non-Citibank officer or director to being a Citibank officer or director. (2) is the same as (1) but uses a once-removed board connection. (3) is the same as (2) but uses (110.66/7.41) of the once-removed board connections. (4)–(6) are analogous to (1)–(3), but replace the officer/director with a Citibank shareholder who has held shares for at least two years and is not an officer or director of Citibank. (7) calculates the increase in probability of being a Citibank shareholder from being listed on the IRS taxpayer list. (8) reports unconditional means of the percentage of voting shareholders and numbers of shares. For tobits, marginal effects are expressed in increased numbers of shares.
We find that, as in the logit analyses of new shareholders, the statistical significance and the size of the marginal effects of the once-removed network influences of officers and directors are much smaller for the 1927–9 period than for the 1925–7 period, however the same is not true for once-removed shareholder effects. Unlike the logits, the marginal effect of once-removed shareholder influences remains similar to the earlier period. As in the logits, the incremental importance of adding network influence for Pseudo R2 declines in the 1927–9 period (as shown in Online Appendix Tables A34 and A35).Footnote 26 We think these findings corroborate the view that during the price bubble other influences on executives (conversations with people outside the network, or media reports) became increasingly influential on the behavior of buyers, in general.Footnote 27
Exits
There are too few exits in our sample for us to analyze exits reliably using regression analysis. Even using our broad definition of stockholders, which includes corporate holdings, the number of stockholders in our sample in January 1925 who exited by January 1927 was 29 out of 402, and the comparable number for exits from 1927 to 1929 was 164 out of 626. For the latter period we experimented with running logits and tobits similar in structure to those reported in Tables 7 and 10. Given the small sample, we found no significant effects for most variables, but we did find that %of Officer/Director Connections is robustly negatively and significantly associated with the propensity to exit, which is consistent with the opposite effect of that same variable in predicting new shareholding. Interestingly, the IRS Tax Indicator is a negative predictor of exits (similar to its opposite effect for predicting purchases), but the IRS Tax Indicator * Tax Payment is a positive predictor. The latter effect indicates that very wealthy people were among those exiting between January 1927 and January 1929.
Placebo test of Citibank officer and director network influences
Our findings regarding the network influence of Citibank officers and directors are subject to an alternative interpretation. It could be that network contact with any prominent New York banker, not just with a Citibank officer and director, encourages someone to purchase New York banks’ stock, including that of Citibank. If that were true, then it would imply a somewhat different conception of the effect of network connections on fostering familiarity, one that sees familiarity as a sectoral attribute, rather than firm-specific.Footnote 28
To investigate this alternative view, we perform a placebo test. We include a variable indicating that a person is an officer or director of another large New York bank, as of 1929, and test whether contact with this type of individual, as distinct from Citibank officers and directors, influences people to purchase Citibank stock. (Because we are unable to identify holders of other New York banks’ stock, we are unable to include a similar variable to test for their network influence on the purchase of Citibank shares.) We summarize these findings for the logit regressions in Table 11 and report the full results in Online Appendix Tables A47–56.Footnote 29
Table 11. Summary of logit regressions (controlling for large bank connections)

Note: *, **, *** indicate statistical significance at the 10%, 5% and 1% levels. Dependent variable is the number of shares an individual owns. All regressors are defined in Table 3. The number of shares includes shares owned by firms rather than individuals. Corporate holdings are equally distributed among the officers and directors of the shareholding firm. A firm lacking information on the number of officers and directors is assumed to have five officers and directors. Marginal effects at the mean are reported in parentheses. Columns (1)–(3) show the logit regressions for all voting shareholders excluding Citibank officers and directors in 1925, 1927 and 1929. Columns (4)–(5) show the logit regressions for new voting shareholders excluding Citibank officers and directors in 1927 and 1929. For indicator variables, this captures the effect of a change from zero to one. For continuous variables, this captures the effect of a standard deviation increase calculated at the mean.
We find that the coefficients on all the network influence variables related to Citibank officers and directors, or Citibank shareholders, are unchanged. This is true of the logit and tobit regressions in all the sample years. Interestingly, the % of Large Bank Connections variables do enter significantly in most specifications. The % of Once-Removed Large Bank Connections variable enters positively in columns (1)–(4) of Table 11, which supports the hypothesis of a general sectoral familiarity effect. However, the direct effect, measured by the % of Large Bank Connections variable, enters negatively and significantly in columns (1)–(4) of Table 11. Both direct and indirect (once-removed) Large Bank Connections become insignificant in column (5), which captures the effects for new shareholders in the 1927–9 period. Replacing a direct (indirect) network connection that is a non-Citibank officer/director with a Citibank officer/director raises by the probability of being a Citibank shareholder by 0.49 (0.34) percent in 1925, roughly equal in magnitude to the entry in the first column and first row (entry in the third column and first row) of Table 10. Replacing a direct (indirect) network connection to an individual who is not an officer/director of a large New York bank other than Citibank with another large New York bank's officer/director reduces (raises) the probability of becoming a Citibank shareholder by a smaller magnitude of −0.2 (0.27) percent. We interpret these findings as indicating that direct connections to a non-Citibank New York bank officer or director made someone less likely to buy Citibank stock because it made them more likely to be interested in Citibank's competitors. However, the fact that the sign is positive for once-removed influences suggests that once-removed influences, including perhaps those related to Citibank officers and directors’ influence, may reflect a sectoral familiarity effect. The insignificance of both effects for explaining new shareholders in the 1927–9 is consistent with other results that point to the declining explanatory value of our model, and of network influences in particular, for explaining who became a stockholder during that period.
VII
Citibank's list of shareholders grew rapidly in the 1920s, which reflected its active issuance of new shares, and the fact that a large proportion of existing Citibank shareholders elected not to take full advantage of their option to purchase new offerings, which were offered to existing shareholders on a pro-rata basis.
Citibank shares sold at a high price per share throughout the 1920s, and this limited prospective stockholders mainly to relatively wealthy individuals and corporations. Home bias and familiarity bias also limited share purchases, as indicated by an analysis of differences across counties in their aggregate shareholdings, including distance from New York City, and various demographic characteristics.
We believe ours is the first analysis of individual stockholding choice that combines a list of candidate stockholders (New York City business executives), a list of a company's stockholders, and data about the attributes of the business executives. We analyze the effects of Citibank branch presence on stockholding outside of New York, and find that both within and outside the US shareholding was positively associated with Citibank presence, and negatively associated with distance and various demographic influences.
Within New York City, the probability of being a Citibank shareholder was roughly 1 percent (for members of the local business community) in January 1925 and 2 percent in January 1929.
We find that financial sector executives were much more likely to become Citibank shareholders than others. Proxies for income, wealth, and influence are also associated with significantly probabilities of buying Citibank shares. However, that pattern reverses somewhat during the price boom in Citibank shares, as the most influential executives (measured by their position in the local business network) became less likely to become shareholders. Furthermore, after January 1927, individual characteristics became weaker predictors of shareholder status, indicating that other influences not captured by our model became relatively more important in explaining the rising number of shareholders.
Members of the business network were influenced to become shareholders by others with whom they had contact. Sharing a corporate affiliation with a Citibank officer or director increased the probability of becoming a Citibank shareholder, as did sharing an indirect, once-removed affiliate connection. Sharing a corporate affiliation with a prior (and still holding) Citibank shareholder also increased the probability of becoming a shareholder in 1927 and 1929. That evidence shows that network influence was not merely the result of the transmission of inside information, but also reflected other kinds of learning and imitation of outside investors with whom executives had contact.
By 1929, we find that network influences on new shareholding had lessened. By 1929, only direct connections with Citibank officers and directors or prior shareholders continued to matter robustly for explaining new shareholding.
New York bankers that were officers and directors of competing banks also influenced people in the network. Direct connections to these people reduced the propensity to buy Citibank stock, while once-removed connections to them tended to increase it. This evidence suggests that familiarity with competing institutions’ stocks may have reduced the probability of buying Citibank shares, and that once-removed information may influence familiarity more at the sectoral than firm-specific level.
Our findings have several implications for the literature on familiarity bias. Our national and international findings are suggestive of the effects of the physical presence of a firm on local willingness to buy its shares. We also confirm in our county-level regressions that physical distance is a barrier to familiarity.
In our individual-level regressions, we find that knowledge of a specific industry (finance, in our case) is also an important contributor to familiarity.
Finally, the evidence about changes in the importance of network influences over time indicates that familiarity barriers are not constant. During the stock price boom of the late 1920s, the increasing public visibility of Citibank shares seems to have made investors increasingly familiar with Citibank stock, lessening the role of network connections to overcome barriers from unfamiliarity.
Supplementary material
To view supplementary material for this article, please visit https://doi.org/10.1017/S0968565024000155


 Open access