INTRODUCTION
Varicella vaccination programmes have been implemented in several countries during the last decade [Reference Nguyen, Jumaan and Seward1–Reference Seward4]. Evaluations of the varicella vaccination programme in the USA have demonstrated an impressive effect with respect to varicella-related mortality [Reference Nguyen, Jumaan and Seward1], hospitalization [Reference Reynolds2, Reference Davis, Patel and Gebremariam3] and incidence [Reference Seward4], despite limited vaccine efficacy of one dose [Reference Seward, Marin and Vazquez5] and even two doses of varicella vaccine [Reference Kuter6, Reference Gould7]. However, the epidemiological characteristics for the spread of varicella in unvaccinated populations vary considerably [Reference Nardone8] making assessment of the effects of vaccination programmes on a national level mandatory.
Since varicella is very common in early childhood [Reference Heininger and Seward9] assessment of the incidence of temporal trends of varicella incidence at a national level is not feasible. Therefore trends are either monitored regarding incidence in regional samples [Reference Nguyen, Jumaan and Seward1, Reference Nardone8] or in sentinel surveys [Reference Siedler and Arndt10]. While trends in case ascertainment can be depicted by these approaches, quantifying vaccine effects and age-group interdependencies may require a more sophisticated approach. We therefore attempted to model the time-course of varicella following the introduction of a universal childhood vaccination programme in Germany in 2004 [Reference Siedler and Arndt10] targeted at children aged 1–2 years and sought to apply these analyses to an ecological approach in order to assess varicella vaccine effectiveness.
Measuring the success of an immunization programme under field conditions is a particular challenge which can be addressed by epidemiological means. The study of vaccine effectiveness typically investigates direct effects in individuals using different vaccination models and study designs [Reference Halloran, Longini and Struchiner11]. However, the literature on quantifying population effects of vaccination is less developed and typically occurs within the framework of a detailed dynamic model for disease transmission (see e.g. [Reference Halloran12, Reference Brisson13] for such an approach in the context of varicella vaccination). However, for data originating from routine monitoring such models are too detailed. The screening method [Reference Farrington14] is one approach operating under such monitoring conditions, but it requires knowledge about both the vaccination status of cases and the proportion of population vaccinated, which are not always available. Furthermore, the approach does not specifically address the time-varying aspect of coverage following the introduction of a vaccination programme. Our selected ecological approach provides a solution for estimating population-level effects of vaccination under field conditions by using a coarse disease transmission model based on time-series methodology which indirectly takes herd immunity effects into account. Classical time-series modelling has already received some attention in analysing vaccine effects in populations [Reference Anderson, Grenfell and May15–Reference Mullooly19]. However, previous analyses are typically restricted to univariate analyses with information on vaccination coverage entered only in binary form. Our approach continues along these lines and is novel in as much as it considers coverage percentage as an exogenous time series and, being a multivariate time-series model, handles progression in different age strata.
Given the above, our research question can be formulated as follows: does modelling the time-course of varicella following the introduction of the varicella vaccination programme in Germany allow for quantification of age-specific effects and for an ecological assessment of vaccine effectiveness? Specifically, we wanted to quantify direct vaccine effects in the vaccinated 1–2 years age group by using seasonal and autoregressive terms in the model as proxy for adjusting for indirect vaccine effects in all regarded age groups.
METHODS
Data sources
A convenience sample of 1176 primary-care physicians, consisting of 57% paediatricians and 43% general practitioners (GPs) which accounted for about 15% of all German paediatricians and about 1% of all German GPs in private practice was the sampling frame for the sentinel network. Sentinel network physicians of both groups are distributed in German federal states in the same proportion as the total number of respective physicians in private practice. Physicians reported aggregated monthly numbers of varicella cases by age group. Clear case definitions for reporting were provided. A case of varicella is defined as a person presenting with a clinical picture compatible with varicella, i.e. the presence of skin exanthema and concomitant presentation of papules, blisters, pustules, crusts [Reference Siedler and Arndt10]. Zero-reporting and active reminders were included, but as physicians participated voluntarily without any incentives for their reports, the additional workload for them needed be kept as low as possible. Hence, vaccination status of cases was not recorded and only aggregated case numbers by age groups were reported. Furthermore, as patients are free to choose and change their physician and only a sample of physicians report to the sentinel network, the population size under surveillance can not be defined [Reference Siedler and Arndt10].
Vaccine uptake was extrapolated from health insurance data in one [Schleswig-Holstein (SH)] of the 16 German federal states. Vaccination billing for about 90% of all children in Germany is handled by the Association of Statutory Health Insurance Physicians (‘Kassenärztliche Vereinigungen’) in the different German federal states [Reference Kalies20]. Children in the health insurance system were traced from birth to age 24 months upon billing for the well-baby check visits. Varicella vaccination status by age 24 months was assessed for consecutive birth cohorts from 2003 to 2006 and this constituted the numerator for assessing vaccination coverage for the different birth cohorts.
Analyses
Data from all paediatricians and GPs participating in the sentinel network were used in the analysis. As response for the time-series modelling we chose the monthly ‘mean number of varicella cases per reporting unit’. This quantity accounts for the varying number of reporting units in the sentinel network, whereas the size of the reporting units is considered to be stable over time. The dynamics of the response variable over time is described by a two-phase model: at the first level the mean number of varicella cases at time t (measured in months) per sentinel reporting unit was modelled. This was done using a linear predictor with intercept, linear trend, seasonal terms and an additional ARMA(p,q) model with p autoregressive (AR) and q moving-average (MA) terms. At the second level the age distribution of the observed cases at time t in the <1, 1–2, 3–4, 5–9 and >9 years age groups was handled by a multinomial logistic regression model (for further details on the modelling see the Appendix). For levels 1 and 2, Akaike's Information Criterion (AIC) was used to select from a set of candidate models. A strong correlation between vaccination coverage and time (measured in months) was expected. Including both month and vaccination coverage as covariables would thus lead to strong collinearity and hence lead to stability problems if they are both included. Therefore, the following strategy was applied: fit separate models including either month or coverage as covariate and use AIC to select the better model.
We used R [21] – a free software environment for statistical computing and graphics – to perform all statistical computations.
In order to estimate vaccination coverage nationally, coverage estimates for SH were extrapolated to the whole of Germany as follows. For each of the 16 federal states the SH time-series was shifted in time such that the time of reimbursement in SH (August 2005) was moved to the corresponding month of reimbursement in the federal state. The resulting 16 time series were then averaged by weighting with the number of sentinel network units for the respective federal state in that month.
Vaccine effectiveness is conventionally defined as the reduction between the risk of unvaccinated and vaccinated individuals divided by the risk of unvaccinated individuals [Reference Halloran, Longini and Struchiner22], i.e. 1 minus the relative risk. In our model we use a before-and-after approach to estimate vaccine effectiveness under field conditions. We consider 0% coverage as baseline – representing the unvaccinated situation – and compare this with 100% coverage, corresponding to the vaccinated situation. Using this approach, vaccine effectiveness can be estimated in the unstratified situation as 1 minus the relative reduction in the expectation of the response, i.e. 1 – μ100% coverage/μ0% coverage=1 – exp(β1)100, where β1 represents the effect of coverage in the level 1 model described in the Appendix. Since coverage is only available for the 1–2 years age group, we obtained an estimate of vaccine effectiveness for this specific age group by computing the relative reduction in expectation for this age group, i.e. 1 – μ100% coverage,1–2 yr/μ0% coverage,1–2 yr (see Appendix for details on how these expectations are obtained by a combination of level 1 and level 2 models).
RESULTS
Figure 1 shows the monthly vaccination coverage among the 24-month-old birth cohort in SH. Here, reimbursement started in August 2005. Also shown in Figure 1 is our extrapolated national coverage time-series; the extrapolated coverage percentage at the beginning of the sentinel network in April 2005 was 11%. The corresponding coverages were 38%, 63%, 78%, respectively, at 1, 2 and 3 years after the sentinel network started. A rough comparison (not shown) with differently collected yearly coverage rates for the 24-month-olds from the 2004 and 2005 birth cohorts in an available subset of ten federal states showed that our extrapolation provided a fair description of the coverage of these two cohorts.
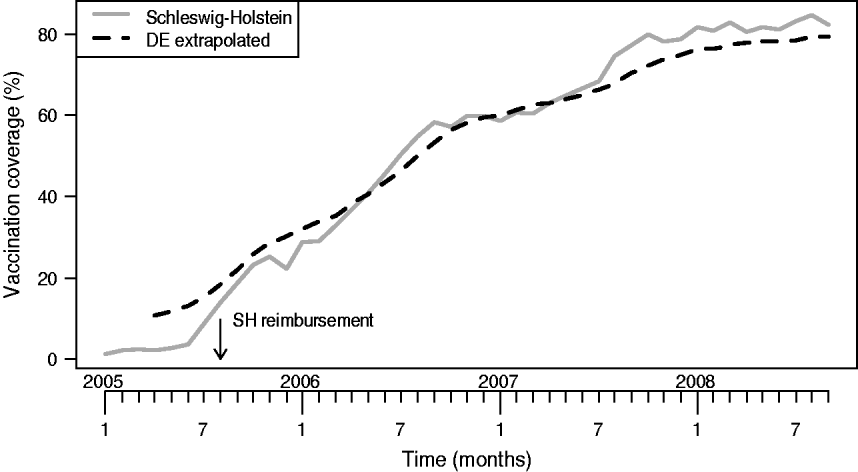
Fig. 1. Vaccination coverage in the 24-month-old birth cohort in Schleswig-Holstein (SH) and the extrapolated coverage for Germany.
The mean number of monthly reporting units in the sentinel network for the available 42 months of monitoring was 679 (s.d.=41). Figure 2 shows the observed monthly time series of mean number of cases per reporting unit together with the fit of our level 1 model containing intercept, trend and periodic function, f(t), consisting of two harmonics with frequencies of 12 and 6 months, respectively. An ARMA(2,1) model captured the remaining autocorrelation of the error terms. This level 1 model was determined as the best-fitting model according to AIC in the investigated set of candidate models. The estimated coefficient for the time trend in this model is −0·023 (95% CI −0·025 to −0·020), i.e. the reduction in the mean number of cases per reporting unit is significant (P<0·001) and corresponds to a decrease in the mean number of cases per reporting unit by a factor of exp(−0·023)=0·978 per month or exp(−0·023×12)=0·762 per year.
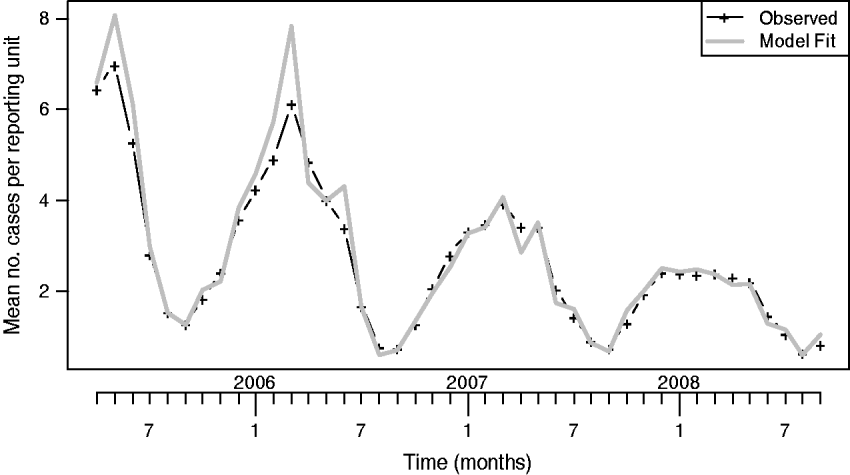
Fig. 2. Observed and model-fitted mean number of varicella cases per reporting unit in the sentinel network.
Figure 3 shows the model-fitted values combining level 1 and level 2 models (using month as linear covariate). Also shown are the estimated time trends, μt,i, for each of the five age groups (<1, 1–2, 3–4, 5–9, >9 years) as described in the Appendix.
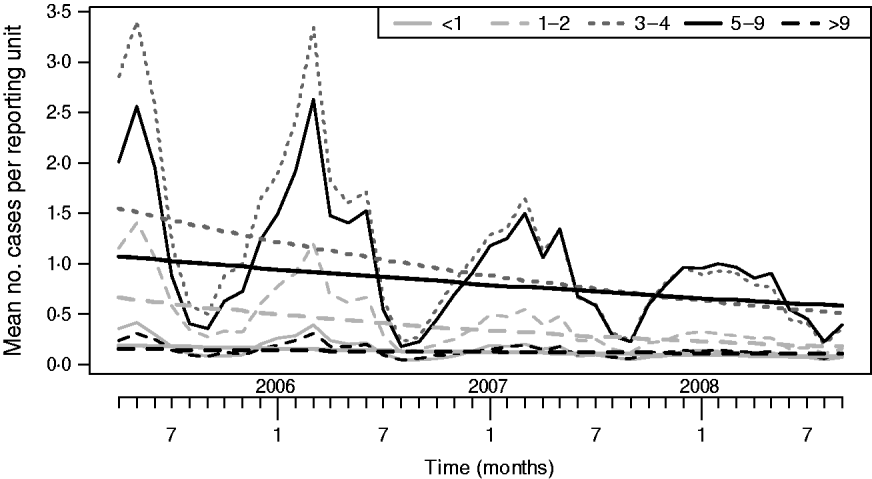
Fig. 3. Two-level model-fitted mean number of cases for each of the five age groups. Also shown are the trends μt,i (smooth lines) for each age group i and time-point t obtained by combining the intercept and trend components of the level 1 and level 2 models.
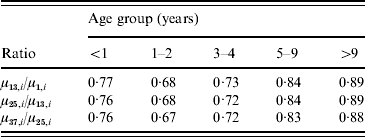
A decline in all five age groups was observed. For better interpretation, Table 1 shows the model-predicted yearly relative reductions for the first three full years of the sentinel network. As expected, the highest decline is observed in the 1–2 years age group, but all other age groups also experienced a decline. For example, the percentage reduction over 3 years in the <1 year age group is given by 1−0·77×0·76×0·76=56%. The corresponding reductions in the other groups were 69%, 62%, 42% and 30%. Since no vaccinations were performed in the <1 year age group, the reduction here may be entirely due to herd effect.
Table 1. Model-predicted relative reduction factors for each of the five age groups
However, the extrapolated national vaccination coverage percentage shown in Figure 1 has a Pearson correlation coefficient with month of 0·97. Using either month or coverage percentage in the model shows that the model with the covariate coverage provides the better fit (AIC of −44·66 vs. −39·73). When replacing the term β1t with β1(coverage in %) in the level 1 model, the estimated coefficient of coverage is −0·013 (95% CI −0·014 to −0·011), which means that the coverage effect is significant (P<0·001) and for each percentage point of vaccination coverage in the 24-month-old cohort the mean number of cases per reporting unit is reduced by a factor of 0·987. While this approach describes the overall impact of the vaccination programme, the assessment of vaccine effectiveness requires confining the analysis to vaccinated age groups only.
To specifically target the reduction in the 1–2 years age group, for whom the vaccine uptake could be estimated and who experience the direct vaccine effects, we combined the above findings with the level 2 model where the linear time trend is also replaced with coverage, i.e. coverage is used as single linear covariate in both level 1 and level 2 models, but the harmonic functions at both levels remain functions of time. This allows us to predict the reduction factor such as μ100%,1–2 yr/μ0%,1–2 yr for the 1–2 years age group, i.e. the reduction of a hypothetical 100% vaccination coverage in the 24-month-old birth cohort compared to a coverage baseline of 0%. This comparison mimics the conventional vaccine effectiveness assessment comparing attack rates in vaccinated and unvaccinated individuals. Table 2 gives the results for coverage percentages between 60% and 100%. This yields a vaccine effectiveness of 83·2% (95% CI 80·2–85·7) in the 1–2 years age group.
Table 2. Model-predicted reduction factors for five hypothetical coverage percentages
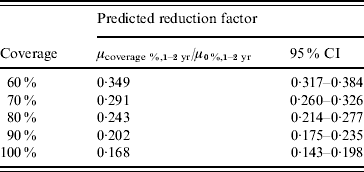
CI, Confidence interval.
DISCUSSION
Since the implementation of most vaccination programmes is progressive with gradual increments of vaccination coverage, the decrease of the targeted diseases due to direct and indirect vaccine effects will also be progressive. During the implementation of a universal varicella childhood vaccination programme in Germany we demonstrated that modelling of the time-course of disease allows estimation of the reduction for different age groups for comparison of direct and indirect vaccination effects. With further inclusion of vaccine uptake, an ecological estimate for vaccine effectiveness was possible and yielded almost identical results to other varicella vaccine effectiveness estimates.
Although year-to-year variation in the incidence of varicella (measured by GP visits or hospitalizations) has been reported from various countries and settings, the predicted and observed decline of varicella cases in the German sentinel network system, mainly in the 1–2 years age group, is consistent with an effect of vaccination rather than a secular trend. Given the short time-span of the monitoring period it appears unlikely that the reduction is attributable to secular changes in factors other than vaccine use [Reference Mullooly19]. Other epidemiological investigations and modelling approaches [Reference Bramley and Jones23–Reference Garnett and Grenfell26] also indicate a lack of large multi-year periodicities. However, our approach remains sensitive to unexplained trends in incidence, whereas ordinary year-to-year fluctuations are taken into account by the stochastic nature of the model.
Early detection of a herd immunity effect in children aged <1 year and the finding of similar vaccine effectiveness estimates for the ecological compared to other approaches are important findings with respect to varicella vaccination programmes.
Impressive herd immunity effects of varicella vaccination programmes have previously been shown in adults, e.g. a reduction of 74% over a 10-year period with increasing childhood vaccination coverage in the USA [Reference Marin, Meissner and Seward27]. Even more impressive reductions than in adults or adolescents have been reported in infants too young to be immunized themselves [Reference Nguyen, Jumaan and Seward1, Reference Anderson, Grenfell and May15, Reference Grijalva16]. These impressive indirect effects were achieved over a 6-year period with >90% coverage since programme implementation [Reference Quian28] and over 10 years with vaccination coverage >80% achieved after the fifth year [Reference Guris29]. Our results show, that even with coverage <80% first effects of indirect protection might occur.
Scientifically more relevant, however, might be the suggested ecological approach to estimate vaccine effectiveness based on time-series methodology. Using vaccine uptake in the model instead of time to estimate the reduction of reported varicella cases per increment in vaccine uptake appears justified because the model fit for vaccine uptake was considerably better than the fit for year of observation. A hypothetical vaccine uptake of 100% would reflect the effectiveness of the vaccine in vaccinated individuals. Vaccination status at age 24 months was used as an estimate for the 1–2 years age group, which covers children aged 12–35 months. We expected that choosing coverage at the midpoint of the age group balances between lower and higher coverage rates in children aged 12–23 and 24–35 months. The reduction of the reported varicella cases for each 1% increment in vaccination coverage was used to estimate vaccine effectiveness from an ecological approach. As the time-series model contains autoregressive terms, herd immunity effects are indirectly addressed in the modelling. A decrease in the mean number of cases (and hence the infection pressure) during previous months implies a smaller contribution from the past for the current response.
Estimates of varicella vaccine effectiveness vary depending on the setting of the assessment [Reference Bayer30], severity of the infection [Reference Seward, Marin and Vazquez5], number of vaccine doses [Reference Kuter6] and duration of follow-up [Reference Chaves31]. Most of these were based on outbreak investigations [Reference Bayer30, Reference Spackova32], a cohort study [Reference Clements33] a household contact study [Reference Seward34] or a case-control study [Reference Vazquez35]. The median effectiveness has been estimated at 72% and 71% [Reference Bayer30, Reference Spackova32] for all and 96·5% or 89% [Reference Seward, Marin and Vazquez5, Reference Bayer30], respectively, for moderate to severe infections from outbreak investigations. The respective figures were 83% and 100% in a prospective cohort study [Reference Clements33], 85% and 97% in a case-control study confined to laboratory-confirmed cases [Reference Vazquez35] and 79% and 92% in a household contact study for moderate cases [Reference Seward34]. The German varicella childhood vaccination programme was initiated with one-dose varicella vaccination and only recently switched to a two-dose schedule in 2009. The observed vaccine effectiveness of 83·2% in our ecological approach is close to the estimates from outbreaks in the USA which similarly included all levels of severity of varicella.
Vaccination uptake was only assessed in one German federal state; however, vaccination coverage measured for children at school entry is similar in SH to that in Germany on average [36]. The challenge in estimating vaccination coverage from health insurance data, which provide complete information on all vaccines given, is the generation of an appropriate denominator [Reference Kalies20]. The approach to include children with follow-up information up to age 24 months allows defining of a valid denominator. Almost 90% of children have completed all well-baby check-up visits scheduled within the first 2 years of life. If children without complete well-baby check-up visits were less completely vaccinated, this would account for an overestimation of the vaccination coverage by a maximum of 10%. However, formal assessment of this figure in SH, found an overestimation of only 1% [Reference Bader and Ludwig37]. As a sensitivity analysis incorporating uncertainty from well-baby check-ups and the extrapolation to other federal states we investigated the following: if using 90% of the coverage rate observed in Figure 1 as covariate, the resulting estimate for vaccine effectiveness would be 86·3%. As a consequence, our reported figure of 83·2% is conservative with respect to potential overestimation of coverage.
Our time-series modelling makes up an easy to implement alternative to assessing vaccine effectiveness. The similarity of our ecological estimate of varicella vaccine efficacy compared to other approaches can be explained by absence of secular trends and consistent reporting. Lack of large multi-year periodicities is suggested from other epidemiological investigations and modelling approaches [Reference Guris29, Reference Guris34–36]. Furthermore, there was no specific varicella catch-up vaccination programme in Germany. Even though vaccinations have occurred in the 3–4, 5–9 and >9 years age groups due to delay between recommended and actual vaccination age [Reference Kalies20], the effects can be considered as minor. Finally, ascertainment of cases and vaccination coverage was consistent over time due to the structure of the reporting instruments.
A limitation of the current modelling is that coverage percentage enters the predictor of the log-linear model in linear form. Predictions about the effect of hypothetical 100% coverage are sensitive to this assumed parametric form. An alternative could be to use more flexible functional forms based on semi-parametric penalized spline approaches [Reference Fahrmeir and Tutz38], but in our case such modelling did not indicate strong deviations from the linear form. Furthermore, the multinomial phase 2 model implies a fixed variance-covariance structure of the count data series, which – similar to binomial time series – might be subject to overdispersion [Reference Mebane and Sekhon39]. An alternative modelling approach based on a multivariate AR(1) Poisson model with population offsets can be found in Herzog et al. [Reference Herzog, Paul and Held40]. However, their model does not specifically address the sentinel network situation found in our context and is less flexible with respect to the autoregressive modelling.
It should be noted that standard epidemic models suggest that the number of new cases is proportional to the product of the proportions being infectious and susceptible. Thus, our use of infection pressure in the autoregression represents a pragmatic approximation when no information about the susceptible proportion is available. Theoretically, changes in the susceptible proportions due to vaccination could be reflected by a time-varying autoregression parameter. Furthermore, as herd effects are reflected in the unstratified level 1 model, we implicitly assume that these effects are homogeneous over all age groups.
Finally, given the short period of the German vaccination programme, our analyses of vaccine effectiveness do not take into account that immunity from vaccination might wane over time which would confound our effectiveness estimate. Re-assessment of waning immunity might become necessary, once the programme has been in operation for a longer time.
Altogether, our vaccine effectiveness estimates correspond to immediate effects and thus do not reflect long-term impact. It is well known that vaccination effects can be exaggerated during the initial period of a vaccination programme, e.g. due to ‘honeymoon effects’ [Reference McLean and Anderson41] or boosting from natural varicella cases which is expected to decline in the future [Reference Goldman42]. Hence our estimates may not be directly comparable with effectiveness based on individual-level data since they are subject to transient herd effects. However, the proposed two-phase multivariate time-series modelling represents a novel view on investigating population-level vaccine effectiveness for an age-stratified population indirectly taking current herd effects into account. With this model, the dynamics using a monthly time resolution were investigated and quantified. Such modelling is especially helpful in case of short time-series when starting monitoring immunization programmes without available pre-vaccination data.
ACKNOWLEDGEMENTS
We thank the participating sentinel physicians for their data reporting and the German Green Cross for collecting the data in the varicella sentinel. The work of the first author was financially supported by the LMUinnovativ project ‘Munich Center of Health Sciences’.
APPENDIX
Statistical methodology
Allow n t to be the number of sentinel network reporting units at time t; c t the total number of reported varicella cases at this time and (c t,<1, c t,1–2, c t,3–4, c t,5–9, c t,>9)T a column vector of length 5 containing the number of cases in each of the five age groups. The elements of this vector sum to c t. At the first level, our interest is in modelling the response y t=c t/n t, i.e. a random variable reflecting the mean number of cases per reporting unit at time t. To reflect the fact that the response is non-negative, we transform the response using the natural logarithm and hence model log(y t). Now, a time-series model is used to model trend and seasonality:
where t=1, 2, … , 42 reflects time (in months) and εt is possibly correlated zero mean Gaussian random variables with variance σ2. Because a log-transformation is used, all effects should be interpreted in multiplicative fashion, i.e. exp(β0) corresponds to the base level and exp(β1) is the factor multiplied on this base level for each additional month. Furthermore, f(t) is a periodical function with period 12 months, e.g. f(1)=f(13). The function f(t) is obtained by combining several sine and cosine terms with different frequencies. An advantage of the above regression formulation is that additional covariates can be easily be added to the model.
The expectation of the response can be calculated as
When using, e.g. vaccination coverage instead of time as linear covariate, vaccine effectiveness is defined as 1 – μ100% coverage/μ0% coverage=1 – exp(β1)100.
Since our data are of time-series nature, we expected the observations y t to be correlated. Even after modelling trend and seasonality as explained above, we expected remaining correlation to be present within the series. If this additional correlation (i.e. autocorrelation) is not taken into account, the standard errors obtained from the modelling would be too optimistic and hence wrong results about significance will be obtained. To capture this autocorrelation, a ARMA(p,q) model with p autoregressive (AR) and q moving-average (MA) terms is fitted to the residuals, εt. This modelling approach is a well-known procedure from time-series analysis for fitting seasonal time-series data [Reference Shumway and Stoffer43].
Estimation of the model parameters β0, β1, σ2, the parameters of f(t) and the coefficients in the seasonal ARMA model given known values of p,q was performed by standard likelihood methods. The appropriate parameters p,q of the ARMA(p,q) time-series model were selected according to AIC in all nine models with p,q being either 0, 1 or 2. We also investigated seasonal ARMA(p,q) models, but as the seasonality is modelled explicitly using f(t), no such additional complexity improved the AIC.
The age-specific dynamics in the mean number of cases per reporting unit is modelled by a two-stage approach. First, the above presented seasonal ARMA model captures the development in the mean number of visits per reporting unit over all age groups. Second, the vector of proportions (p t,<1, p t,1–2, p t,3–4, p t,5–9, p t,>9)T in age groups at a specific time-point is modelled by multinomial logistic regression using category-specific intercept, trend and period function (see e.g. [Reference Mebane and Sekhon39]). Altogether,
Level 1:

Level 2:
When estimating parameters at level 2 we used the actual observed c t and not the level 1 predicted c t – this makes it possible to fit the two models independently from each other. However, for the later predictions we combined level 1 and level 2 models using the multiplication y t×(p t,<1, p t,1–2, p t,3–4, p t,5–9, p t,>9)T, where y t is now the predicted value from level 1 and the vector of probabilities is the prediction from level 2. With this combination a time-series model for the mean number of cases per sentinel unit in each age group is obtained. We now calculate

for i=<1, 1–2, 3–4, 5–9, >9, with the β values and the γ values being the intercept and trend parameters in the level 1 and level 2 models, respectively, f(t) and f i(t) being the harmonic functions, and σ2 being the variance of the level 1 model error term. Note that for the reference age group (e.g. 1–2 years), the restrictions γ0,1–2=γ1,1–2=0 and f 1–2(t)=0 for all t applies, i.e. no parameters need to be estimated for this group.
A big advantage of our proposed multivariate two-phase model, compared to modelling the mean number of varicella cases separately for each age group, is that it takes into account, that the number of cases summed over the age groups equals the observed total number of cases. However, when considering the dynamics within a single age group in our model, the interpretation of the model parameters is not straightforward. Instead, we report ratios such as μ13,i/μ1,i giving the relative reduction within the first year of the sentinel network for a specific age group. Confidence intervals for these reduction factors can be obtained by parametric bootstrap exploiting the asymptotic normality of both the β values and the γ values in the computation of the respective μt,i values. When using vaccination coverage as linear covariate instead of time, the relative reduction μ100% coverage,i/μ0% coverage,i denotes the relative reduction in the expectation of the response in age group i – by comparing the 0% coverage with the 100% coverage situation. Again, this can be used to define vaccine effectiveness. In case the harmonic functions of time remain in the predictors of the level 1 and level 2 models, one would typically fix time to some arbitrary value, e.g. t=0, for the comparison.
DECLARATION OF INTEREST
The Varicella Sentinel is part of the work of the Measles and Varicella Working Group (Arbeitsgemeinschaft Masern und Varizellen), which is a joint initiative of the Robert Koch Institute and the vaccine manufacturers, GlaxoSmithKline and Sanofi Pasteur MSD, together with the German Green Cross. The manufacturers finance the work of the German Green Cross, which is responsible for the realization of the project. The Robert Koch Institute supplied scientific guidance and does not receive any financial support from the vaccine manufacturers.


