Reports have suggested that obesity levels in domestic cats are between 25 and 40 %(Reference Scarlett, Donoghue and Saidla1) and are increasing(Reference German2). Despite being obligate carnivores, domestic cats are consuming highly palatable, carbohydrate (CHO)-rich diets (30–60 % on a DM basis)(Reference de-Oliveira, Carciofi and Oliveira3). Domestic cats fed ad libitum on high-CHO, dry diets gained 1·5–2·0 kg in 16 weeks(Reference Weidgraaf, Tucker and Thomas4). Dry diets have a low protein:CHO ratio, which has been linked to obesity in cats(Reference Vester, Liu and Keel5) and human subjects(Reference Simpson and Raubenheimer6). While cats have a limited ability to digest dietary CHO(Reference Kienzle7, Reference Kienzle8), high dietary CHO levels, such as those found in dry diets, may result in a level of high-CHO load reaching the intestine. The impacts of this on intestinal microbiota are unknown; however, changes in dietary protein and fibre alter the major species in the feline intestinal tract, including Clostridium perfringens (Reference Lubbs, Vester and Fastinger9), Fusobacterium (Reference Lubbs, Vester and Fastinger9–Reference Bueno, Cappel and Sunvold12), Bifidobacterium (Reference Lubbs, Vester and Fastinger9), Escherichia coli (Reference Vester, Dalsing and Middelbos10) and Lactobacillus populations(Reference Vester, Dalsing and Middelbos10).
We hypothesise that the increase in CHO load associated with feeding of dry diets may alter the microbial populations within the digestive tract of the domestic cat. We investigate this hypothesis using faecal microbial populations as a representation of gastrointestinal microbiota. The aim of the present study was to investigate the effects of a 5-week dietary exposure to wet and dry diets on the faecal microbial population in domestic cats.
Materials and methods
Animals and diets
The protocol for the present study was approved by the Massey University Animal Ethics Committee (MUEAC no. 09/103). All cats were housed at the Centre for Feline Nutrition (Massey University, Palmerston North, New Zealand) according to the Animal Welfare (Companion Cats) Code of Welfare (2007). Before the study, all cats had complete blood counts, and thyroid assessment was carried out to ensure each cat was clinically and physiologically healthy.
The effects of wet (canned) or dry (kibbled) diets on the faecal bacterial communities of cats were investigated in eight domestic short-haired cats (four males and four females; averaging 6 years of age and 3·4 kg at the start of the study) using a nested design. The cats were housed in colony cages (1400 cm × 2400 cm × 4400 cm) and fed ad libitum a commercially available, Association of American Feed Control Officials (AAFCO, Atlanta, GA, USA) tested, wet diet (82·0 % moisture), which provided complete and balanced nutrition (crude protein 51·7 %, fat 28·9 %, CHO 8·9 % and ash 10·6 % DM) for the maintenance of adult cats, for 5 weeks. On the fifth week, the cats were placed in individual cages (80 cm × 80 cm × 110 cm) for 5 d to determine individual feed intakes and faecal outputs. Fresh faecal samples were collected twice daily, mixed for homogeneity, subsampled and stored at − 85°C until analysis. The process was then repeated for a commercially available, AAFCO-tested, dry diet (8·5 % moisture), which also provided complete and balanced nutrition (crude protein 33·0 %, fat 11·0 %, CHO 49·4 % and ash 6·6 % DM) for the maintenance of adult cats. Energy content of the diet was determined using the metabolisable energy protocol outlined by the AAFCO(13).
Microbial community analysis of cat faeces
Nucleic acids were extracted from 30 mg of faeces with a combined bead-beating and phenol–chloroform protocol(Reference Kittelmann and Janssen14). After bead beating with a FastPrep FP120 (Qbiogene, Carlsbad, CA, USA), cells were chemically disrupted with phenol–chloroform–isoamyl alcohol (25:24:1) and chloroform–isoamyl alcohol (24:1). DNA was precipitated from the aqueous phase with polyethylene glycol (30 %). The DNA pellet was washed with 70 % ice-cold ethanol, dried and resuspended in 100 μl of molecular biology grade water. Extracted DNA was quantified with a NanoDrop ND-1000 spectrophotometer (NanoDrop Technologies, Wilmington, DE, USA), quality checked on a 1 % agarose gel and the V2–V3 regions of bacterial 16S rRNA genes were amplified from each sample using primers heteroduplex diversity assay (HDA)1-GC and HDA-2(Reference Tannock15). PCR products were quality checked on 2 % (w/v) agarose gels to confirm a single band of approximately 200 bp(Reference Knoch, Nones and Barnett16). Products were purified using a MinElute PCR purification kit (Qiagen, Valencia, CA, USA) followed by digestion with Mung Bean nuclease (Promega, Madison, WI, USA) to remove single-stranded DNA. Denaturing gradient gel electrophoresis (DGGE) was performed using the Temporal Temperature Gel Electrophoresis System (CBS Scientific Company, Inc., Del Mar, CA, USA). The 6 % polyacrylamide gel contained a denaturing gradient of 35–70 % (100 % denaturant was 7 m-urea and 40 % (v/v) formamide)(Reference Knoch, Nones and Barnett16). Electrophoresis was performed at constant voltage (65 V) and temperature (60°C) for 14 h. The gel was stained with SYBR Gold (Invitrogen, Carlsbad, CA, USA) and visualised by UV transillumination (Fig. 1(a)).

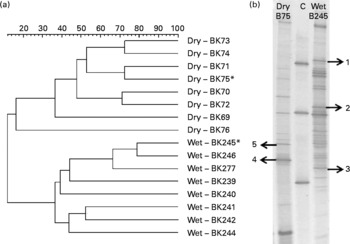
Fig. 1 (a). Dendrogram showing similarities of bacterial 16S rRNA gene community profiles obtained by denaturing gradient gel electrophoresis (DGGE) fingerprinting from the faeces of cats fed wet or dry diets. Samples denoted by an asterisk (*) were used for the excision of bands. (b) Exemplary DGGE profiles from cats fed wet or dry diets. Arrows indicate the positions, where bands were excised (based on their presence or absence from each diet), and DNA was recovered and sequenced. Numbers match the phylogeny assignments indicated in Table 1. A control marker (C) was applied as an external standard.
We selected five distinct bands based on their presence or absence from each diet and excised from a representative sample of each treatment group (Fig. 1(b)) in order to phylogenetically assign some of the bacterial populations potentially affected by the diet shift. DNA eluted from the band underwent PCR using HDA1/2(Reference Knoch, Nones and Barnett16). The resultant PCR products were purified (as described earlier) and cloned using the TOPO-TA cloning kit (Invitrogen). The inserts were amplified from the plasmids using HDA1-GC/HDA-2 primers(Reference Knoch, Nones and Barnett16), and correct band migration was verified by DGGE. DNA sequencing of clones was performed at the Allan Wilson Centre Genome Service (Massey University, Palmerston North, New Zealand) using a capillary ABI3730 Genetic Analyser (Applied Biosystems, Inc., Foster City, CA, USA), and sequence information was evaluated using the basic local alignment search tool (BLAST)(Reference Altschul, Gish and Miller17).
Bionumerics and statistics
Digital images of DGGE were analysed using the band-searching algorithm of the Bionumerics software (Applied Maths, Austin, TX, USA). The unweighted pair group method with arithmetic mean (UPGMA) cluster analysis of bacterial community profiles was performed using Pearson's correlation. A position tolerance of band matching of 1 % was used for all analyses. Energy intake and body weight were assessed for normality and the presence of outliers by plotting residuals v. the predicted residuals, and analysed using a general linear model (Minitab version 15; Minitab Limited, Coventry, UK), using diet type as the main factor of interest. Results are reported as means with their standard errors of the mean, and were considered significant at P < 0·05 and a trend at P>0·05 and P < 0·10.
Results
Energy intake tended (P < 0·10) to be higher in cats fed the dry diets (dry 467·7 v. wet 397·0 (sem 25·10) kJ/kg body weight per d). Body weight was similar (P>0·05) between the two feeding periods (dry 3·6 v. wet 3·4 (sem 1·4) kg).
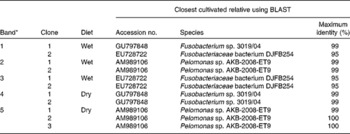
Changes in the bacterial communities in the faeces of cats fed wet and dry diets were assessed with DGGE. UPGMA cluster analysis of bacterial community profiles using Pearson's correlation revealed diet-specific clustering when the same cats were fed on either a dry or a wet diet (dissimilarity between the groups, 88·6 %; P < 0·001; Fig. 1(a)). Sequencing of selected bands (Fig. 1(b)) showed that, among others, the presence of individual species from the Fusobacteriaceae and Pelomonas species was changed by the dietary format (Table 1).
Table 1 List of clones that were obtained from excised DGGE bands along with their closest BLAST hits (excluding environmental clone sequences)

* Number of bands refer to Fig. 1.
Discussion
We identified a significant shift in faecal bacterial communities induced by a 5-week dietary exposure to dry and wet diets in the domestic cat. Changes in bacterial populations included alterations in the Fusobacteriaceae and Pelomonas species, which are known to be present within the feline digestive tract(Reference Ritchie, Steiner and Suchodolski18, Reference Ritchie, Burke and Garcia-Mazcorro19); however, their metabolic role is not clear. The present results are in agreement with recent studies using quantitative PCR which have shown that changes in the macronutrient content of the diet alter faecal microbial populations in the domestic cat. For example, high-protein diets increase the levels of C. perfringens and Fusobacterium species and decrease Bifidobacterium populations in the faeces of adult cats(Reference Lubbs, Vester and Fastinger9). In weaned kittens, high dietary protein decreased E. coli, Bifidobacterium and Lactobacillus populations(Reference Vester, Dalsing and Middelbos10). Changes in dietary fibre also affect the major bacterial populations in the domestic cat, including the Fusobacterium species(Reference Barry, Wojcicki and Middelbos11, Reference Bueno, Cappel and Sunvold12).
The cats in the present study were fed either a commercially available wet or a dry diet. While cats have evolved as strict carnivores with little or no CHO in their diets, the dry diet in the present study contained high (50 % DM) levels of CHO compared with the wet diet (9 % DM). This dry diet had a low protein:CHO ratio, which has been linked to obesity in cats(Reference Vester, Liu and Keel5) and humans(Reference Simpson and Raubenheimer6). The use of CHO in feline nutrition is a contentious issue, with debate about the long-term impacts on feline health due to high dietary CHO levels(Reference Laflamme20). The shifts in the faecal microbiota observed in the present study may be as a result of an increased CHO load entering the large intestine due to the low protein:CHO ratio in the dry diets.
Emerging evidence suggests that obesity is more than a disturbance of tissue metabolism and energy intake, and that microbiota are critical to the development of obesity(Reference Turnbaugh, Hamady and Yatsunenko21, Reference Turnbaugh, Ley and Mahowald22). Therefore, the development of obesity may be in part due to alterations in the microbial populations within the digestive tract of the domestic cat.
The present study shows that the changes that occurred in the faecal microbial population in domestic cats as a result of diet format were numerous but often subtle and therefore difficult to describe on a taxonomic level by means of DGGE alone. Alternative methods such as next-generation sequencing may provide a much more detailed insight into the effects of diet changes on the bacterial communities in domestic cats.
Acknowledgements
We acknowledge the assistance of Dr Shalome Basset (AgResearch), Ms Karin Weidgraaf and Margreet Hekman (Massey University) in the present study. The present study was funded by the Massey University Research Fund (09/0240). There are no conflicts of interest. E. N. B., N. C. R. and D. G. T. obtained funding, and designed and conducted the animal study. E. N. B., W. Y., S. K. and G. H. designed and conducted the laboratory component of the study. All authors contributed to the writing of the manuscript.


