Introduction
Pneumococcal disease is a major cause of morbidity and mortality in children and adults. Streptococcus pneumoniae (S. pneumoniae) can cause invasive and non-invasive infections. While invasive pneumococcal disease (IPD) typically results in the most severe outcomes, including long-term sequelae or death, non-invasive infections constitute a majority of pneumococcal disease cases and therefore lead to significant health care burden in terms of hospital admissions, primary physician appointments and antibiotic prescriptions [Reference Bornheimer1–Reference van Hoek4].
Pneumococcal disease has been prevented with pneumococcal conjugate vaccines (PCVs) in the UK since 2006 when the seven-valent PCV (PCV7; Wyeth) was introduced into the infant vaccination programme. In 2010, the 13-valent vaccine (PCV13; Pfizer Inc.) replaced PCV7. While PCV7 was initially licensed as a four-dose vaccine schedule, both vaccines were used in the UK immunisation programme in a three-dose schedule with administration at 2, 4 and 12 months of age. Both the 3 + 1 and 2 + 1 schedules (two and three primary infant doses, respectively, and one booster during the second year of life) have been shown to prevent acquisition of nasopharyngeal carriage, and therefore to reduce transmission, which is necessary to elicit the powerful indirect effect of PCVs [Reference Devine5, Reference van Hoek6]. This combination of direct and indirect protection has resulted in reduced pneumococcal disease following national programme implementation, in the UK and in other countries among vaccinated and unvaccinated persons, including IPD [Reference Ladhani7, Reference Waight8], otitis media in children [Reference Lau9] and vaccine-type community-acquired pneumonia (CAP) in adults [Reference Rodrigo10].
Recently, the UK's Joint Committee on Vaccination and Immunization (JCVI) has advised the removal of an additional priming dose, leaving a single priming dose moved to 3 months of age followed by a booster at 12 months [11]. Arguments supporting this change include the potential to reduce injection burden in a crowded infant vaccine schedule [11, Reference Flasche12]. To support this change, a study found that immune responses following the booster dose in a 1 + 1 and a 2 + 1 PCV13 schedule were similar with regards to immunogenicity after the booster dose for nine of the 13 vaccine serotypes, with four vaccine serotypes having lower immunogenicity in the 1 + 1 schedule compared with the 2 + 1 schedule [Reference Goldblatt13]. However, delaying the first and only priming dose from month 2 to 3 increases infants’ vulnerability to pneumococcal disease during the highest risk period. Furthermore, data from the same study showed a single priming dose elicited significantly inferior antibody responses for 12 of the 13 serotypes when compared with infants who received two priming doses as assessed at 5 months of age [Reference Goldblatt13].
The success of the 1 + 1 schedule depends on two assumptions: (1) that vaccine-type carriage and subsequent transmission exist at low levels and (2) that they will remain low or decrease further under the influence of the reduced schedule. If either of these assumptions does not hold true, the proposed schedule is likely to lead to increased disease attributable to both direct and indirect effects. The scale of this increase depends on several factors including decreased vaccine effectiveness against carriage acquisition, increased likelihood of transmission during carriage, increased cumulative exposure, decreased duration of protection and immunisation coverage [Reference Flasche12].
The most recent surveillance data from the UK demonstrate increases in IPD due to several vaccine serotypes, suggesting ongoing transmission [Reference Ladhani7]. For example, data from the UK national surveillance programme indicate vaccine-type disease persists in a sizeable portion of IPD in age groups that have not been directly vaccinated, and for some vaccine-type serotypes, IPD incidence has increased over the past several years [Reference Ladhani7, 11, Reference Collins14]. The reasons for this remain unknown and may reflect decreased vaccine effectiveness against carriage acquisition for some serotypes or the existence of important sources of transmission outside the toddler age group. Regardless, these data indicate that vaccine-type serotypes continue to circulate in the population, exposing infants to vaccine-type pneumococci carriage acquisition, and underscoring the potential risks of a single PCV13 priming dose. This is likely to lead to increased pneumococcal transmission, including non-vaccinated age groups, such as adults over the age of 65 years or those with chronic medical conditions.
The public health impact of the proposed change from a 2 + 1 to a 1 + 1 PCV dosing schedule is uncertain. This analysis models the potential population health impact of moving from a 2 + 1 to a 1 + 1 PCV13 dosing schedule in the UK to help reduce this uncertainty and inform decision-makers. In the following sections, we describe the mathematical model developed and present results, including an array of scenario analyses around key uncertainties, comparing the current 2 + 1 PCV13 schedule vs. the proposed 1 + 1 schedule.
Methods
We developed a two-part model to estimate the population-level effect of moving to a 1 + 1 schedule in the UK: the first part estimated IPD incidence, and the second part estimated non-invasive disease incidence given the IPD incidence. The approach for each model component is outlined below.
IPD model structure
We built a deterministic compartmental model to estimate IPD incidence considering each vaccination programme (Fig. 1). Individuals flow through ‘susceptible’ vaccination compartments based on vaccination history: no vaccination (NV), received one primary dose (V1), received two primary doses (only applicable to the 2 + 1 schedule) (V2) and received the booster dose (V3). Infants enter the model in the NV compartment completely susceptible to carriage and IPD. They receive the first primary dose before the age of one year, with a probability based on the vaccine schedule, the individual's age (age groups seen in Table 1) and vaccine schedule adherence [15]. Those who receive the first vaccine dose may subsequently receive the second priming dose (2 + 1 arm only) or remain in the first vaccine compartment. At 12 months, infants (regardless of priming dose history) may receive the booster dose (V3).
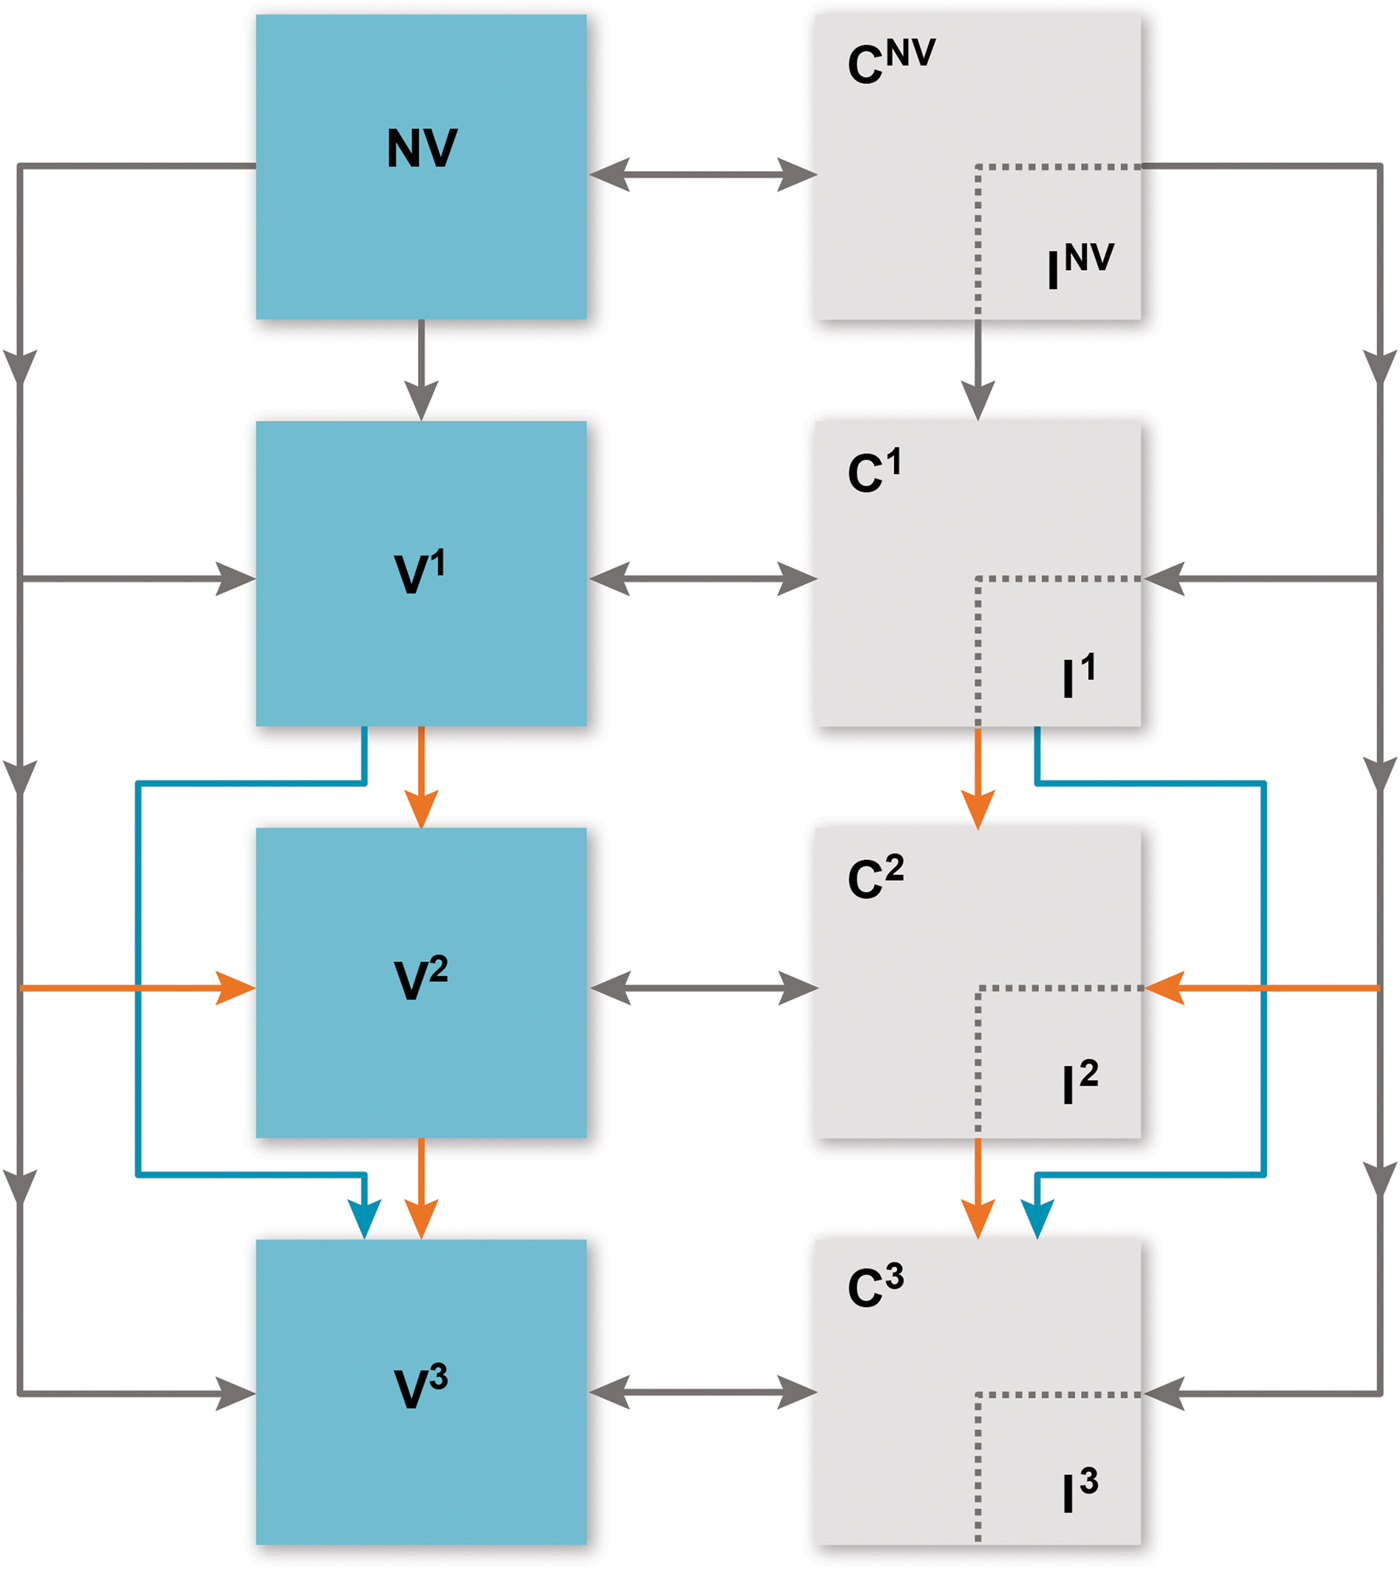
Fig. 1. Overview of model. C, carriage; I, invasive pneumococcal disease; NV, no vaccine; V1, received one primary dose; V2, received two primary doses (only applicable to the 2 + 1 schedule); V3, received the booster dose. Compartments relevant to vaccine doses (both carriage and susceptible) are further stratified into ‘no immunity’ and ‘partial immunity’ induced by vaccine effectiveness, age group and serotype group. Orange arrows indicate 2 + 1 schedule dynamics and blue arrows indicate 1 + 1 schedule dynamics. Grey arrows are applicable to the dynamics of both vaccine schedules.
Table 1. Epidemiological parameters

CAP, community-acquired pneumonia; IPD, invasive pneumococcal disease; N/A, not applicable; PCV, pneumococcal conjugate vaccine; PCV7, seven-valent PCV; PCV13, 13-valent PCV.
From any susceptible compartment, individuals may become pneumococcal carriers (C). Upon acquiring a serotype, a proportion of carriers are assumed to immediately experience IPD and are treated appropriately (thus do not spread disease). Disease transmission is therefore driven by carriage prevalence. Carriers not experiencing IPD are assumed to clear the serotype after a given duration and return to the corresponding susceptible compartment [Reference Mosser16].
We consider five serotype groups: serotype 19A, serotype 3, the remaining PCV13 serotypes (1, 5, 7F and 6A) not covered by PCV7, PCV7-covered serotypes and non-covered serotypes. These groups were chosen because of the invasiveness of serotypes 19A and 3 and their continued circulation [Reference Ladhani7, 11, Reference Goldblatt13, Reference Collins14], and to allow the model to appropriately fit to PCV7-era data. To account for competition among serotypes, we assume individuals may carry only one serotype at any time.
IPD model inputs
IPD model inputs are presented in Table 1. Details on parameter estimate calculations are presented in the Supplementary Material available on the Cambridge Core website.
We estimated vaccine effectiveness parameters using two recent UK-specific studies estimating serotype-specific vaccine effectiveness by priming and booster dose [Reference Andrews17, Reference Andrews18]. We calculated vaccine effectiveness against IPD as:
where VEOI = vaccine effectiveness against IPD, VEc = vaccine effectiveness against carriage and VEi = vaccine effectiveness against IPD given carriage acquisition [Reference Andrews17, Reference Andrews18]. In the base case model, we assumed that the effectiveness of the first priming dose and of the booster dose are equal in the 1 + 1 and 2 + 1 schedules. Therefore, the only difference in the 1 + 1 schedule is the delayed receipt of the first priming dose and the lack of a second priming dose.
The probability of carriage acquisition given contact with a carrier for a susceptible person is calibrated and depends upon immunity level, vaccine experience and a contact mixing matrix. Details on these parameters can be seen in the Supplementary Material.
The probability of incurring IPD given carriage and duration of carriage by serotype was obtained from a UK-specific study that estimated serotype-specific attack rates and invasiveness [Reference Sleeman19].
Finally, birth rates (births per 100 000) were obtained from the World Bank [20]. All-cause mortality was obtained from the Office of National Statistics [21]. Case fatality ratios were obtained from a previous economic analysis [Reference Melegaro and Edmunds3].
Calibration
Due to limited availability of data, we calibrated many model parameter estimates. Specifically, we estimated these unknown input parameters such that the model approximated historical IPD surveillance data as closely as possible [Reference Ladhani7, Reference Waight8]. We then use the calibrated parameter estimates to forecast future disease incidence. Details of the calibration procedure and fit are presented in the Supplementary Material.
Non-invasive disease model inputs
To address the impact of nasopharyngeal carriage on non-invasive disease, we applied a previously described multiplier approach [Reference Thorrington22–Reference van Hoek24]. Specifically, we assumed a constant proportional change in pneumococcal CAP and otitis media incidence relative to IPD incidence. We used data from the Health Improvement Network (THIN) for mild otitis media [25] and Hospital Episode Statistics (HES) for moderate/severe otitis media [26]. For CAP, we considered only adjusted hospitalised pneumonia incidence [26, Reference Daniel27]. We assume 39.8% of overall CAP and otitis media is caused by S. pneumoniae [Reference Bewick28]. Age-specific multipliers for pneumococcal CAP and otitis media are then estimated as the ratio of pneumococcal CAP and otitis media to IPD in the most recent year of historical data (Supplementary Table S1). We then estimated that the cases of pneumococcal otitis media and CAP by multiplying forecasted age-specific IPD incidence by the age-specific multiplier.
Scenario analysis
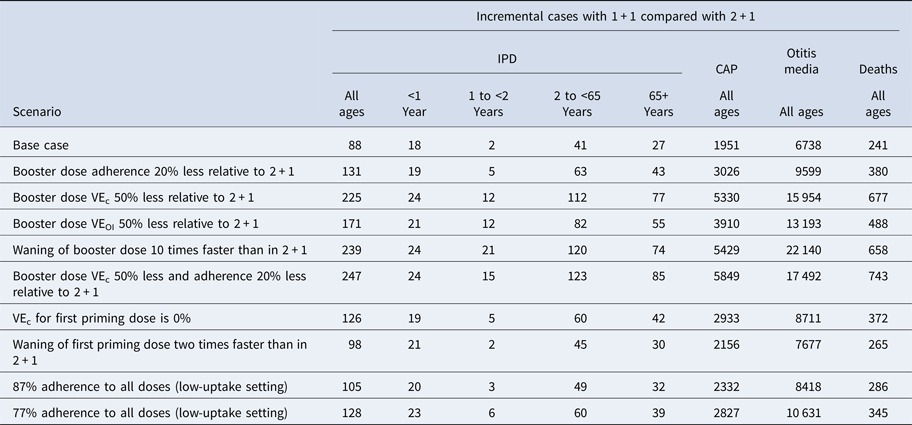
Considering the uncertainty around the expected impact of 1 + 1 dosing, we conducted an extensive set of scenario analyses varying the vaccine effectiveness, waning and adherence of both the primary and booster doses in the 1 + 1 schedule:
• Booster dose adherence was assumed to be 20% less relative to 2 + 1.
• VEc was assumed to be 50% less relative to booster dose in 2 + 1.
• Booster dose vaccine effectiveness for IPD (VEOI) was assumed to be 50% less relative to the booster dose in 2 + 1.
• Waning of booster dose was assumed to be up to 10 times faster than in 2 + 1.
• VEc for the first priming dose was set to zero.
• Waning for the first priming dose was assumed to be two times faster.
Additionally, we considered ‘low-uptake’ scenarios to estimate the potential impact of low adherence:
• Adherence (all doses) = 87%.
• Adherence (all doses) = 77%.
Results
The calibration procedure provided a good fit to historical data (Fig. 2). Figures stratified by serotype and all age groups can be found in the Supplementary Material.
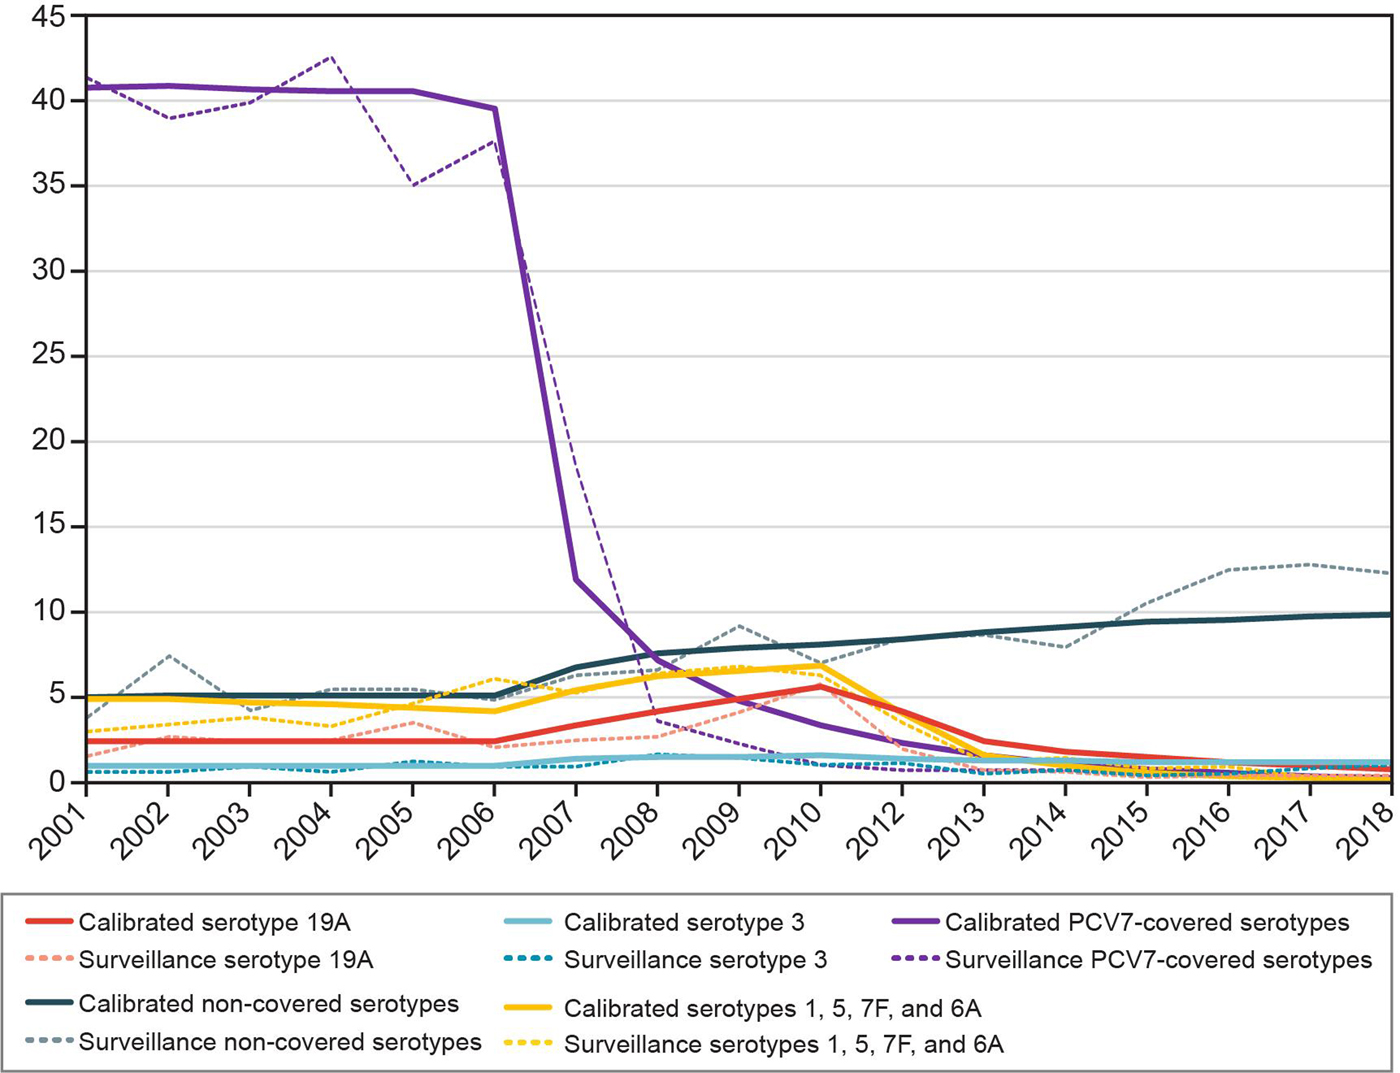
Fig. 2. Historical invasive pneumococcal disease incidence per 100 000: calibrated model compared with surveillance data for 0 to <2 year olds. PCV7, seven-valent pneumococcal conjugate vaccine.
Over a 5-year period from 2018 onwards, the model estimated 23 638 cases of IPD across all age groups for a 2 + 1 schedule. In the base-case analysis, we estimate reducing to a 1 + 1 schedule would result in an additional 88 cases of IPD over 5 years (Table 2). In 10 years, this difference would be 194 cases (data not shown). The largest net increase occurred in ages 65+ years (27 IPD cases), and the largest proportional increase was in ages <1 year (18 IPD cases, 4.0%). In 5 years, vaccine-type IPD cases contributed 104 cases to the net increase in the number of IPD cases (2.4% increase), offset by a decrease in non-vaccine-type disease due to serotype competition. Serotype 19A accounted for the largest increase in IPD (71.4% of incremental cases), with 18 more cases in ages 65+ years and 11 more cases in ages <2 years.
Table 2. Base-case results over a 5-year horizon

CAP, community-acquired pneumonia; IPD, invasive pneumococcal disease.
In one-way scenario analyses, the cumulative incremental cases of IPD in a 1 + 1 schedule ranged from 88 to 238 over 5 years for all age groups (Table 3; Fig. 3). Incremental IPD cases ranged from 18 to 24 (4.0–5.3%) for ages <1 year, from 2 to 21 (0.4–5.1%) for ages 1 to <2 years, from 41 to 120 (0.3–1.0%) for ages 2–64 years and from 27 to 74 (0.2–0.7%) for ages 65+ years. Setting vaccine effectiveness against carriage for the 1 + 1 booster dose to 50% less than that of 2 + 1 resulted in the largest increase in IPD cases for ages <1 and 65+ years. The largest increases in IPD cases were seen in scenarios adjusting booster dose parameters. Two-way scenario analyses around the booster dose adherence and the effectiveness against carriage suggest that the increase in cases of IPD is magnified as both parameters are varied (Table 3, Fig. 4).
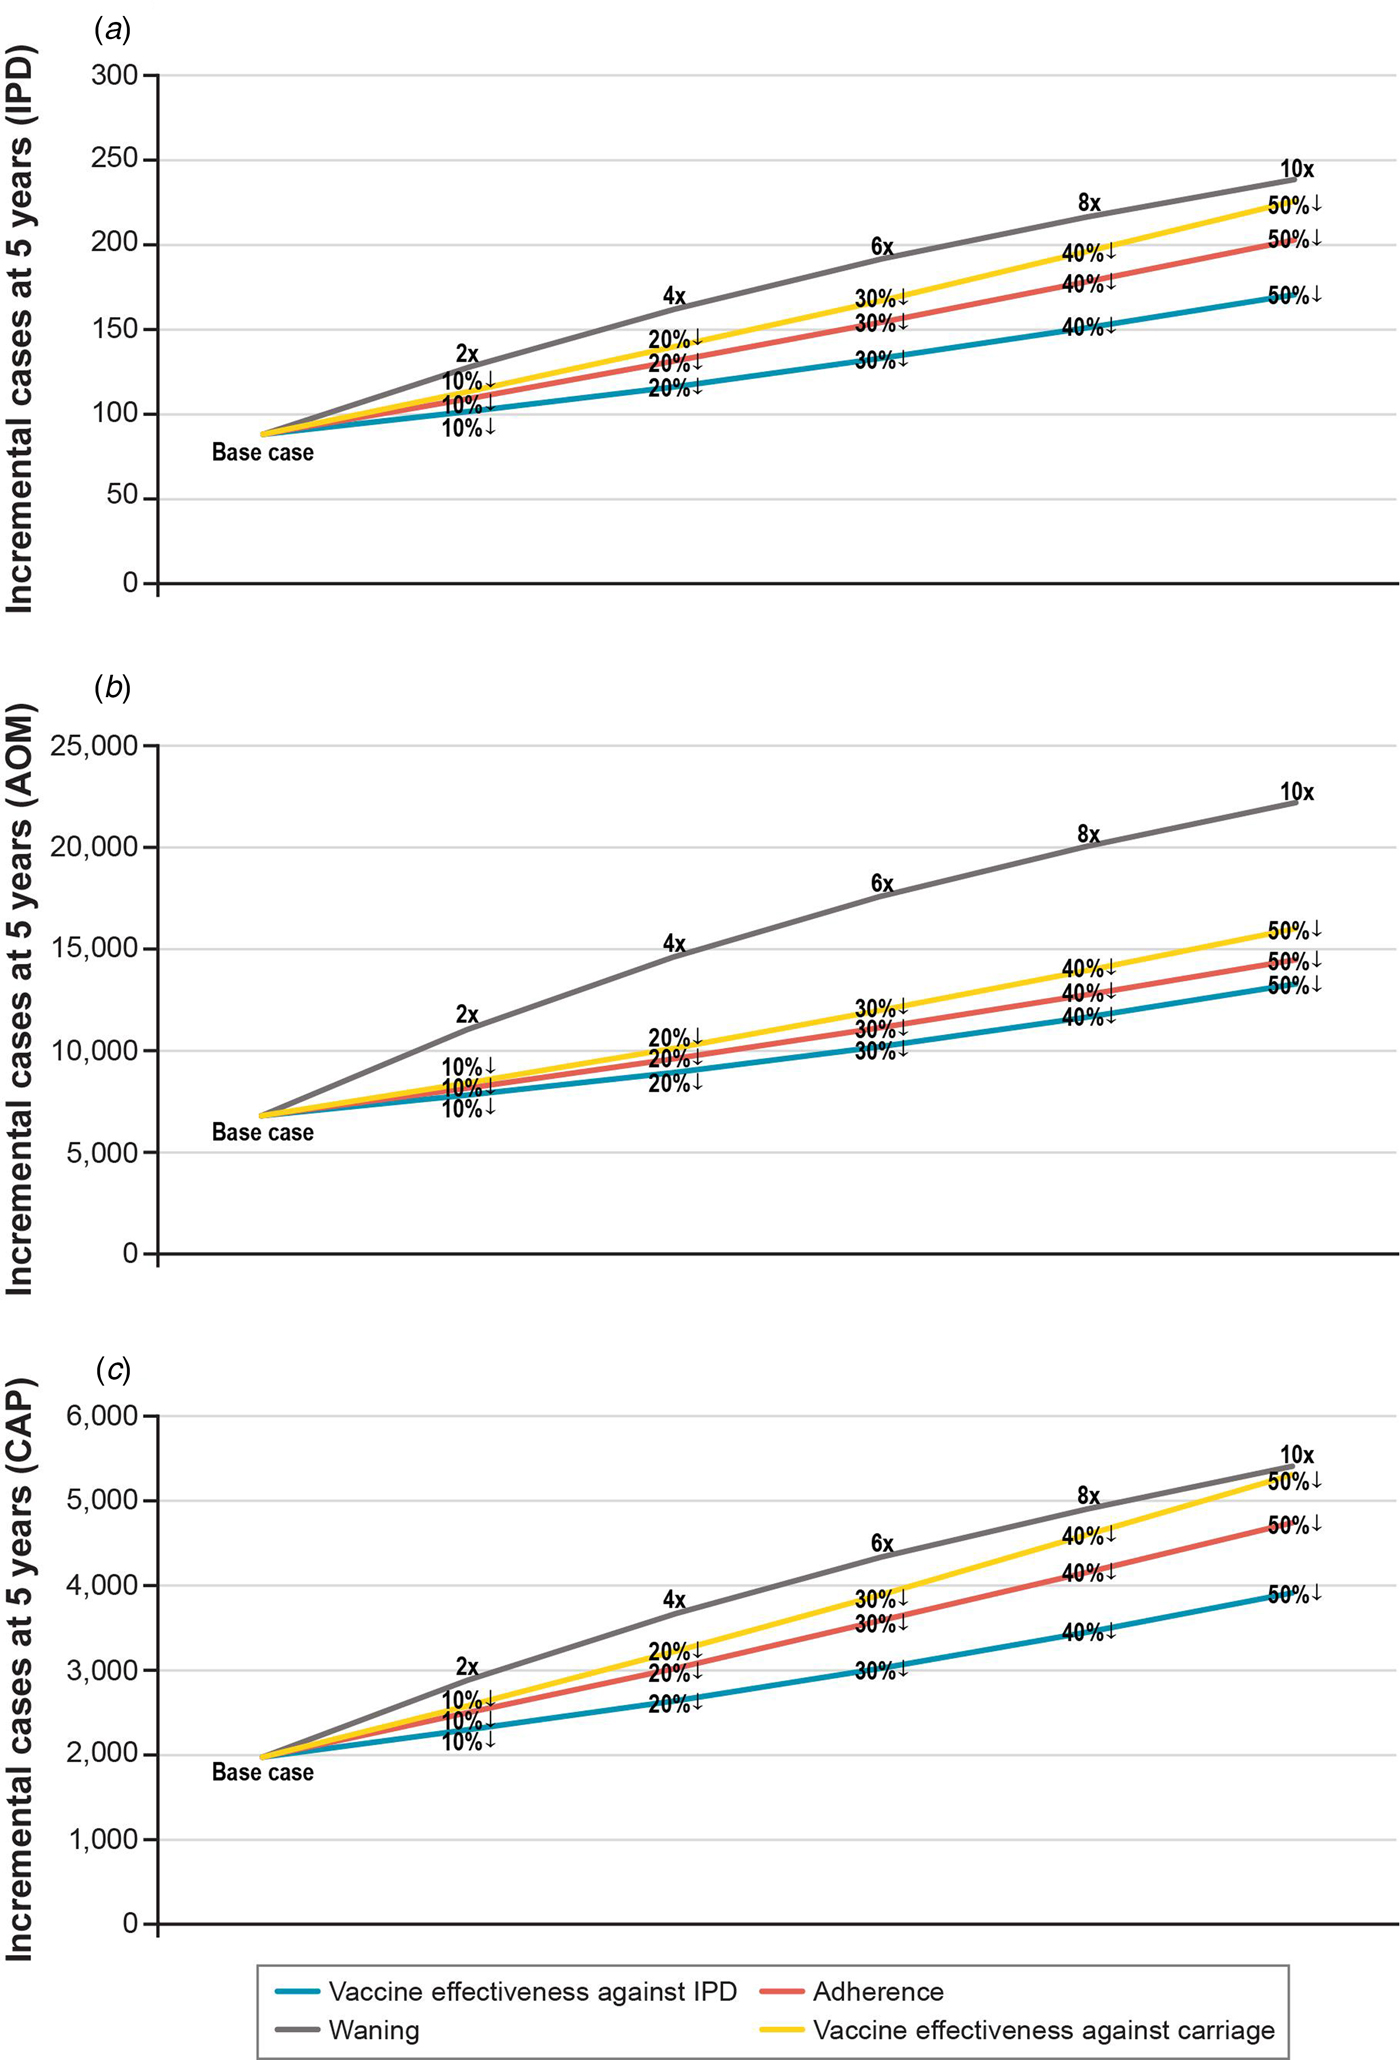
Fig. 3. Scenario analysis: incremental cases of pneumococcal disease at 5 years when varying 1 + 1 booster dose parameter assumptions relative to 2 + 1. Data labels reflect how 1 + 1 booster dose parameters change relative to 2 + 1. Percentages with a down arrow indicate a percentage reduction relative to 2 + 1. Numbers adjacent to a multiplication sign signify that the 2 + 1 parameter was multiplied by the number (e.g. a faster waning rate). IPD, invasive pneumococcal disease.
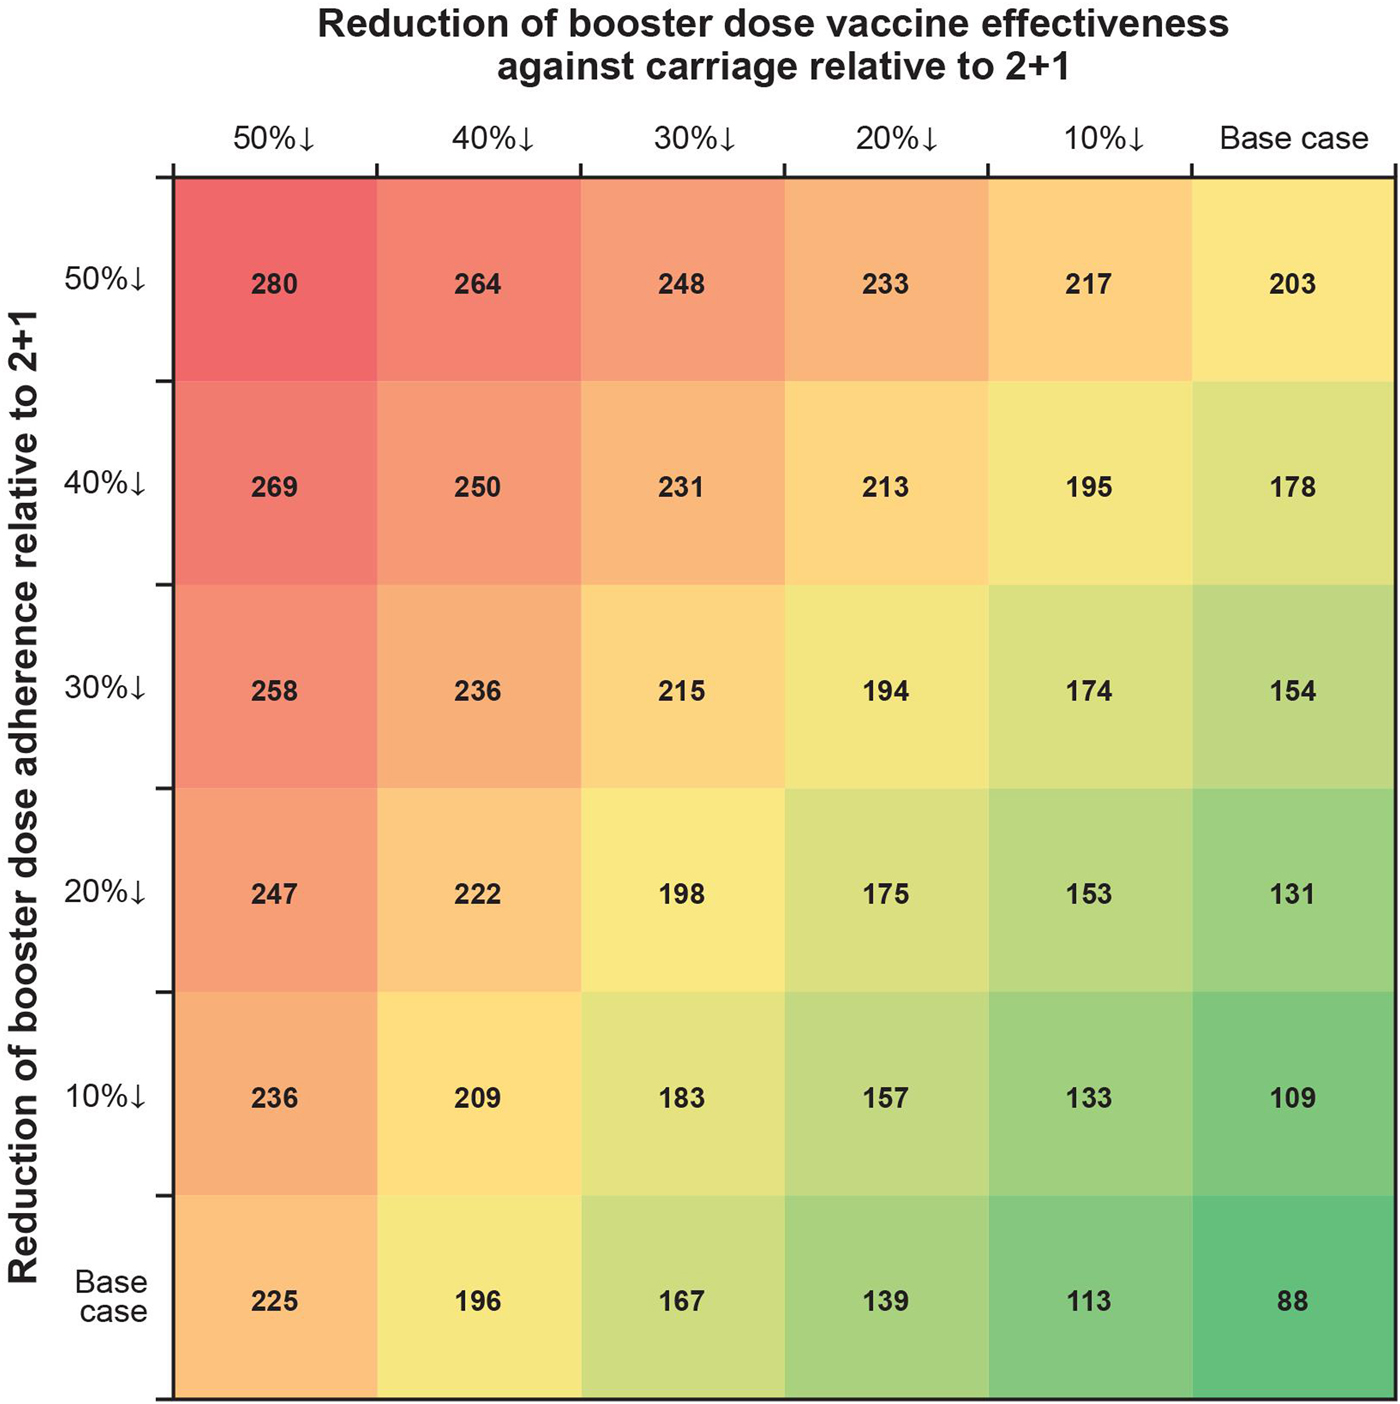
Fig. 4. Two-way scenario analysis: incremental cases over 5 years varying 1 + 1 booster dose vaccine effectiveness against carriage and booster dose adherence relative to 2 + 1.
Table 3. Scenario analysis results: incremental cases over 5 years
CAP, community-acquired pneumonia; IPD, invasive pneumococcal disease; VE, vaccine effectiveness.
Results presented are the incremental outcomes of a 1 + 1 schedule compared with a 2 + 1 schedule.
Reducing the priming dose effectiveness against carriage, to reflect the reduced immune response of the priming dose in the 1 + 1 study [Reference Goldblatt13], increased the incremental difference in cases of IPD over 5 years from 88 in the base case to 127 (Table 3).
In addition to IPD, we estimate that a 1 + 1 schedule would result in 1951 and 6738 additional cases of CAP and otitis media, respectively, under base-case assumptions (Table 2). In scenario analyses, we find the 1 + 1 schedule could lead to 27 569 additional non-invasive cases (Table 3; Figs 3b and 3c). Switching to 1 + 1 was also expected to increase mortality over 5 years, with an estimated increase of 241–743 more deaths (Table 2; Table 3).
Discussion
Using a dynamic transmission model framework, we estimated the potential impact of a change of the current 2 + 1 infant PCV programme to a 1 + 1 schedule in the UK. The model estimated that eliminating a priming dose could lead to an additional 88–238 cases of IPD over 5 years, with continued increases out to at least 10 years. The largest net increase in cases occurred in adults over 65 years, with the largest proportional increase (4.0–5.3%) occurring in infants <1 year. In scenario analyses, altering the effectiveness against carriage of the booster or priming dose for 1 + 1 yielded larger increases in IPD incidence, predominately in older age groups. The predicted increase in CAP and otitis media was more substantial (8689–27 569 cases) than that seen for IPD. Thus, the individual and health care system impact of an increase in mucosal disease could be quite substantial, considering the increasing elderly population within the UK. In addition, due to the increased case fatality rate of CAP in older individuals [Reference Melegaro29], CAP made a significant contribution to the increase in deaths associated with the 1 + 1 schedule (224–693).
Minimizing the negative impact of a policy shift to a 1 + 1 schedule requires that several criteria be met, all three of which remain uncertain given current evidence. First, vaccine-serotype carriage levels must be reduced such that the removal of a priming dose will not leave those under the age of 12 months exposed to and at risk of acquiring a vaccine serotype. While UK vaccine-type carriage levels may have decreased in the youngest age groups in recent years due to vaccine pressure, persistence of invasive vaccine-type disease and increases in recent years of certain vaccine serotypes [Reference Ladhani7] suggest that carriage levels remain sufficient in some unappreciated reservoir. Therefore, a schedule change could result in more cases than our model estimated in both infants and unvaccinated age groups.
Second, removing a priming dose would provide sufficient protection only if adherence to the full schedule were high. In some countries, booster dose adherence is too low to sufficiently disrupt population transmission dynamics. In such cases, removal of a priming dose may further increase circulation of vaccine-type carriage and therefore increase disease risk. Similarly, population segments may have suboptimal vaccine adherence, creating a risk of relatively larger increases in disease compared with areas of high uptake. This is a potentially significant issue in areas such as London with large populations (8.7 million) and relatively lower vaccine uptake (84.5%, range 65.6–93.8%, PCV booster at 24 months) [15].
Finally, the impact of a reduced priming schedule on the vaccine effectiveness against carriage is of paramount concern when switching to a 1 + 1 schedule [Reference Flasche12]. In a 1 + 1 schedule, booster dose protection against carriage and the duration of its protection are uncertain, and the recently completed immunogenicity study does not provide insight into this question [Reference Goldblatt13]. Similarly, the impact of the reduced immune response of the single priming dose on carriage is uncertain. Our analysis found that these parameters have a significant impact on disease and mortality in older age groups. Thus, we may be underestimating the impact of reducing the number of doses from 2 + 1 to 1 + 1 if our conservative assumptions on booster and priming dose efficacy are incorrect. In addition, our model did not consider importation of additional carriage, which may further understate the potential impact of any change [Reference Abel and Sander30].
Our mathematical model used a compartmental model design that is common in this disease area [Reference Choi31–Reference Snedecor33]. Previous studies have either restricted the age groups considered [Reference Van Effelterre34] or the number of serotype groups considered [Reference Snedecor33]. However, by modelling several age and serotype groups, we have been able to model the impact on carriage acquisition and disease at an increased level of refinement. We also accounted for the historical effects of switching from PCV7 to PCV13 and considered both IPD and carriage separately, unlike previous analyses [Reference Choi35]. This was done to align with observed UK IPD incidence, rather than solely fitting the model to carriage data and potentially over- or underestimating rates of disease. This is important given that recent shifts in IPD incidence may not be easily predicted, given historic data on circulating carriage available in the UK. Additionally, we considered vaccine characteristics (peak vaccine effectiveness, waning rate, etc.) separately for each vaccine dose, unlike previous studies [Reference Snedecor33, Reference Van Effelterre34].
PCV use has demonstrated effectiveness in 3 + 1, 2 + 1 and 3 + 0 schedules worldwide. However, while a recent study demonstrated a non-inferior immune response following the booster dose for nine of 13 serotypes in a 1 + 1 schedule [Reference Goldblatt13], no real-world evidence exists on its effectiveness against carriage and disease and the relative contribution of the priming dose on these outcomes. The recently conducted immunogenicity study showed that a single PCV dose at age 2–3 months is poorly immunogenic (significantly lower than two doses for 12 of 13 serotypes) and likely minimally protective. For eight serotypes, <50% of children had geometric mean concentration (GMC) ⩾0.35 µg/mL at age 5 months (the established correlate of protection) [Reference Goldblatt13]. This indicates that a 1 + 1 schedule increases the vulnerability of infants to vaccine-type IPD, pneumonia and otitis media at an age when disease risk is highest. The authors argue that a single dose of vaccine given during the first year of life provides protection consistent with the previous case–control studies in the UK [Reference Andrews18] and the USA [Reference Whitney36]. However, in neither case do the study designs address the potential diminished protection of infants vaccinated at 3 months and followed to 12 months.
While there is a significant uncertainty around the success of a 1 + 1 programme to prevent IPD, the uncertainty around the increase in non-invasive disease and associated mortality is even greater, as the burden of these diseases is underestimated [Reference Chalmers37]. Furthermore, it has been postulated that by preventing early-onset otitis media cases caused by vaccine-type serotypes contained within PCVs, more complex downstream cases such as those caused by other S. pneumonia serotypes and other pathogens (e.g. non-typeable Haemophilus influenza) can be averted due to maintenance of the biofilm in the inner ear [Reference Dagan38, Reference Lewnard39]. By removing a dose of PCV in early life, there could be a cascade effect causing a much greater burden of more complex and severe otitis media cases for infants and toddlers in the UK.
Our analysis also suggests that serotype 19A may be a significant contributor to any increase in disease, accounting for 71% of the increase in disease in the base case. Serotype 19A has been shown to be a highly invasive serotype and often resistant to antibiotics [Reference Isturiz40]. As a result, a large increase in mucosal diseases such as otitis media is highly likely to result in more antibiotic prescriptions and therefore an increase in antimicrobial resistance. While it was not possible to quantify, it is an important consequence of increased disease that should be taken into account given the drive within the UK and globally to reduce the number of antibiotic prescriptions and avoid increases in antimicrobial resistance [Reference O'Neil41].
Our approach is subject to several limitations, both computational and data specific. The most important is the uncertainty around booster and priming dose effectiveness between a 1 + 1 and 2 + 1 schedule. While preliminary results of the immunogenicity study suggest that the GMCs after booster dose in the 1 + 1 schedule are non-inferior to those in the 2 + 1 schedule for nine of the 13 serotypes, this does not provide sufficient evidence on the protection against carriage [Reference Goldblatt13]. The impact of the reduced response for these four serotypes may be small, but it puts additional importance on booster dose adherence, something that is variable across the UK [15]. The established correlate of protection for IPD is 0.35 mg/mL following the primary immunisation in infancy. This correlate of protection was developed using thresholds from a population of infants with primary series vaccination and is not a correlate in children ⩾12 months of age [Reference Jodar42, 43]. A correlate of protection significantly higher than 0.35 mg/mL is believed to be necessary to protect against carriage [Reference Flasche12, Reference Goldblatt44]. Thus, we considered variability in the booster dose's effectiveness against carriage to understand potential ranges in breakthrough vaccine-type disease. This was found to be one of the most sensitive parameters in our analyses, further highlighting the uncertainty surrounding the impact of a 1 + 1 schedule.
Furthermore, there is still considerable uncertainty in the risk of carriage and disease in the first 12 months of life [Reference Hussain45–Reference Sleeman47]. In the base case, we assumed that the first priming dose in a 2 + 1 schedule and the only priming dose in a 1 + 1 schedule provide equivalent protection, and that infants receive their priming dose in the scheduled month. However, it is unclear whether the first priming dose provides any protection, given that only five serotypes reached the 0.35 mg/mL correlate of protection in the immunogenicity study [Reference Goldblatt13]. If the first priming dose does not provide protection, we would be underestimating the increase in cases with a 1 + 1 schedule. Additionally, our estimates of vaccine effectiveness (direct protection and carriage) for a single priming dose may be overestimated since the Andrews et al.’s indirect cohort study does not indicate when an individual received an initial priming dose [Reference Andrews18]. In that study, some infants could have received a higher level of protection if they received their single dose later than 3 months of age. Therefore, we included a scenario in which the first priming dose's vaccine effectiveness against carriage was zero. While the impact was not as pronounced as that for the booster dose, the removal of vaccine effectiveness against carriage for the priming dose did result in a substantial increase in disease and mortality compared with the base case where we assumed some impact on carriage.
Computational limitations required restricting the number of modelled compartments. First, we assume carriage of only one serotype or serotype group at any time [Reference Lamb, Greenhalgh and Robertson32, Reference Snedecor33, Reference Bottomley48]. Studies that considered carriage of multiple serotypes either focused on only younger age groups [Reference Van Effelterre34, Reference Choi35], had limited serotype-group differentiation [Reference Choi31, Reference Choi35] or were fit to specific datasets from small populations [Reference Bottomley48]. In one study, the authors tested their model with and without co-colonisation and concluded that restricting to carrying only one serotype at a time did not meaningfully affect their results [Reference Bottomley48]; and while co-colonisation studies are becoming more available due to better testing methods, the epidemiology and dynamics surrounding co-colonisation are not well understood [Reference Brugger, Hathaway and Muhlemann49, Reference Saha50]. However, our assumption may be conservative as carriage prevalence could be higher than our model estimates due to co-colonisation. Second, our model does not account entirely for recent increases of disease due to non-vaccine-type disease in the UK elderly population [Reference Ladhani7]. This is likely because our model did not differentiate the carriage duration or invasiveness of a serotype by age. Older individuals with comorbidities who are exposed to a particular serotype may have a higher likelihood of developing disease that could not be accounted for given the estimated non-vaccine-type carriage rates in children. Further research is necessary to understand the variation in age-dependent invasiveness of specific serotypes.
Mathematical models are useful tools to predict outcomes following policy changes; however, when considering these outcomes at a population level, the humanistic impact is at risk of being overlooked. Recent evidence in meningococcal vaccine policy illustrate this directly: following the JCVI decision to withdraw the infant meningococcal C vaccine due to low rates of disease and potential cross-protection afforded by other elements of the programme, cases of meningococcal C disease in England have tripled from five to 15 cases from 2016 to 2017 [51, 52]. The unexpected recent increase in infant meningococcal C cases suggests that caution is needed before removing infant doses, even when the disease seems to be very well controlled. Considering the significant amount of uncertainty that exists to inform a decision around 1 + 1 dosing, it is important that decision-makers consider the full range of impacts prior to trialling any change. If a decision is taken to trial a change in schedule, it is important that all disease outcomes are monitored, not just invasive disease, and that data are collected for those key areas in which they are currently lacking.
Our analysis suggests that the removal of a priming dose will increase the number of cases of IPD, and that there would be an associated increase in non-invasive disease leading to substantial burden to the National Health Service at both a hospital and primary care level. Our conservative estimates also suggest a switch could cause several hundred additional deaths in the UK over the first 5 years. The impact of disease would affect not just the infant population, but also older ages, especially the elderly. Considering the uncertainty in the clinical relevance of the immune response in direct and indirect protection, and current epidemiological trends in disease and carriage under the current 2 + 1 schedule, a nationwide 1 + 1 PCV schedule implementation in the UK that could affect invasive disease, pneumonia, otitis media and others should be considered experimental and implemented with extreme caution and complete disclosure.
Supplementary material
The supplementary material for this article can be found at https://doi.org/10.1017/S095026881800198X
Financial support
This work was funded by Pfizer Inc.
Conflict of interest
Dr Lucas, Mr Wilson and Dr Brogan are employees of RTI Health Solutions. Mr Wasserman, Ms Hilton, and Dr Farkouh are employees of Pfizer Inc. Dr Jones, Dr Vyse and Mr Madhava are employees of Pfizer Ltd. Professor Slack is an Independent Consultant Medical Microbiologist on consultancy with Pfizer Inc.


