The version of Equation (1) that was used to transform F mgii to (F mgii/F bol) had an incorrect unit conversion, with the result that the computed values of log (F mgii/F bol) are too small by a constant factor of 3.0 dex. As a result this factor of 3.0 needs to be added to the vertical axis scale in Figures 2, 3, and 13, and the horizontal axis scale in Figures 8, 10 and the lower panel of Figure 7. The morphology of the figures is otherwise unchanged. For completeness, accurately-labelled versions of these figures are included with this Corrigendum.
Incorrectly labelled figures:
In addition, the correct zero-point term in Equation (3) should be −4.8 rather than −7.8.
The correct zero-point term in Equation (7) should be −11.16(±1.86) rather than −17.21(±2.94).
In the second-last paragraph of Section 5 the correct minimum value for the flux ratio log (F mgii/F bol) should be stated as −5.2 rather than −8.2.
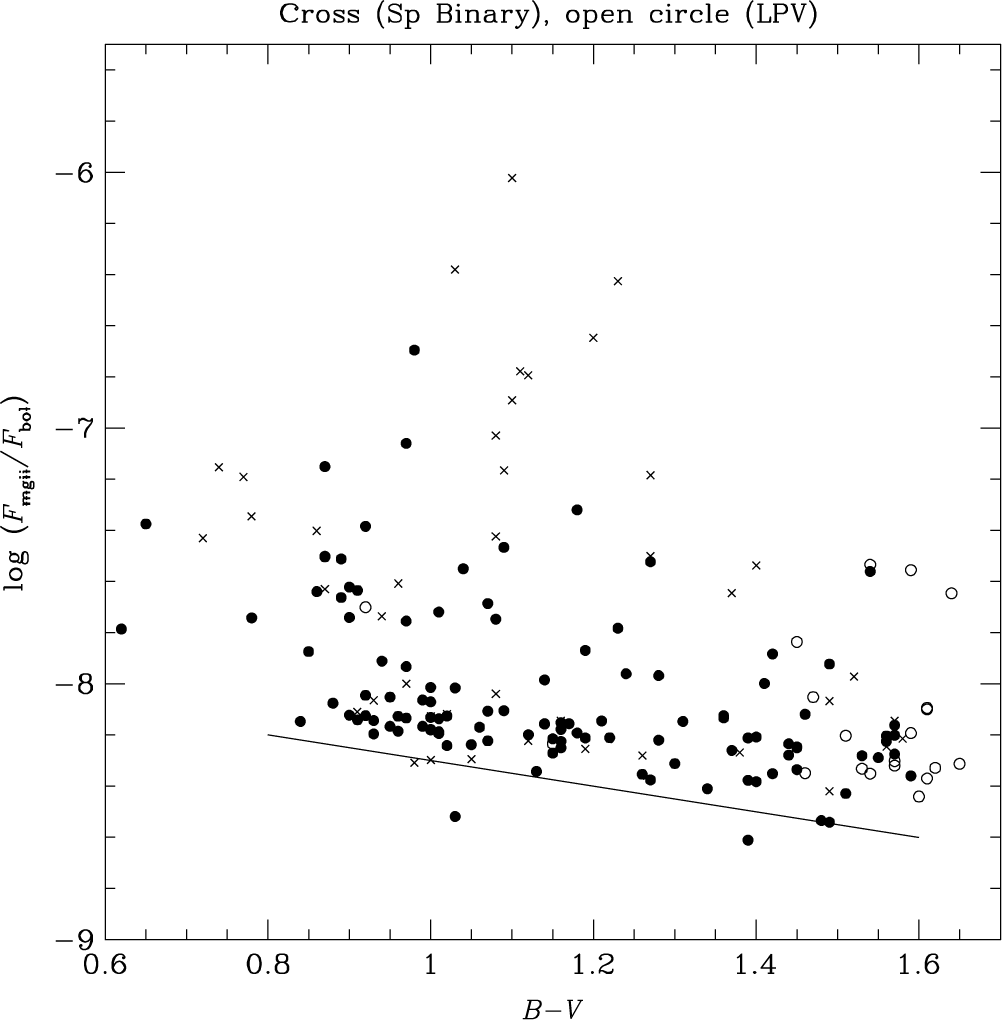
Figure 2. The normalised flux ratio log (F mgii/F bol) versus B–V colour for giant stars in the PM11 sample. There is a decrease in the mean flux ratio with increasing B–V, the solid line depicting an eye-estimate of the lower limit to this trend. Crosses and open circles denote spectroscopic binary and LPV stars, respectively.
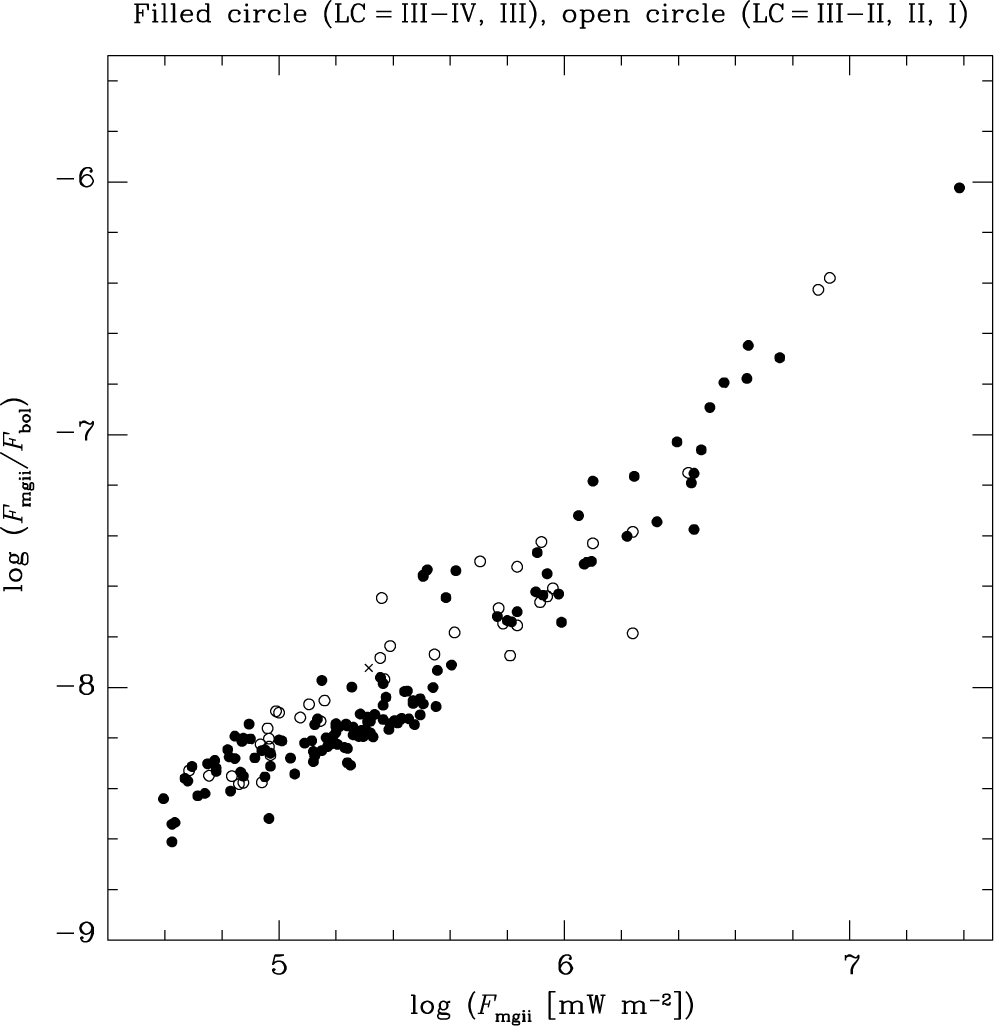
Figure 3. The normalised flux ratio log (F mgii/F bol) versus the surface flux of Mg II h and k emission for giant stars in the PM11 sample.
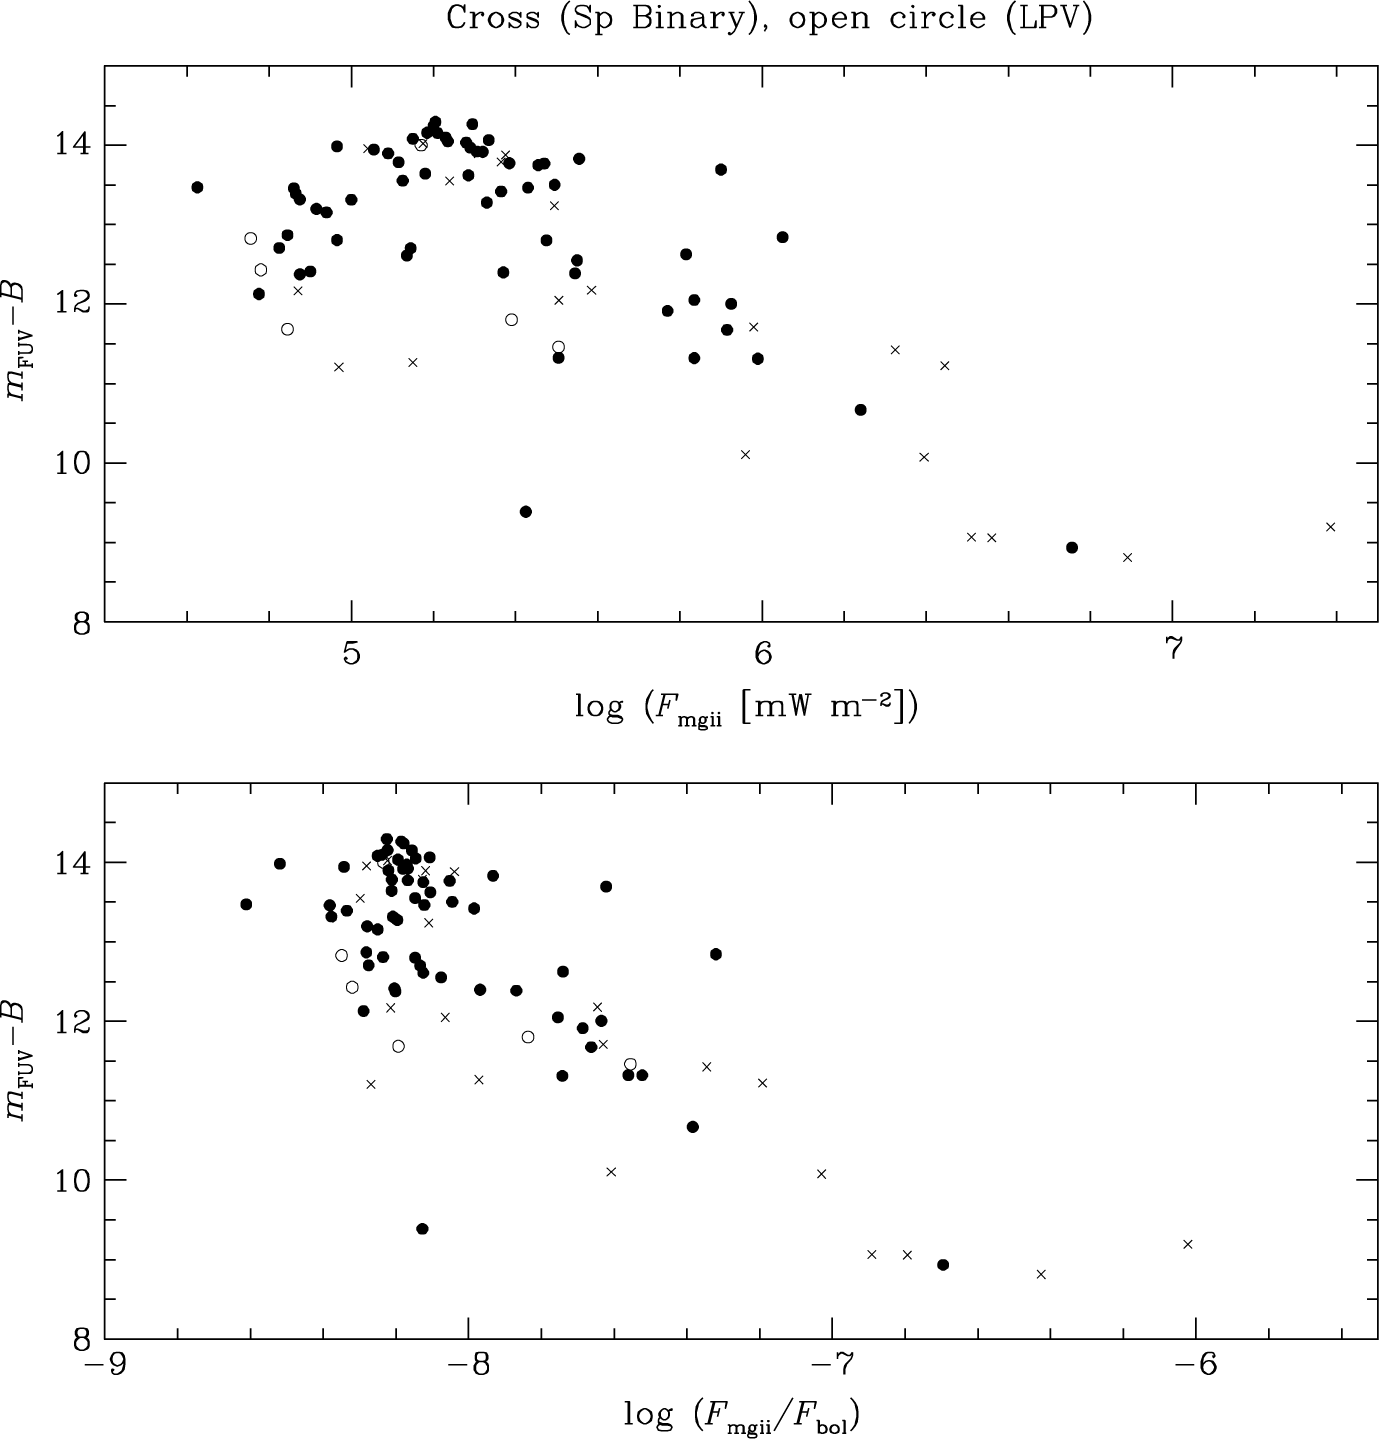
Figure 7. The (m FUV−B) colour of giant stars in the PM11 sample versus two measures of the surface flux of the Mg II h + k emission lines. In the top panel the surface flux in units of mW m−2 from the PM11 survey is plotted, whereas in the bottom panel the emission line flux has been scaled to the bolometric surface flux. Spectroscopic binaries and LPVs are depicted with crosses and open circles, respectively; all other stars are shown as filled circles.
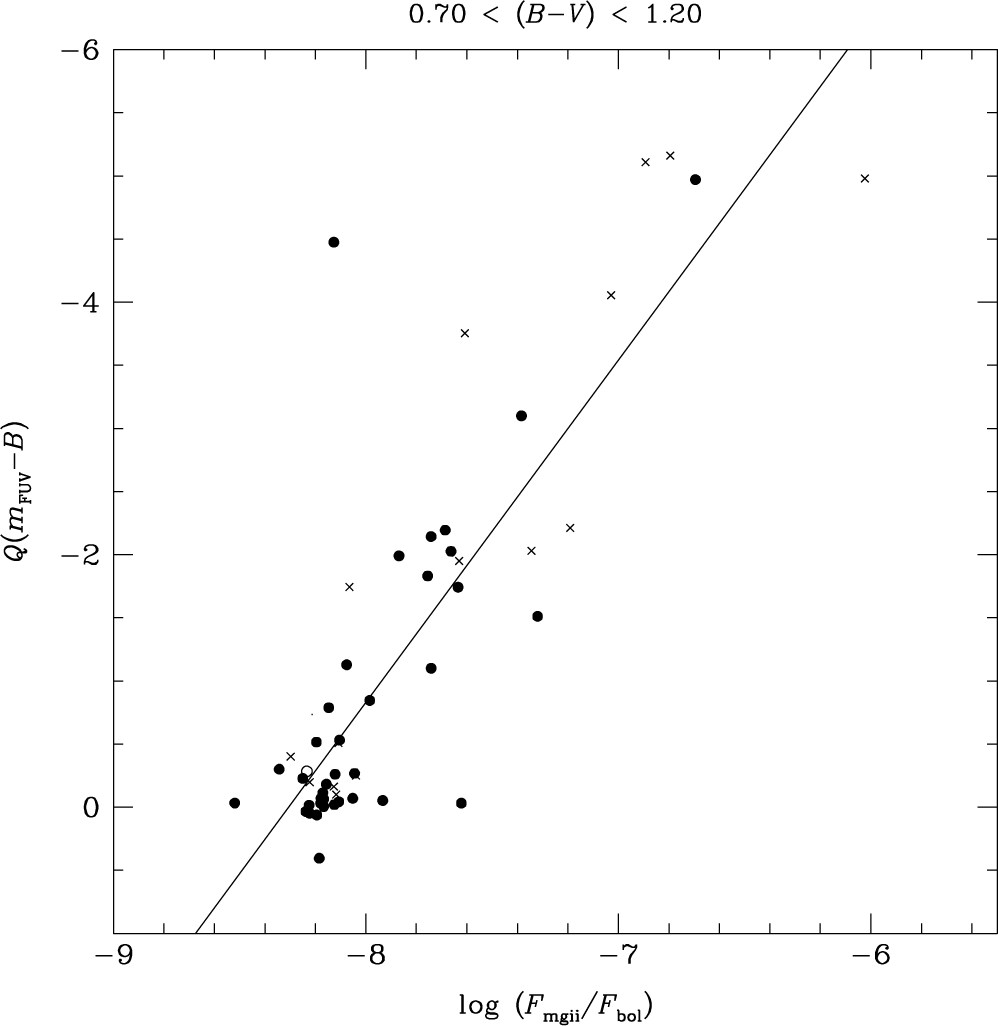
Figure 8. The FUV-excess parameter Q(m FUV−B) versus the normalised Mg II h + k flux, that is, log (F mgii/F bol), for giant stars in PM11 with colour in the range 0.70 < (B–V) < 1.20. Crosses and open circles denote spectroscopic binary and LPV stars, respectively. The solid line is a linear least-squares fit.
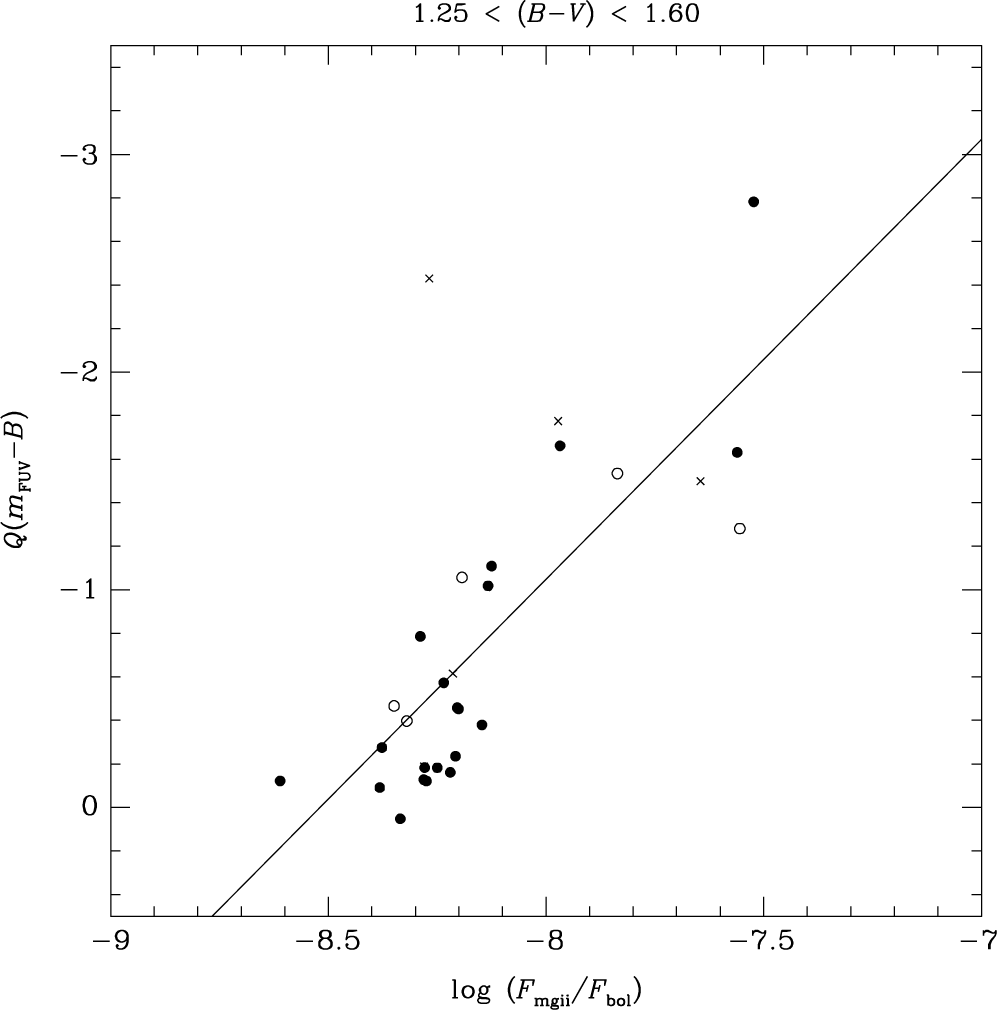
Figure 10. The FUV-excess parameter Q(m FUV−B) versus normalised Mg II h + k flux, that is, log (F mgii/F bol), for PM11 giants with colour in the range 1.25 < (B–V) < 1.60. Crosses and open circles denote spectroscopic binary and LPV stars, respectively. The linear least-squares fit corresponding to Equation (7) from the text is shown as a solid line.
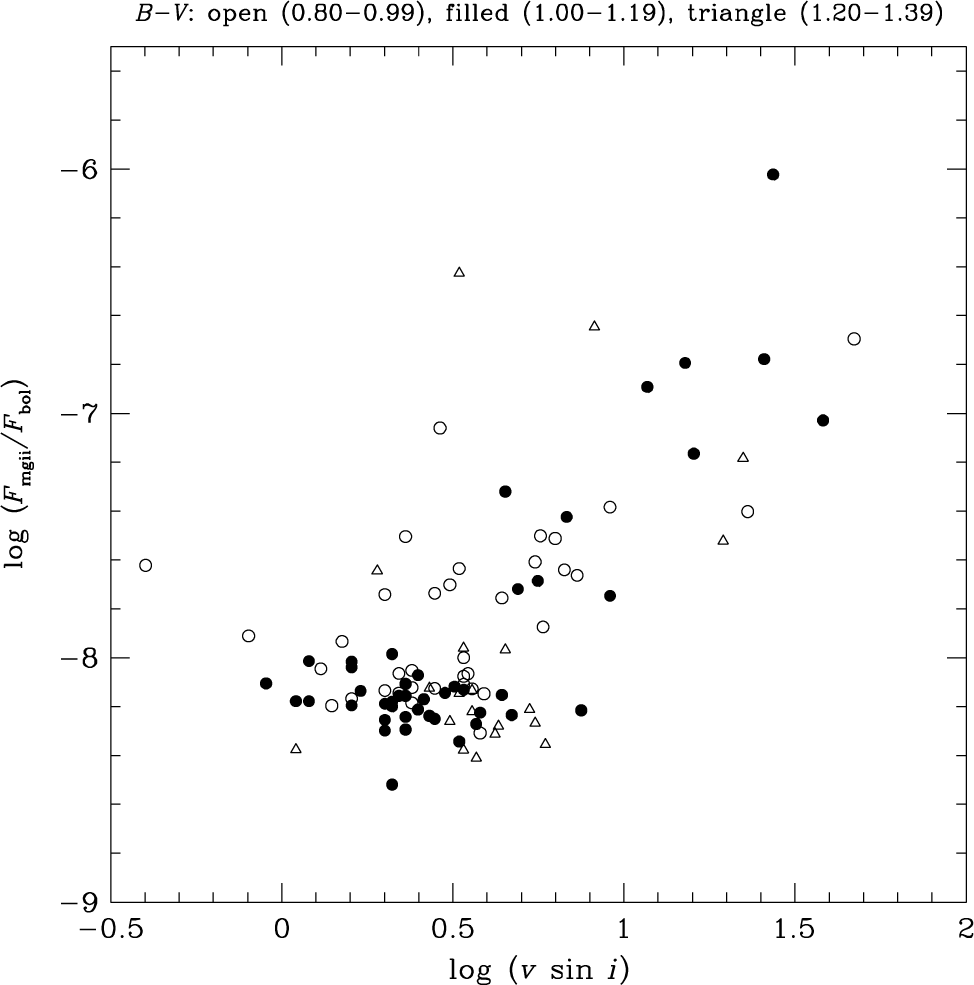
Figure 13. Normalised Mg II h + k flux, that is, log (F mgii/F bol), versus projected rotation speed (km s−1) for giant stars from PM11 with 0.80 ≤ (B–V) ≤ 1.39. Symbols denote different colour subranges: (open circles) 0.80 ≤ (B−V) ≤ 0.99; (filled circles) 1.00 ≤ (B−V) ≤ 1.19; (open triangles) 1.20 ≤ (B−V) ≤ 1.39.
Correctly labelled figures:
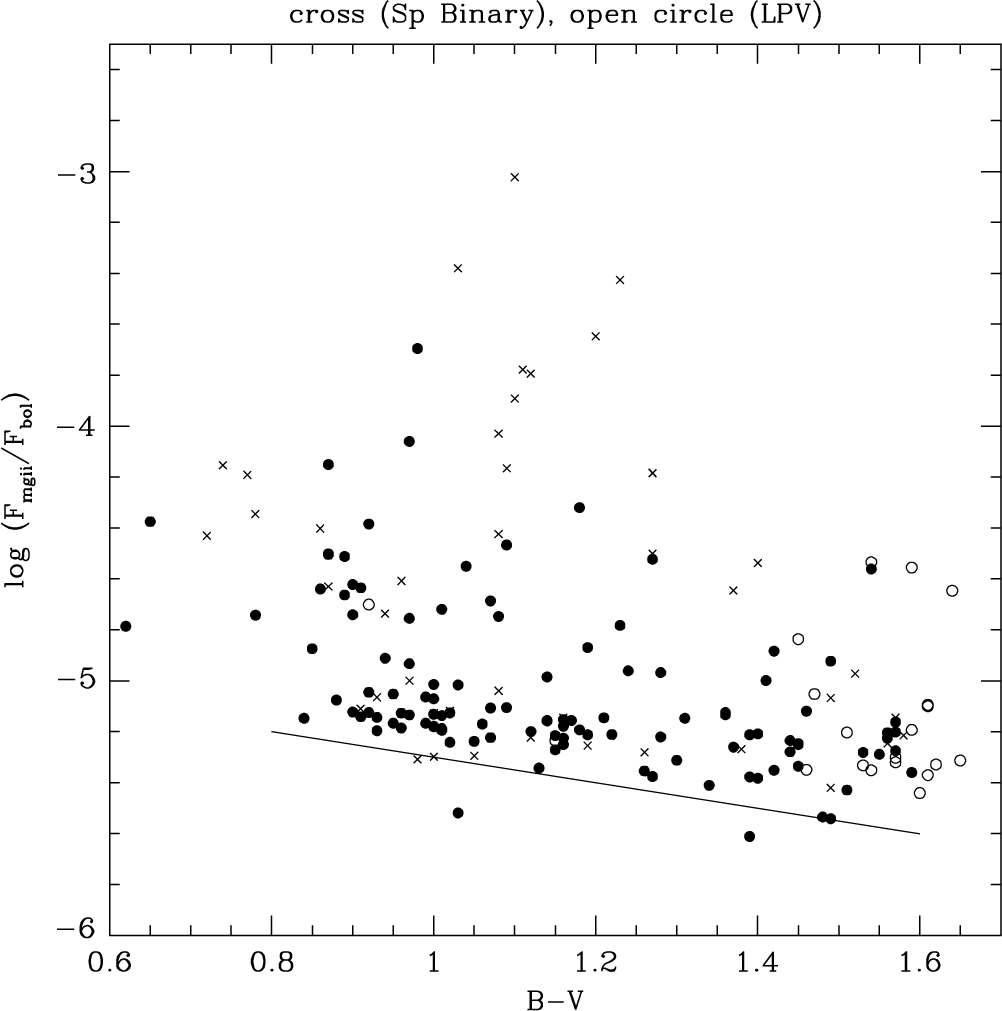
Figure 2. The normalised flux ratio log (F mgii/F bol) versus B–V colour for giant stars in the PM11 sample. There is a decrease in the mean flux ratio with increasing B–V, the solid line depicting an eye-estimate of the lower limit to this trend. Crosses and open circles denote spectroscopic binary and LPV stars, respectively.
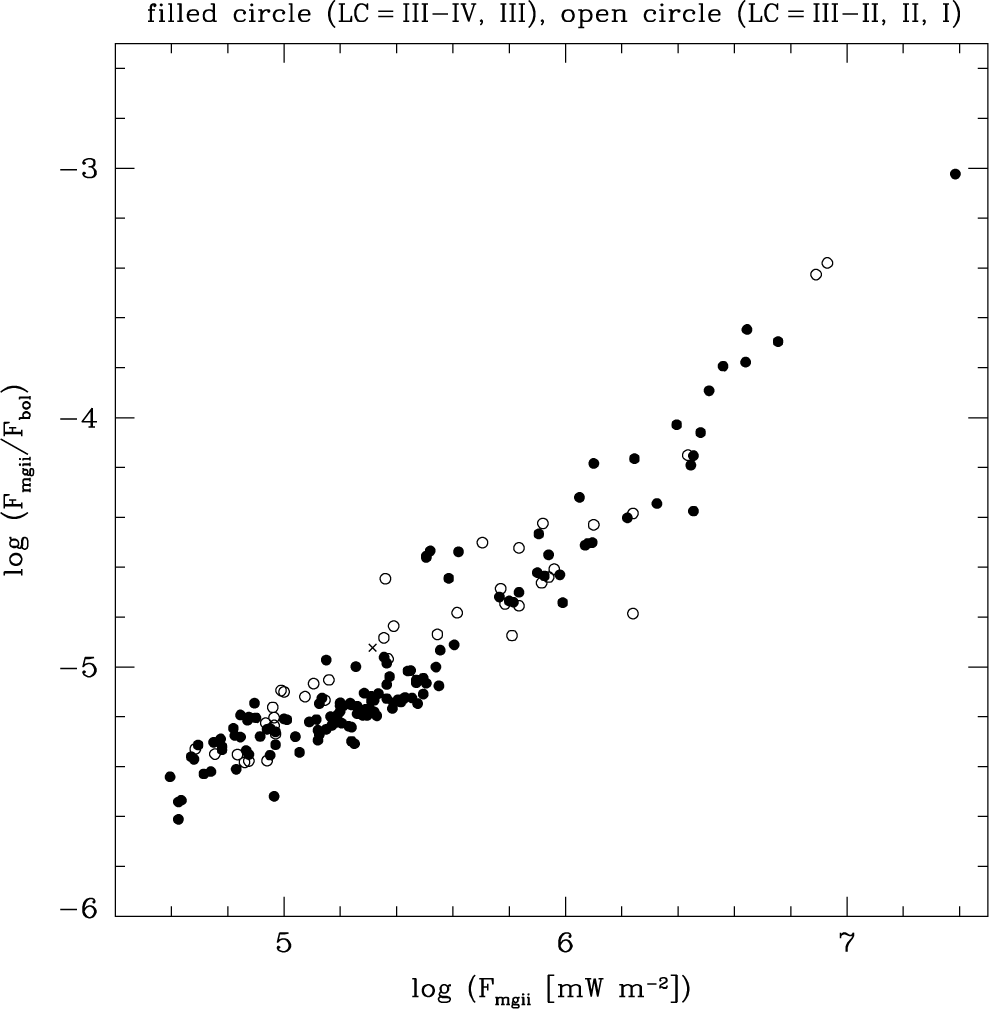
Figure 3. The normalised flux ratio log (F mgii/F bol) versus the surface flux of Mg II h and k emission for giant stars in the PM11 sample.
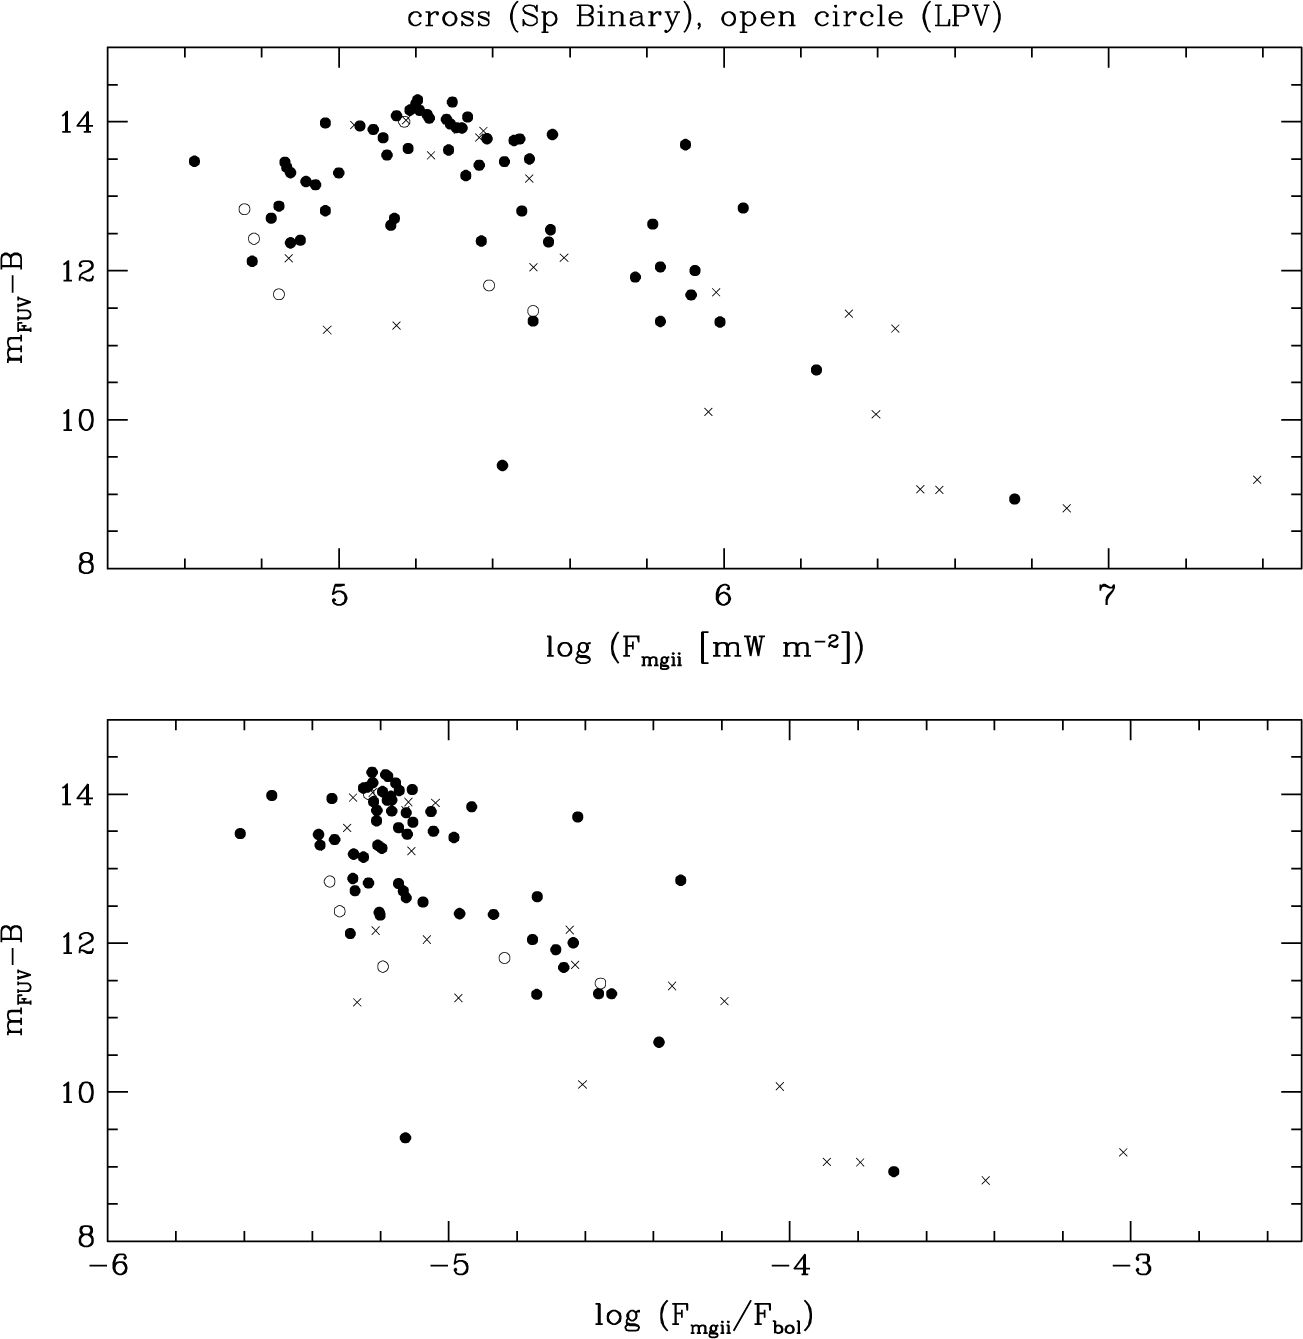
Figure 7. The (m FUV−B) colour of giant stars in the PM11 sample versus two measures of the surface flux of the Mg II h + k emission lines. In the top panel the surface flux in units of mW m−2 from the PM11 survey is plotted, whereas in the bottom panel the emission line flux has been scaled to the bolometric surface flux. Spectroscopic binaries and LPVs are depicted with crosses and open circles, respectively; all other stars are shown as filled circles.
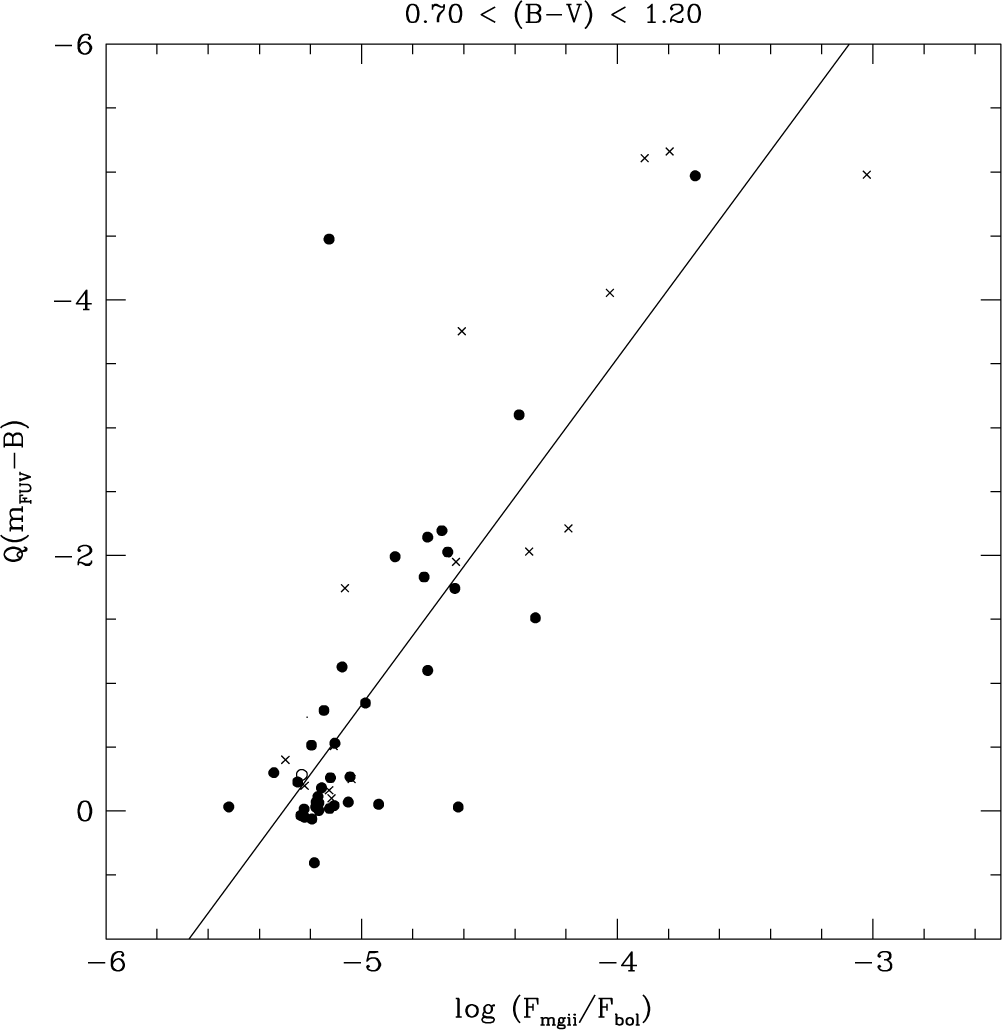
Figure 8. The FUV-excess parameter Q(m FUV−B) versus the normalised Mg II h + k flux, that is, log (F mgii/F bol), for giant stars in PM11 with colour in the range 0.70 < (B−V) < 1.20. Crosses and open circles denote spectroscopic binary and LPV stars, respectively. The solid line is a linear least-squares fit.
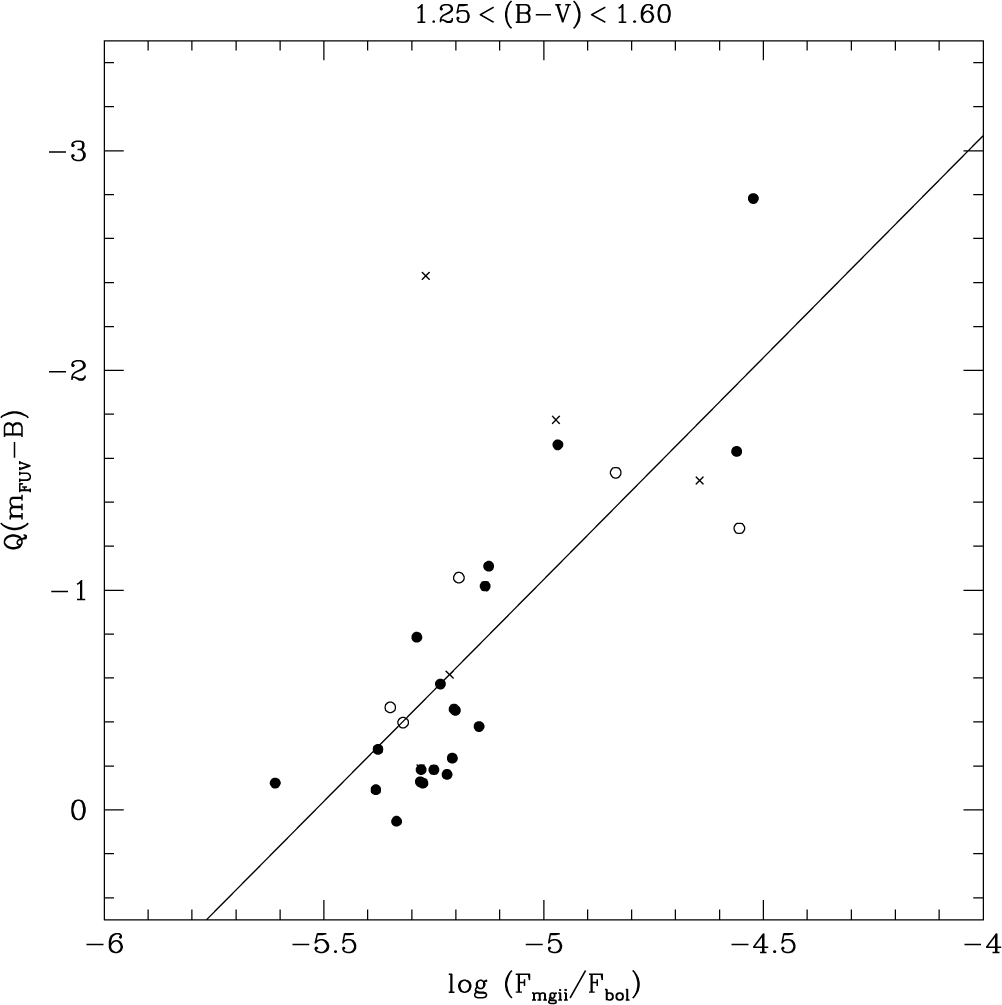
Figure 10. The FUV-excess parameter Q(m FUV−B) versus normalised Mg II h + k flux, that is, log (F mgii/F bol), for PM11 giants with colour in the range 1.25 < (B−V) < 1.60. Crosses and open circles denote spectroscopic binary and LPV stars, respectively. The linear least-squares fit corresponding to Equation (7) from the text is shown as a solid line.
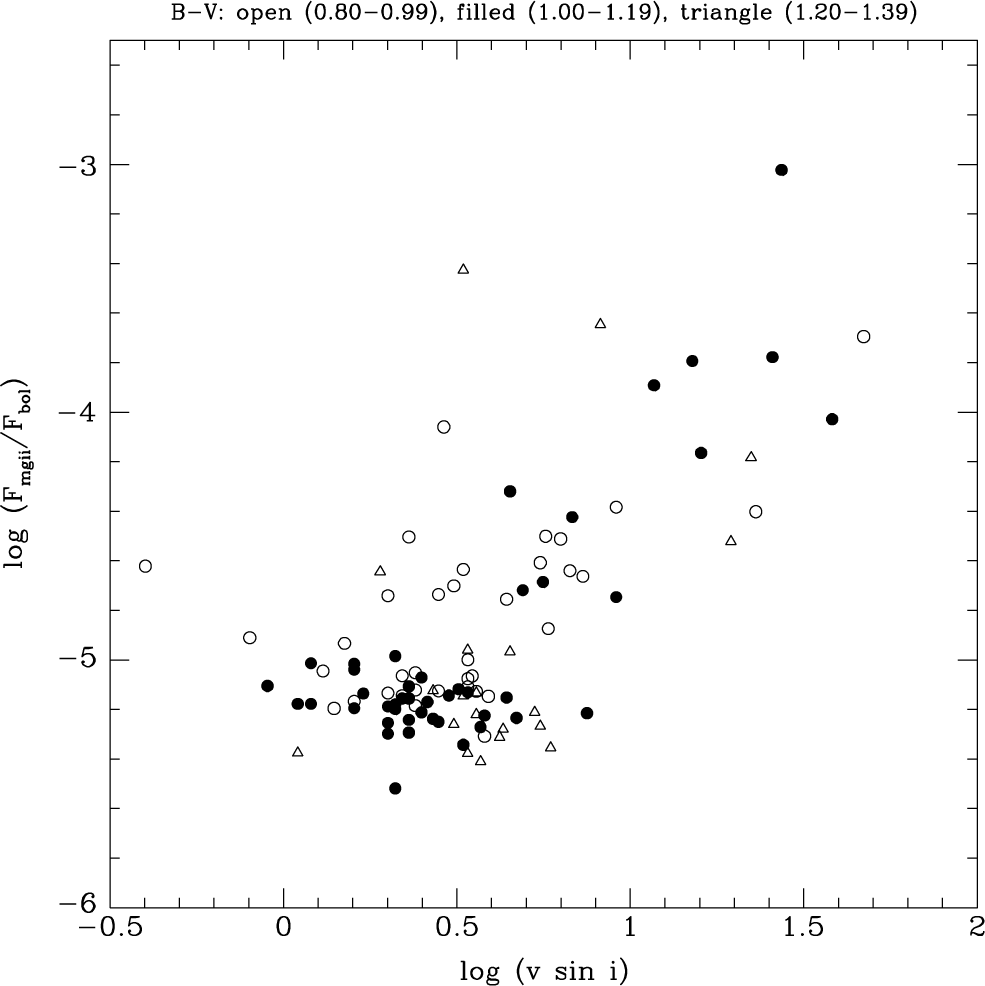
Figure 13. Normalised Mg II h + k flux, that is, log (F mgii/F bol), versus projected rotation speed (km s−1) for giant stars from PM11 with 0.80 ≤ (B−V) ≤ 1.39. Symbols denote different colour subranges: (open circles) 0.80 ≤ (B−V) ≤ 0.99; (filled circles) 1.00 ≤ (B−V) ≤ 1.19; (open triangles) 1.20 ≤ (B−V) ≤ 1.39.
No conclusions of the paper are changed by any of these corrections. The author apologizes for these errors.


