1 Introduction
Complex molecular interactions close to the vapour–liquid critical point of a substance are responsible for the highly non-ideal thermodynamic behaviour. In this thermodynamic region, fluids exhibit significant deviations from ideal-gas law behaviour and their properties can be utilized to increase productivity and efficiency of many technical processes. For instance, significant improvements of turbine efficiency can be achieved by using complex molecular fluids in organic Rankine cycles (Brown & Argrow Reference Brown and Argrow2000); injecting fuels at supercritical conditions can be employed to obtain higher efficiency of mixing and combustion in air breathing and liquid rocket engines (Wang & Yang Reference Wang and Yang2017); and power cycles operating with supercritical carbon dioxide offer the potential to drastically increase thermal efficiency to enable competitive utility scale renewable electricity production. Despite this fundamental importance both in science and industrial applications, flow instability and laminar-to-turbulent transition with fluids close to their vapour–liquid critical point still remain unexplored.
A large body of literature has been concerned with understanding and controlling transition with idealized fluids, such as incompressible and ideal-gas compressible shear flows. While compressibility significantly enriches the physics of flow transition (Fedorov Reference Fedorov2011; Zhong & Wang Reference Zhong and Wang2012), the interest in vehicles travelling at supersonic and hypersonic speeds has sparked research to unveil complex phenomena (high-temperature effects, shock waves, entropy layers, etc.) that influence the excitation and growth of instabilities and consequently transition to turbulence.
Early work on instability of ideal-gas compressible boundary layers started in the 1940s. In the same way as the Rayleigh criterion for incompressible flows states that the necessary condition for instability is the presence of an inflection in the velocity profile, Lees & Lin (Reference Lees and Lin1946) showed that in compressible flows the generalized inflection point is a necessary condition of an inviscid instability to occur. Mack (Reference Mack1984) showed that compressible boundary layers at high speeds reveal that there are higher modes that can be present in the boundary layer, which belong to the family of trapped acoustic waves. For the case of a laminar insulated boundary layer, it turns out that the first higher mode (Mack’s second mode) exceeds the growth rate of the first viscous mode around a free-stream Mach number of 4.
High-temperature chemical effects on boundary-layer stability and transition have been investigated since the 1990s, addressing the needs imposed by the re-entry of hypersonic vehicles. These effects, often referred to as real-gas effects, include vibrational excitation, dissociation and recombination of gas species, ionization, radiation and surface ablation. The instability of a Mach 10 boundary layer was introduced and discussed by Malik & Anderson (Reference Malik and Anderson1991). Based on linear stability analysis, these effects are shown to stabilize the first mode and destabilize Mack’s second mode. Subsequent studies had been extended to account for chemical and/or thermal non-equilibrium effects (Stuckert & Reed Reference Stuckert and Reed1994; Hudson, Chokani & Candler Reference Hudson, Chokani and Candler1997), different chemical reaction models (Lyttle & Reed Reference Lyttle and Reed2005; Franko, MacCormack & Lele Reference Franko, MacCormack and Lele2010), surface ablation effects (Mortensen & Zhong Reference Mortensen and Zhong2016) and coupling with roughness induced transition (Stemmer, Birrer & Adams Reference Stemmer, Birrer and Adams2017). Apart from earlier linear modal stability theory, parabolized stability equations (PSE) (Chang et al. Reference Chang, Vinh, Malik, Malik, Chang and Vinh1997; Johnson & Candler Reference Johnson and Candler1999; Malik Reference Malik2003) as well as direct numerical simulations (DNS) (Marxen et al. Reference Marxen, Magin, Shaqfeh and Iaccarino2013; Marxen, Iaccarino & Magin Reference Marxen, Iaccarino and Magin2014; Wang Reference Wang2017) have been developed and applied to understand the related transition mechanisms.
Apart from the high-temperature chemical effects, stratifications in thermodynamic or/and transport properties can substantially influence the stability (see review by Govindarajan & Sahu (Reference Govindarajan and Sahu2014), and references therein). These stratifications exist both naturally (e.g. in the Earth’s outer core) and artificially (e.g. exert wall heating/cooling), revealing some of the non-ideal-gas effects. The linear instabilities in parallel shear flows have received most of the attention so far. For example, plane Poiseuille flows can be markedly stabilized by decreasing wall viscosity (Sameen & Govindarajan Reference Sameen and Govindarajan2007). Plane Couette flows are known to be stable to modal instabilities at any Reynolds number. It has been recently confirmed that a vertical density stratification can drive the flow modally unstable at a moderate Reynolds number (Facchini et al. Reference Facchini, Favier, Le Gal, Wang and Le Bars2018).
When a fluid is operating near its thermodynamic critical point, strong property stratifications occur that must be modelled using complex equations of state. Supercritical fluid flows have received growing interests in various industrial applications (Brunner Reference Brunner2010) and recent studies have focused on characterizing turbulence and heat transfer. For example, Pecnik & Patel (Reference Pecnik and Patel2017) derived an alternative formulation of the turbulent kinetic energy equation using semi-local quantities. They showed that the semi-local scaling, as proposed by Huang, Coleman & Bradshaw (Reference Huang, Coleman and Bradshaw1995), can also be applied to conservation laws, such as the turbulent kinetic energy equation. Using this approach, it is then possible to quantify turbulence modulation related to density and viscosity stratifications using the semi-local Reynolds number. Kawai (Reference Kawai2016) performed the first DNS on supercritical turbulent boundary-layer flow with transcritical temperature, and showed that the turbulent mass flux terms in the turbulent kinetic energy equation largely exceed values as observed for ideal gas at the same free-stream Mach numbers. In terms of heat transfer, as concluded in a recent review (Pizzarelli Reference Pizzarelli2018), future applications are still limited by the poor understanding and prediction of heat transfer deterioration in supercritical fluids. The linear stability of flows with such highly non-ideal fluids has only been considered recently by Ren, Fu & Pecnik (Reference Ren, Fu and Pecnik2019) for plane Poiseuille flows. It was found that compared to ideal gases at the same conditions, the non-ideal gas can become more stable/unstable, or even inviscid unstable in different thermodynamic regimes.
This study aims to investigate the stability of boundary-layer flows with fluids close to the critical point, through linear stability theory (LST), DNS and inviscid analysis. To account for the full non-ideal-gas effects, one must take the non-ideal equation of state into consideration as well as the complicated functions of thermodynamic/transport properties in terms of the thermodynamic state, which can be determined by two independent thermodynamic quantities (temperature, density, pressure etc.). We study boundary-layer flows with carbon dioxide (
![]() $\text{CO}_{2}$
) at a constant pressure of 80 bar, which is above the critical pressure (73.9 bar). The flow conditions are such chosen that different thermodynamic regimes of interests shall be well revealed. In § 2, the formulation of the base flow and stability analysis as well as the related numerical methods are introduced. The cases investigated and discussions on the base flow are provided in § 3, followed by the linear stability analysis, direct numerical simulation and inviscid analysis in § 4. The study is concluded in § 5.
$\text{CO}_{2}$
) at a constant pressure of 80 bar, which is above the critical pressure (73.9 bar). The flow conditions are such chosen that different thermodynamic regimes of interests shall be well revealed. In § 2, the formulation of the base flow and stability analysis as well as the related numerical methods are introduced. The cases investigated and discussions on the base flow are provided in § 3, followed by the linear stability analysis, direct numerical simulation and inviscid analysis in § 4. The study is concluded in § 5.
2 Formulation and numerical details
2.1 Flow conservation equations
The laws of conservation of mass, momentum and energy (known as the Navier–Stokes equations), in differential and dimensionless form, are
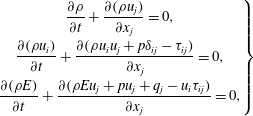 $$\begin{eqnarray}\left.\begin{array}{@{}c@{}}\displaystyle \frac{\unicode[STIX]{x2202}\unicode[STIX]{x1D70C}}{\unicode[STIX]{x2202}t}+\frac{\unicode[STIX]{x2202}(\unicode[STIX]{x1D70C}u_{j})}{\unicode[STIX]{x2202}x_{j}}=0,\\ \displaystyle \frac{\unicode[STIX]{x2202}(\unicode[STIX]{x1D70C}u_{i})}{\unicode[STIX]{x2202}t}+\frac{\unicode[STIX]{x2202}(\unicode[STIX]{x1D70C}u_{i}u_{j}+p\unicode[STIX]{x1D6FF}_{ij}-\unicode[STIX]{x1D70F}_{ij})}{\unicode[STIX]{x2202}x_{j}}=0,\\ \displaystyle \frac{\unicode[STIX]{x2202}(\unicode[STIX]{x1D70C}E)}{\unicode[STIX]{x2202}t}+\frac{\unicode[STIX]{x2202}(\unicode[STIX]{x1D70C}Eu_{j}+pu_{j}+q_{j}-u_{i}\unicode[STIX]{x1D70F}_{ij})}{\unicode[STIX]{x2202}x_{j}}=0,\end{array}\right\}\end{eqnarray}$$
where
![]() $x_{i}=(x,y,z)$
are the coordinates in the streamwise, wall-normal and spanwise directions,
$x_{i}=(x,y,z)$
are the coordinates in the streamwise, wall-normal and spanwise directions,
![]() $u_{i}=(u,v,w)$
are the corresponding velocity components,
$u_{i}=(u,v,w)$
are the corresponding velocity components,
![]() $t$
the time,
$t$
the time,
![]() $\unicode[STIX]{x1D70C}$
the fluid density,
$\unicode[STIX]{x1D70C}$
the fluid density,
![]() $E=e+u_{i}u_{i}/2$
the total energy,
$E=e+u_{i}u_{i}/2$
the total energy,
![]() $e$
the internal energy and
$e$
the internal energy and
![]() $p$
is the pressure. The viscous stress tensor,
$p$
is the pressure. The viscous stress tensor,
![]() $\unicode[STIX]{x1D70F}_{ij}$
, and the heat flux vector,
$\unicode[STIX]{x1D70F}_{ij}$
, and the heat flux vector,
![]() $q_{j}$
, are given by
$q_{j}$
, are given by
 $$\begin{eqnarray}\left.\begin{array}{@{}c@{}}\displaystyle \unicode[STIX]{x1D70F}_{ij}=\frac{\unicode[STIX]{x1D707}}{\mathit{Re }_{\infty }}\left(\frac{\unicode[STIX]{x2202}u_{i}}{\unicode[STIX]{x2202}x_{j}}+\frac{\unicode[STIX]{x2202}u_{j}}{\unicode[STIX]{x2202}x_{i}}\right)+\frac{\unicode[STIX]{x1D706}}{\mathit{Re }_{\infty }}\unicode[STIX]{x1D6FF}_{ij}\frac{\unicode[STIX]{x2202}u_{k}}{\unicode[STIX]{x2202}x_{k}},\\ \displaystyle q_{j}=-\frac{\unicode[STIX]{x1D705}}{\mathit{Re }_{\infty }\mathit{Pr}_{\infty }\mathit{Ec}_{\infty }}\frac{\unicode[STIX]{x2202}T}{\unicode[STIX]{x2202}x_{j}}.\end{array}\right\}\end{eqnarray}$$
Here
![]() $\unicode[STIX]{x1D707}$
is the dynamic viscosity,
$\unicode[STIX]{x1D707}$
is the dynamic viscosity,
![]() $\unicode[STIX]{x1D706}=\unicode[STIX]{x1D707}_{b}-2/3\unicode[STIX]{x1D707}$
the second viscosity,
$\unicode[STIX]{x1D706}=\unicode[STIX]{x1D707}_{b}-2/3\unicode[STIX]{x1D707}$
the second viscosity,
![]() $\unicode[STIX]{x1D707}_{b}$
the bulk viscosity and
$\unicode[STIX]{x1D707}_{b}$
the bulk viscosity and
![]() $\unicode[STIX]{x1D705}$
is the thermal conductivity. It is known that
$\unicode[STIX]{x1D705}$
is the thermal conductivity. It is known that
![]() $\unicode[STIX]{x1D707}_{b}$
has a very limited effect on the linear stability of channel flows (Ren et al.
Reference Ren, Fu and Pecnik2019). Results presented in the following sections are subjected to
$\unicode[STIX]{x1D707}_{b}$
has a very limited effect on the linear stability of channel flows (Ren et al.
Reference Ren, Fu and Pecnik2019). Results presented in the following sections are subjected to
![]() $\unicode[STIX]{x1D707}_{b}=0$
. An additional assumption is that buoyancy effects are not considered. The equations above have been non-dimensionalized by reference values, as follows
$\unicode[STIX]{x1D707}_{b}=0$
. An additional assumption is that buoyancy effects are not considered. The equations above have been non-dimensionalized by reference values, as follows
 $$\begin{eqnarray}\left.\begin{array}{@{}c@{}}u={\displaystyle \frac{u^{\ast }}{u_{\infty }^{\ast }}},\quad x_{i}={\displaystyle \frac{x_{i}^{\ast }}{l_{0}^{\ast }}},\quad t={\displaystyle \frac{t^{\ast }u_{\infty }^{\ast }}{l_{0}^{\ast }}},\quad p={\displaystyle \frac{p^{\ast }}{\unicode[STIX]{x1D70C}_{\infty }^{\ast }u_{\infty }^{\ast 2}}},\quad \unicode[STIX]{x1D70C}={\displaystyle \frac{\unicode[STIX]{x1D70C}^{\ast }}{\unicode[STIX]{x1D70C}_{\infty }^{\ast }}},\\ T={\displaystyle \frac{T^{\ast }}{T_{\infty }^{\ast }}},\quad E={\displaystyle \frac{E^{\ast }}{u_{\infty }^{\ast 2}}},\quad \unicode[STIX]{x1D707}={\displaystyle \frac{\unicode[STIX]{x1D707}^{\ast }}{\unicode[STIX]{x1D707}_{\infty }^{\ast }}},\quad \unicode[STIX]{x1D705}={\displaystyle \frac{\unicode[STIX]{x1D705}^{\ast }}{\unicode[STIX]{x1D705}_{\infty }^{\ast }}},\end{array}\right\}\end{eqnarray}$$
which leads to the definition of the Reynolds number,
![]() $\mathit{Re}_{\infty }$
, Prandtl number,
$\mathit{Re}_{\infty }$
, Prandtl number,
![]() $\mathit{Pr}_{\infty }$
, Eckert number,
$\mathit{Pr}_{\infty }$
, Eckert number,
![]() $\mathit{Ec}_{\infty }$
, and the Mach number,
$\mathit{Ec}_{\infty }$
, and the Mach number,
![]() $\mathit{Ma}_{\infty }$
(all based on free-stream parameters)
$\mathit{Ma}_{\infty }$
(all based on free-stream parameters)
The subscript
![]() $\infty$
denotes free-stream values, superscript
$\infty$
denotes free-stream values, superscript
![]() $\ast$
stands for dimensional variables,
$\ast$
stands for dimensional variables,
![]() $l_{0}^{\ast }$
is a chosen length scale,
$l_{0}^{\ast }$
is a chosen length scale,
![]() $a_{\infty }^{\ast }$
is the speed of sound in the free stream. Note that for an ideal gas
$a_{\infty }^{\ast }$
is the speed of sound in the free stream. Note that for an ideal gas
![]() $\mathit{Ec}_{\infty }=(\unicode[STIX]{x1D6FE}-1)\mathit{Ma}_{\infty }^{2}$
, where
$\mathit{Ec}_{\infty }=(\unicode[STIX]{x1D6FE}-1)\mathit{Ma}_{\infty }^{2}$
, where
![]() $\unicode[STIX]{x1D6FE}$
is the heat capacity ratio. In linear stability theory,
$\unicode[STIX]{x1D6FE}$
is the heat capacity ratio. In linear stability theory,
![]() $l_{0}^{\ast }$
is chosen to be the local boundary-layer thickness scale
$l_{0}^{\ast }$
is chosen to be the local boundary-layer thickness scale
![]() $\unicode[STIX]{x1D6FF}^{\ast }$
, which results in the definition of
$\unicode[STIX]{x1D6FF}^{\ast }$
, which results in the definition of
![]() $\mathit{Re}_{\unicode[STIX]{x1D6FF}}$
,
$\mathit{Re}_{\unicode[STIX]{x1D6FF}}$
,
Here,
![]() $\unicode[STIX]{x1D6FF}^{\ast }$
measures the order of boundary-layer thickness over a flat plate. For example, applying the Blasius solution, the displacement thickness
$\unicode[STIX]{x1D6FF}^{\ast }$
measures the order of boundary-layer thickness over a flat plate. For example, applying the Blasius solution, the displacement thickness
![]() $\unicode[STIX]{x1D6FF}_{1}^{\ast }\approx 1.721\unicode[STIX]{x1D6FF}^{\ast }$
, momentum thickness
$\unicode[STIX]{x1D6FF}_{1}^{\ast }\approx 1.721\unicode[STIX]{x1D6FF}^{\ast }$
, momentum thickness
![]() $\unicode[STIX]{x1D6FF}_{2}^{\ast }\approx 0.664\unicode[STIX]{x1D6FF}^{\ast }$
(Schlichting & Gersten Reference Schlichting and Gersten2017).
$\unicode[STIX]{x1D6FF}_{2}^{\ast }\approx 0.664\unicode[STIX]{x1D6FF}^{\ast }$
(Schlichting & Gersten Reference Schlichting and Gersten2017).
2.2 The laminar base flow
The self-similar solution to the boundary-layer equation over a flat plate is employed in this work. It serves as the base flow for the stability analysis as well as for the initial state of the DNS. Applying the boundary-layer assumption and a routine order-of-magnitude analysis of the dimensional Navier–Stokes (N–S) equations, the boundary-layer equations read,
 $$\begin{eqnarray}\left.\begin{array}{@{}c@{}}{\displaystyle \frac{\unicode[STIX]{x2202}(\unicode[STIX]{x1D70C}^{\ast }u^{\ast })}{\unicode[STIX]{x2202}x^{\ast }}}+{\displaystyle \frac{\unicode[STIX]{x2202}(\unicode[STIX]{x1D70C}^{\ast }v^{\ast })}{\unicode[STIX]{x2202}y^{\ast }}}=0,\\ \unicode[STIX]{x1D70C}^{\ast }u^{\ast }{\displaystyle \frac{\unicode[STIX]{x2202}u^{\ast }}{\unicode[STIX]{x2202}x^{\ast }}}+\unicode[STIX]{x1D70C}^{\ast }v^{\ast }{\displaystyle \frac{\unicode[STIX]{x2202}u^{\ast }}{\unicode[STIX]{x2202}y^{\ast }}}+{\displaystyle \frac{\text{d}p_{\infty }^{\ast }}{\text{d}x^{\ast }}}-{\displaystyle \frac{\unicode[STIX]{x2202}}{\unicode[STIX]{x2202}y^{\ast }}}\left(\unicode[STIX]{x1D707}^{\ast }{\displaystyle \frac{\unicode[STIX]{x2202}u^{\ast }}{\unicode[STIX]{x2202}y^{\ast }}}\right)=0,\\ \unicode[STIX]{x1D70C}^{\ast }u^{\ast }{\displaystyle \frac{\unicode[STIX]{x2202}h^{\ast }}{\unicode[STIX]{x2202}x^{\ast }}}+\unicode[STIX]{x1D70C}^{\ast }v^{\ast }{\displaystyle \frac{\unicode[STIX]{x2202}h^{\ast }}{\unicode[STIX]{x2202}y^{\ast }}}-u^{\ast }{\displaystyle \frac{\text{d}p_{\infty }^{\ast }}{\text{d}x^{\ast }}}-{\displaystyle \frac{\unicode[STIX]{x2202}}{\unicode[STIX]{x2202}y^{\ast }}}\left(\unicode[STIX]{x1D705}^{\ast }{\displaystyle \frac{\unicode[STIX]{x2202}T^{\ast }}{\unicode[STIX]{x2202}y^{\ast }}}\right)-\unicode[STIX]{x1D707}^{\ast }\left({\displaystyle \frac{\unicode[STIX]{x2202}u^{\ast }}{\unicode[STIX]{x2202}y^{\ast }}}\right)^{2}=0.\end{array}\right\}\end{eqnarray}$$
Introducing the Lees–Dorodnitsyn transformation (see introduction in Anderson Jr Reference Anderson2000; Schlichting & Gersten Reference Schlichting and Gersten2017)
 $$\begin{eqnarray}\left.\begin{array}{@{}c@{}}\text{d}\unicode[STIX]{x1D709}=\unicode[STIX]{x1D70C}_{\infty }^{\ast }\unicode[STIX]{x1D707}_{\infty }^{\ast }u_{\infty }^{\ast }\,\text{d}x^{\ast },\\ \text{d}\unicode[STIX]{x1D702}={\displaystyle \frac{\unicode[STIX]{x1D70C}^{\ast }u_{\infty }^{\ast }}{\sqrt{2\unicode[STIX]{x1D709}}}}\,\text{d}y^{\ast },\end{array}\right\}\end{eqnarray}$$
for the boundary-layer equations, yields the transformed ordinary differential equations (ODE) for
![]() $f$
and
$f$
and
![]() $g$
given as,
$g$
given as,
 $$\begin{eqnarray}\left.\begin{array}{@{}c@{}}{\displaystyle \frac{\text{d}}{\text{d}\unicode[STIX]{x1D702}}}\left(C_{l}{\displaystyle \frac{\text{d}^{2}f}{\text{d}\unicode[STIX]{x1D702}^{2}}}\right)+f{\displaystyle \frac{\text{d}^{2}f}{\text{d}\unicode[STIX]{x1D702}^{2}}}=0,\\ {\displaystyle \frac{\text{d}}{\text{d}\unicode[STIX]{x1D702}}}\left({\displaystyle \frac{C_{l}}{\mathit{Pr}_{l}}}{\displaystyle \frac{\text{d}g}{\text{d}\unicode[STIX]{x1D702}}}\right)+f{\displaystyle \frac{\text{d}g}{\text{d}\unicode[STIX]{x1D702}}}+C_{l}{\displaystyle \frac{u_{\infty }^{\ast 2}}{h_{t\infty }^{\ast }}}\left({\displaystyle \frac{\text{d}^{2}f}{\text{d}\unicode[STIX]{x1D702}^{2}}}\right)^{2}=0,\end{array}\right\}\end{eqnarray}$$
where
Here,
![]() $f$
and
$f$
and
![]() $g$
are unary functions of the transformed coordinate
$g$
are unary functions of the transformed coordinate
![]() $\unicode[STIX]{x1D702}$
, while
$\unicode[STIX]{x1D702}$
, while
![]() $h_{t}$
denotes the total enthalpy. The above ODEs are numerically integrated using the fourth-order Runge–Kutta scheme subjected to adiabatic wall boundary conditions. During the integration process, a one-dimensional (1-D) look-up table (see appendix A) is used to calculate
$h_{t}$
denotes the total enthalpy. The above ODEs are numerically integrated using the fourth-order Runge–Kutta scheme subjected to adiabatic wall boundary conditions. During the integration process, a one-dimensional (1-D) look-up table (see appendix A) is used to calculate
![]() $C_{l}$
and
$C_{l}$
and
![]() $\mathit{Pr}_{l}$
from the static temperature that can be obtained from the total enthalpy
$\mathit{Pr}_{l}$
from the static temperature that can be obtained from the total enthalpy
![]() $g$
.
$g$
.
2.3 Linear stability theory
The linear stability equations for the non-ideal gas have been derived and documented in Ren et al. (Reference Ren, Fu and Pecnik2019). It is known that for simple compressible systems (e.g. single phase, pure substances and uniform mixtures of non-reacting gases), the thermodynamic state is defined by two independent thermodynamic properties. We choose
![]() $\unicode[STIX]{x1D70C}$
and
$\unicode[STIX]{x1D70C}$
and
![]() $T$
as the two independent thermodynamic quantities, while the remaining thermodynamic and transport properties (e.g.
$T$
as the two independent thermodynamic quantities, while the remaining thermodynamic and transport properties (e.g.
![]() $E$
,
$E$
,
![]() $p$
,
$p$
,
![]() $\unicode[STIX]{x1D707}$
,
$\unicode[STIX]{x1D707}$
,
![]() $\unicode[STIX]{x1D705}$
) are determined as functions of
$\unicode[STIX]{x1D705}$
) are determined as functions of
![]() $\unicode[STIX]{x1D70C}$
and
$\unicode[STIX]{x1D70C}$
and
![]() $T$
. For example, the viscosity perturbation is given by the two-dimensional Taylor expansion,
$T$
. For example, the viscosity perturbation is given by the two-dimensional Taylor expansion,
 $$\begin{eqnarray}\displaystyle \unicode[STIX]{x1D707}^{\prime } & = & \displaystyle \left.{\displaystyle \frac{\unicode[STIX]{x2202}\unicode[STIX]{x1D707}_{0}}{\unicode[STIX]{x2202}\unicode[STIX]{x1D70C}_{0}}}\right|_{T}\unicode[STIX]{x1D70C}^{\prime }+\left.{\displaystyle \frac{\unicode[STIX]{x2202}\unicode[STIX]{x1D707}_{0}}{\unicode[STIX]{x2202}T_{0}}}\right|_{\unicode[STIX]{x1D70C}}T^{\prime }+{\displaystyle \frac{1}{2}}\left(\!\left.{\displaystyle \frac{\unicode[STIX]{x2202}^{2}\unicode[STIX]{x1D707}_{0}}{\unicode[STIX]{x2202}\unicode[STIX]{x1D70C}_{0}^{2}}}\right|_{T}\unicode[STIX]{x1D70C}^{\prime }\unicode[STIX]{x1D70C}^{\prime }+2\left.{\displaystyle \frac{\unicode[STIX]{x2202}}{\unicode[STIX]{x2202}T_{0}}}\right|_{\unicode[STIX]{x1D70C}}\left.{\displaystyle \frac{\unicode[STIX]{x2202}\unicode[STIX]{x1D707}_{0}}{\unicode[STIX]{x2202}\unicode[STIX]{x1D70C}_{0}}}\right|_{T}\unicode[STIX]{x1D70C}^{\prime }T^{\prime }+\left.{\displaystyle \frac{\unicode[STIX]{x2202}^{2}\unicode[STIX]{x1D707}_{0}}{\unicode[STIX]{x2202}T_{0}^{2}}}\right|_{\unicode[STIX]{x1D70C}}T^{\prime }T^{\prime }\right)\nonumber\\ \displaystyle & & \displaystyle +\,\cdots \,.\end{eqnarray}$$
It can be seen that in non-ideal-gas flows, the viscosity perturbation is dependent on
![]() $\unicode[STIX]{x2202}\unicode[STIX]{x1D707}_{0}/\unicode[STIX]{x2202}\unicode[STIX]{x1D70C}_{0}$
(at constant
$\unicode[STIX]{x2202}\unicode[STIX]{x1D707}_{0}/\unicode[STIX]{x2202}\unicode[STIX]{x1D70C}_{0}$
(at constant
![]() $T$
), which is not accounted for in the conventional empirical viscosity laws of an ideal gas (e.g. Sutherland’s law and power law). The full stability equation is derived by introducing small perturbations into the N–S equations (2.1) and subtracting the governing equations of the base flow. With the nonlinear terms neglected, the linear stability equations are formulated as
$T$
), which is not accounted for in the conventional empirical viscosity laws of an ideal gas (e.g. Sutherland’s law and power law). The full stability equation is derived by introducing small perturbations into the N–S equations (2.1) and subtracting the governing equations of the base flow. With the nonlinear terms neglected, the linear stability equations are formulated as
 $$\begin{eqnarray}\displaystyle & & \displaystyle \unicode[STIX]{x1D647}_{\unicode[STIX]{x1D669}}{\displaystyle \frac{\unicode[STIX]{x2202}\boldsymbol{q}}{\unicode[STIX]{x2202}t}}+\unicode[STIX]{x1D647}_{\unicode[STIX]{x1D66D}}{\displaystyle \frac{\unicode[STIX]{x2202}\boldsymbol{q}}{\unicode[STIX]{x2202}x}}+\unicode[STIX]{x1D647}_{\unicode[STIX]{x1D66E}}{\displaystyle \frac{\unicode[STIX]{x2202}\boldsymbol{q}}{\unicode[STIX]{x2202}y}}+\unicode[STIX]{x1D647}_{\unicode[STIX]{x1D66F}}{\displaystyle \frac{\unicode[STIX]{x2202}\boldsymbol{q}}{\unicode[STIX]{x2202}z}}+\unicode[STIX]{x1D647}_{\unicode[STIX]{x1D666}}\boldsymbol{q}\nonumber\\ \displaystyle & & \displaystyle \quad +\,\unicode[STIX]{x1D651}_{\unicode[STIX]{x1D66D}\unicode[STIX]{x1D66D}}{\displaystyle \frac{\unicode[STIX]{x2202}^{2}\boldsymbol{q}}{\unicode[STIX]{x2202}x^{2}}}+\unicode[STIX]{x1D651}_{\unicode[STIX]{x1D66D}\unicode[STIX]{x1D66E}}{\displaystyle \frac{\unicode[STIX]{x2202}^{2}\boldsymbol{q}}{\unicode[STIX]{x2202}x\unicode[STIX]{x2202}y}}+\unicode[STIX]{x1D651}_{\unicode[STIX]{x1D66D}\unicode[STIX]{x1D66F}}{\displaystyle \frac{\unicode[STIX]{x2202}^{2}\boldsymbol{q}}{\unicode[STIX]{x2202}x\unicode[STIX]{x2202}z}}+\unicode[STIX]{x1D651}_{\unicode[STIX]{x1D66E}\unicode[STIX]{x1D66E}}{\displaystyle \frac{\unicode[STIX]{x2202}^{2}\boldsymbol{q}}{\unicode[STIX]{x2202}y^{2}}}+\unicode[STIX]{x1D651}_{\unicode[STIX]{x1D66E}\unicode[STIX]{x1D66F}}{\displaystyle \frac{\unicode[STIX]{x2202}^{2}\boldsymbol{q}}{\unicode[STIX]{x2202}y\unicode[STIX]{x2202}z}}+\unicode[STIX]{x1D651}_{\unicode[STIX]{x1D66F}\unicode[STIX]{x1D66F}}{\displaystyle \frac{\unicode[STIX]{x2202}^{2}\boldsymbol{q}}{\unicode[STIX]{x2202}z^{2}}}=0.\qquad\end{eqnarray}$$
Here
![]() $\boldsymbol{q}=(\unicode[STIX]{x1D70C}^{\prime },u^{\prime },v^{\prime },w^{\prime },T^{\prime })^{\text{T}}$
is the perturbation vector and the detailed expressions for the matrices
$\boldsymbol{q}=(\unicode[STIX]{x1D70C}^{\prime },u^{\prime },v^{\prime },w^{\prime },T^{\prime })^{\text{T}}$
is the perturbation vector and the detailed expressions for the matrices
![]() $\unicode[STIX]{x1D647}_{\unicode[STIX]{x1D669}}$
,
$\unicode[STIX]{x1D647}_{\unicode[STIX]{x1D669}}$
,
![]() $\unicode[STIX]{x1D647}_{\unicode[STIX]{x1D66D}}$
,
$\unicode[STIX]{x1D647}_{\unicode[STIX]{x1D66D}}$
,
![]() $\unicode[STIX]{x1D647}_{\unicode[STIX]{x1D66E}}$
,
$\unicode[STIX]{x1D647}_{\unicode[STIX]{x1D66E}}$
,
![]() $\unicode[STIX]{x1D647}_{\unicode[STIX]{x1D66F}}$
,
$\unicode[STIX]{x1D647}_{\unicode[STIX]{x1D66F}}$
,
![]() $\unicode[STIX]{x1D647}_{\unicode[STIX]{x1D666}}$
,
$\unicode[STIX]{x1D647}_{\unicode[STIX]{x1D666}}$
,
![]() $\unicode[STIX]{x1D651}_{\unicode[STIX]{x1D66D}\unicode[STIX]{x1D66D}}$
,
$\unicode[STIX]{x1D651}_{\unicode[STIX]{x1D66D}\unicode[STIX]{x1D66D}}$
,
![]() $\unicode[STIX]{x1D651}_{\unicode[STIX]{x1D66E}\unicode[STIX]{x1D66E}}$
,
$\unicode[STIX]{x1D651}_{\unicode[STIX]{x1D66E}\unicode[STIX]{x1D66E}}$
,
![]() $\unicode[STIX]{x1D651}_{\unicode[STIX]{x1D66F}\unicode[STIX]{x1D66F}}$
,
$\unicode[STIX]{x1D651}_{\unicode[STIX]{x1D66F}\unicode[STIX]{x1D66F}}$
,
![]() $\unicode[STIX]{x1D651}_{\unicode[STIX]{x1D66D}\unicode[STIX]{x1D66E}}$
,
$\unicode[STIX]{x1D651}_{\unicode[STIX]{x1D66D}\unicode[STIX]{x1D66E}}$
,
![]() $\unicode[STIX]{x1D651}_{\unicode[STIX]{x1D66E}\unicode[STIX]{x1D66F}}$
and
$\unicode[STIX]{x1D651}_{\unicode[STIX]{x1D66E}\unicode[STIX]{x1D66F}}$
and
![]() $\unicode[STIX]{x1D651}_{\unicode[STIX]{x1D66D}\unicode[STIX]{x1D66F}}$
are functions of the dimensionless parameter (2.4), the base flow and thermodynamic and transport properties, and their detailed expressions can be found in Ren et al. (Reference Ren, Fu and Pecnik2019). The perturbation is assumed to have the normal-mode form,
$\unicode[STIX]{x1D651}_{\unicode[STIX]{x1D66D}\unicode[STIX]{x1D66F}}$
are functions of the dimensionless parameter (2.4), the base flow and thermodynamic and transport properties, and their detailed expressions can be found in Ren et al. (Reference Ren, Fu and Pecnik2019). The perturbation is assumed to have the normal-mode form,
where c.c. stands for the complex conjugate. Substituting (2.12) into (2.11) results in an eigenvalue problem. For boundary layers, we consider the spatial problem, where
![]() $\unicode[STIX]{x1D714}$
and
$\unicode[STIX]{x1D714}$
and
![]() $\unicode[STIX]{x1D6FD}$
are prescribed frequency and spanwise wavenumber. The real and imaginary parts of the eigenvalue
$\unicode[STIX]{x1D6FD}$
are prescribed frequency and spanwise wavenumber. The real and imaginary parts of the eigenvalue
![]() $\unicode[STIX]{x1D6FC}$
give the streamwise wavenumber and its local growth rate, respectively.
$\unicode[STIX]{x1D6FC}$
give the streamwise wavenumber and its local growth rate, respectively.
To solve the eigenvalue problem, Chebyshev collocation points and Chebyshev differentiation matrices are introduced to discretize the equations. The perturbations are subjected to the following boundary conditions:
![]() $u^{\prime }=v^{\prime }=w^{\prime }=0$
and
$u^{\prime }=v^{\prime }=w^{\prime }=0$
and
![]() $\unicode[STIX]{x2202}T^{\prime }/\unicode[STIX]{x2202}y=0$
at the wall (
$\unicode[STIX]{x2202}T^{\prime }/\unicode[STIX]{x2202}y=0$
at the wall (
![]() $y=0$
), while in the free stream at
$y=0$
), while in the free stream at
![]() $y=y_{max}$
,
$y=y_{max}$
,
![]() $u^{\prime }=v^{\prime }=w^{\prime }=0$
and
$u^{\prime }=v^{\prime }=w^{\prime }=0$
and
![]() $T^{\prime }=0$
.
$T^{\prime }=0$
.
2.4 Direct numerical simulation
In the context of direct numerical simulations, the N–S equations (2.1) are numerically integrated. Wall blowing and suction are introduced to excite the Tollmien–Schlichting (T–S) waves, which are the normal-mode solutions of the linearized N–S equations (Schmid & Henningson Reference Schmid and Henningson2001). The amplitude of the forcing has been properly chosen (between
![]() $10^{-5}$
and
$10^{-5}$
and
![]() $10^{-3}$
of the free-stream Mach number) such that the excited perturbations stay in the linear regime. At the wall, no-slip and adiabatic boundary conditions are applied. At the inflow the self-similar solution obtained in § 2.2 is prescribed. Close to the outflow and the free-stream boundaries, a sponge region forces the solution towards the corresponding laminar state. The algorithm is based on a sixth-order compact finite-difference method with a staggered arrangement of flow variables, while the time stepping scheme is based on an explicit third-order Runge–Kutta time method. The DNS has been performed for 2-D perturbations in this study, a
$10^{-3}$
of the free-stream Mach number) such that the excited perturbations stay in the linear regime. At the wall, no-slip and adiabatic boundary conditions are applied. At the inflow the self-similar solution obtained in § 2.2 is prescribed. Close to the outflow and the free-stream boundaries, a sponge region forces the solution towards the corresponding laminar state. The algorithm is based on a sixth-order compact finite-difference method with a staggered arrangement of flow variables, while the time stepping scheme is based on an explicit third-order Runge–Kutta time method. The DNS has been performed for 2-D perturbations in this study, a
![]() $N_{x}\times N_{y}=1201\times 201$
mesh has been used for most cases and is sufficient to give a grid-independent result. The non-ideal fluid properties are incorporated using 2-D look-up tables (see appendix A). Readers may refer to Nagarajan, Lele & Ferziger (Reference Nagarajan, Lele and Ferziger2003) and Marxen et al. (Reference Marxen, Magin, Iaccarino and Shaqfeh2011, Reference Marxen, Magin, Shaqfeh and Iaccarino2013) for numerical details.
$N_{x}\times N_{y}=1201\times 201$
mesh has been used for most cases and is sufficient to give a grid-independent result. The non-ideal fluid properties are incorporated using 2-D look-up tables (see appendix A). Readers may refer to Nagarajan, Lele & Ferziger (Reference Nagarajan, Lele and Ferziger2003) and Marxen et al. (Reference Marxen, Magin, Iaccarino and Shaqfeh2011, Reference Marxen, Magin, Shaqfeh and Iaccarino2013) for numerical details.
To analyse the results from DNS and to compare them with LST, the results are Fourier transformed in time with a fundamental angular frequency of
![]() $\unicode[STIX]{x1D6FA}=\unicode[STIX]{x1D714}/2$
,
$\unicode[STIX]{x1D6FA}=\unicode[STIX]{x1D714}/2$
,
We take
![]() $N=50$
samples within two forcing periods,
$N=50$
samples within two forcing periods,
![]() $l$
is the sampling index and the discrete time is
$l$
is the sampling index and the discrete time is
![]() $t_{l}=2\unicode[STIX]{x03C0}l/(\unicode[STIX]{x1D6FA}N)$
;
$t_{l}=2\unicode[STIX]{x03C0}l/(\unicode[STIX]{x1D6FA}N)$
;
![]() $k=0,1/2,1,3/2$
, etc. such that
$k=0,1/2,1,3/2$
, etc. such that
![]() $\hat{q}_{0}$
,
$\hat{q}_{0}$
,
![]() $\hat{q}_{1/2}$
,
$\hat{q}_{1/2}$
,
![]() $\hat{q}_{1}$
give the base flow, subharmonic mode and fundamental mode, respectively. The growth rate and phase velocity of the fundamental mode are given by
$\hat{q}_{1}$
give the base flow, subharmonic mode and fundamental mode, respectively. The growth rate and phase velocity of the fundamental mode are given by
where
![]() $\unicode[STIX]{x1D719}_{k}=\arg \left(\hat{q}_{k}\right)$
is the phase angle of the perturbation and
$\unicode[STIX]{x1D719}_{k}=\arg \left(\hat{q}_{k}\right)$
is the phase angle of the perturbation and
![]() $F$
is the dimensionless frequency defined by (4.1).
$F$
is the dimensionless frequency defined by (4.1).
The time integration is performed until the flow has reached a periodic solution. This is ensured by inspecting the subharmonic of the perturbation, whose amplitude is then at least one order of magnitude less than the fundamental perturbation.
3 Flow cases and the laminar base flow
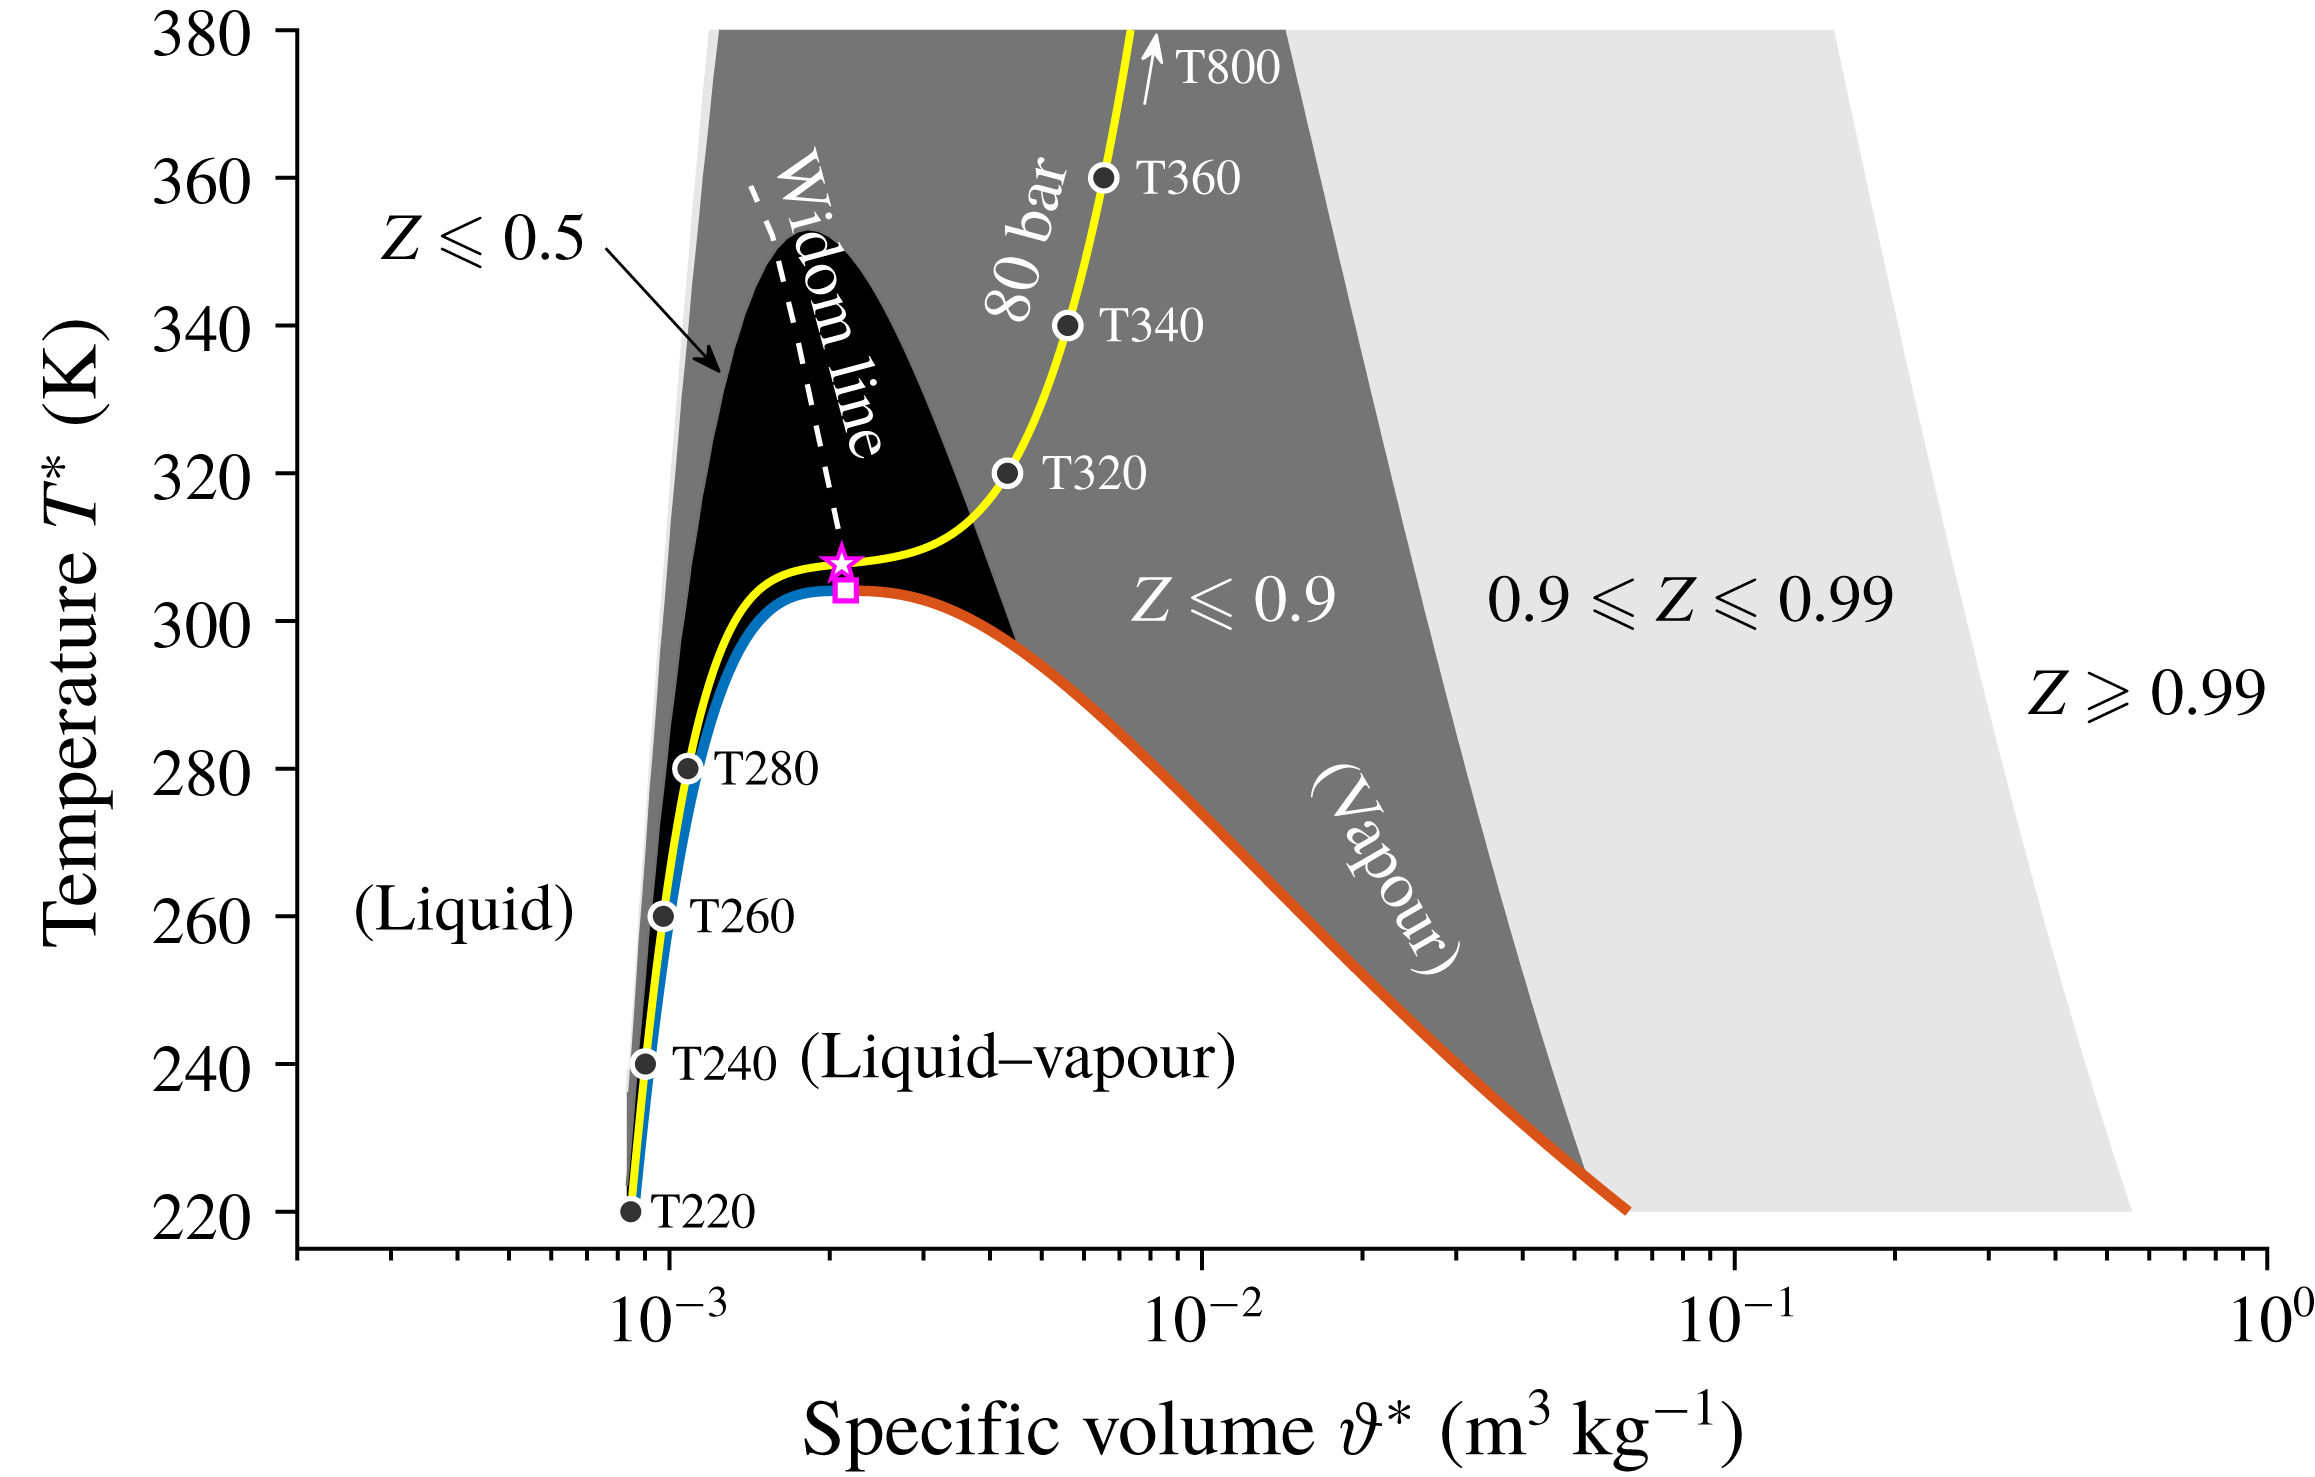
Figure 1.
![]() $T{-}\unicode[STIX]{x1D717}$
diagram of
$T{-}\unicode[STIX]{x1D717}$
diagram of
![]() $\text{CO}_{2}$
together with the critical point (magenta square), pseudo-critical point (magenta pentagram), Widom line (white dashed line), two saturation curves (blue and red thick lines) and an isobar of 80 (yellow line). The shaded area shows the contour of compressibility factor
$\text{CO}_{2}$
together with the critical point (magenta square), pseudo-critical point (magenta pentagram), Widom line (white dashed line), two saturation curves (blue and red thick lines) and an isobar of 80 (yellow line). The shaded area shows the contour of compressibility factor
![]() $Z$
, indicating the degree of the non-ideality. The free-stream temperatures (
$Z$
, indicating the degree of the non-ideality. The free-stream temperatures (
![]() $\text{T220},\text{T240},\ldots$
) to be investigated are highlighted with circles on the isobar.
$\text{T220},\text{T240},\ldots$
) to be investigated are highlighted with circles on the isobar.
Figure 1 shows an isobar at 80 bar (yellow solid line) in the
![]() $T{-}\unicode[STIX]{x1D717}$
diagram, together with the critical point (magenta square), pseudo-critical point (magenta pentagram), Widom line (white dashed line), saturation curves (blue on the liquid side and red on the vapour side) as well as a partition of the compressibility factor
$T{-}\unicode[STIX]{x1D717}$
diagram, together with the critical point (magenta square), pseudo-critical point (magenta pentagram), Widom line (white dashed line), saturation curves (blue on the liquid side and red on the vapour side) as well as a partition of the compressibility factor
![]() $Z=p^{\ast }/(\unicode[STIX]{x1D70C}^{\ast }R^{\ast }T^{\ast })$
, which characterizes the non-ideality of the fluid. The pseudo-critical point is defined on the isobar where
$Z=p^{\ast }/(\unicode[STIX]{x1D70C}^{\ast }R^{\ast }T^{\ast })$
, which characterizes the non-ideality of the fluid. The pseudo-critical point is defined on the isobar where
![]() $C_{p}$
reaches its maximum, which helps to define the Widom line (Sciortino et al.
Reference Sciortino, Poole, Essmann and Stanley1997; Raju et al.
Reference Raju, Banuti, Ma and Ihme2017) and identify the point where non-ideal-gas effects are most prominent. As shown in the figure, close to the (pseudo-) critical point, the fluid shows large non-ideality where the compressibility factor
$C_{p}$
reaches its maximum, which helps to define the Widom line (Sciortino et al.
Reference Sciortino, Poole, Essmann and Stanley1997; Raju et al.
Reference Raju, Banuti, Ma and Ihme2017) and identify the point where non-ideal-gas effects are most prominent. As shown in the figure, close to the (pseudo-) critical point, the fluid shows large non-ideality where the compressibility factor
![]() $Z$
is far from 1.0 (less than 0.5, highlighted with the black background). On the other hand, the ideal-gas assumption can be made only when the compressibility factor is close to one, e.g. in the north-eastern part of the
$Z$
is far from 1.0 (less than 0.5, highlighted with the black background). On the other hand, the ideal-gas assumption can be made only when the compressibility factor is close to one, e.g. in the north-eastern part of the
![]() $T{-}\unicode[STIX]{x1D717}$
diagram. Along the isobar of 80, the liquid–vapour phase boundary vanishes. Therefore, when the temperature increases from 220 K, crosses the pseudo-critical point of 307.7 K and reaches 800 K, the fluid undergoes a liquid-like to vapour-like transition and eventually approaches the ideal-gas regime, meanwhile, the thermodynamic and transport properties show large variations near the pseudo-critical point (see also appendix A). The temperatures highlighted on the isobar (
$T{-}\unicode[STIX]{x1D717}$
diagram. Along the isobar of 80, the liquid–vapour phase boundary vanishes. Therefore, when the temperature increases from 220 K, crosses the pseudo-critical point of 307.7 K and reaches 800 K, the fluid undergoes a liquid-like to vapour-like transition and eventually approaches the ideal-gas regime, meanwhile, the thermodynamic and transport properties show large variations near the pseudo-critical point (see also appendix A). The temperatures highlighted on the isobar (
![]() $\text{T220},\text{T240},\ldots$
) indicate the free-stream temperature that will be investigated in the following part of the paper.
$\text{T220},\text{T240},\ldots$
) indicate the free-stream temperature that will be investigated in the following part of the paper.
Along the isobar shown in figure 1, we consider eight groups of cases, of which four are with subcritical free-stream temperatures (T220, T240, T260 and T280), and four are with supercritical temperatures (T320, T340, T360 and T800) in the free stream. For each group, four Eckert numbers are considered (
![]() $\mathit{Ec}_{\infty }=0.05$
, 0.10, 0.15 and 0.20), leading to a total of 32 cases. On the upper half of table 1, we show the cases with subcritical
$\mathit{Ec}_{\infty }=0.05$
, 0.10, 0.15 and 0.20), leading to a total of 32 cases. On the upper half of table 1, we show the cases with subcritical
![]() $T_{\infty }^{\ast }$
. The temperature profiles for these cases remain subcritical, except for the T280E4 case, which becomes transcritical (
$T_{\infty }^{\ast }$
. The temperature profiles for these cases remain subcritical, except for the T280E4 case, which becomes transcritical (
![]() $T_{\infty }^{\ast }/T_{pc}^{\ast }<1$
and
$T_{\infty }^{\ast }/T_{pc}^{\ast }<1$
and
![]() $T_{w}^{\ast }/T_{pc}^{\ast }>1$
) due to sufficient viscous heating. On the lower half, the supercritical cases are listed. Cases listed in table 1 are subjected to non-ideal-gas effects since they fall into the shaded area highlighted in figure 1, except for the T800 case, which serves as a reference for the ideal-gas regime. It can be anticipated that the T280 and T320 cases, which are closer to the Widom line, will have the most significant non-ideal-gas effects. It is also possible to notice that the free-stream Mach number remains subsonic in the subcritical cases and can be supersonic in the supercritical cases for the investigated range of Eckert numbers.
$T_{w}^{\ast }/T_{pc}^{\ast }>1$
) due to sufficient viscous heating. On the lower half, the supercritical cases are listed. Cases listed in table 1 are subjected to non-ideal-gas effects since they fall into the shaded area highlighted in figure 1, except for the T800 case, which serves as a reference for the ideal-gas regime. It can be anticipated that the T280 and T320 cases, which are closer to the Widom line, will have the most significant non-ideal-gas effects. It is also possible to notice that the free-stream Mach number remains subsonic in the subcritical cases and can be supersonic in the supercritical cases for the investigated range of Eckert numbers.
Table 1. Numerical parameters of the cases investigated.
![]() $T_{w}^{\ast }$
is the wall temperature, which results from the viscous heating and the adiabatic boundary condition. Note that to understand the transcritical regime, more cases have been investigated for
$T_{w}^{\ast }$
is the wall temperature, which results from the viscous heating and the adiabatic boundary condition. Note that to understand the transcritical regime, more cases have been investigated for
![]() $T_{\infty }^{\ast }=280~\text{K}$
, in addition to the cases shown in this table.
$T_{\infty }^{\ast }=280~\text{K}$
, in addition to the cases shown in this table.
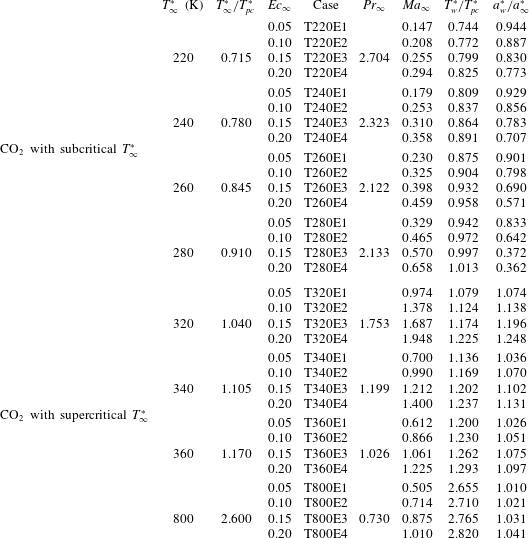
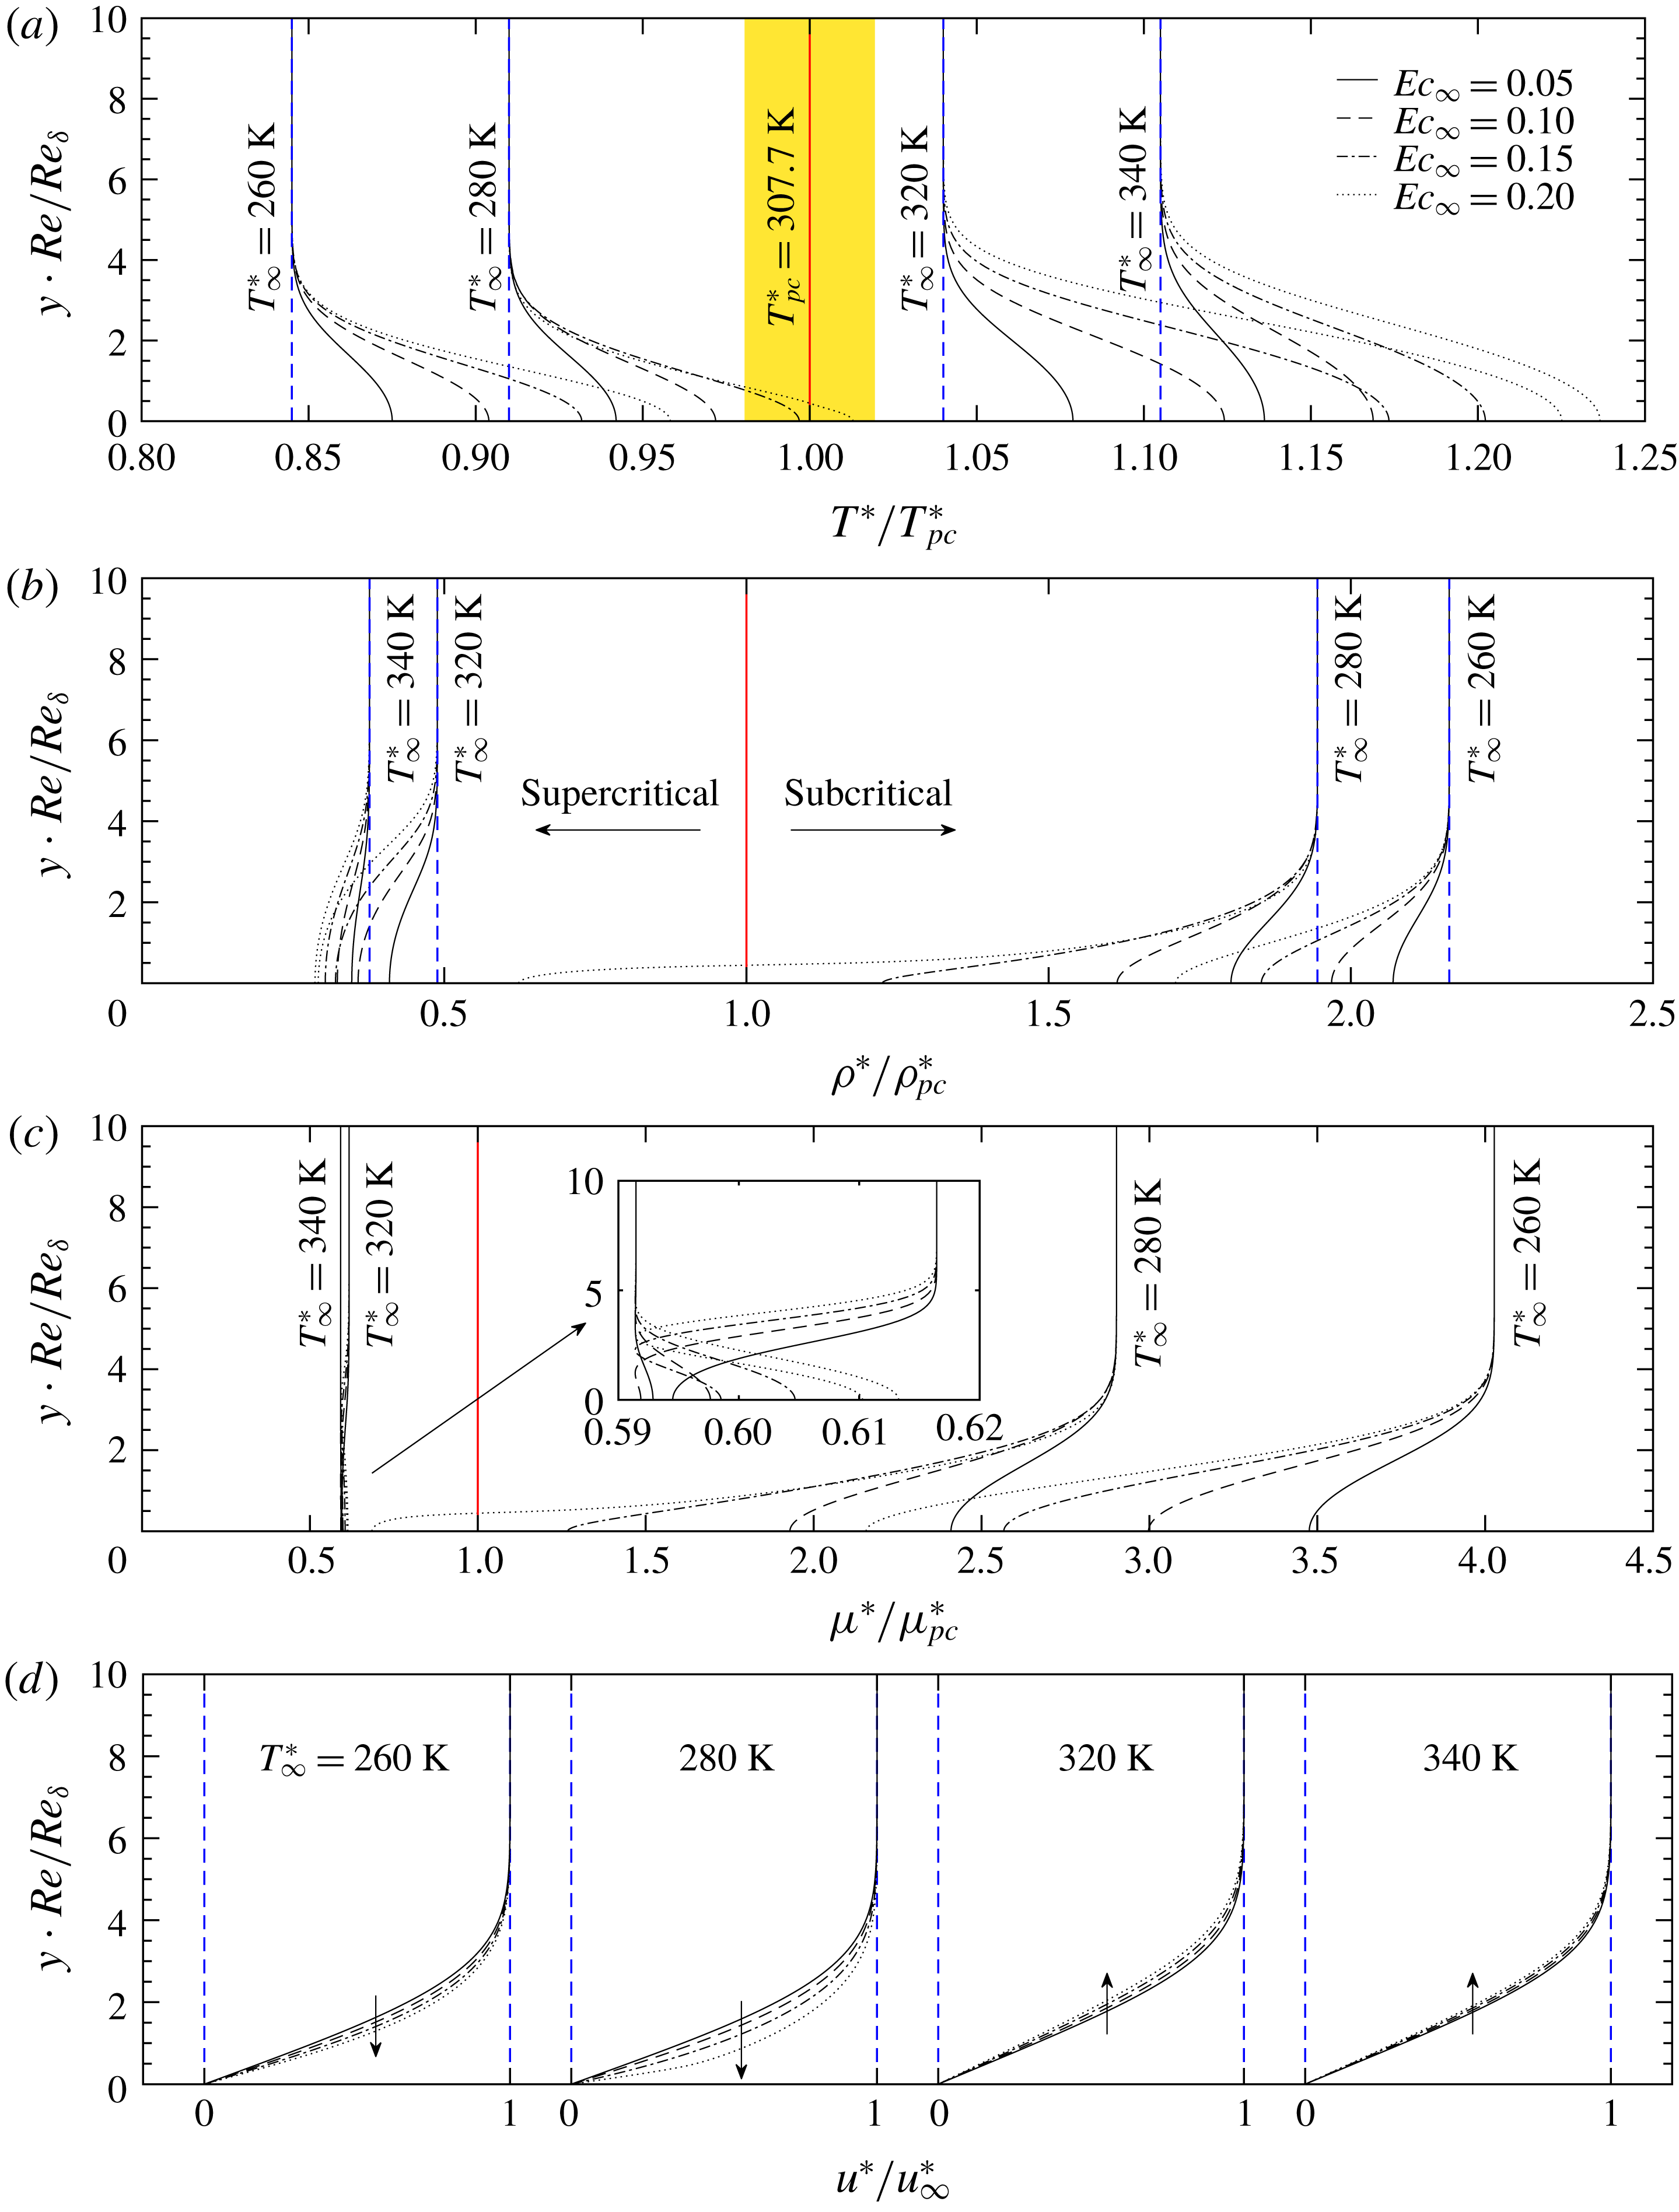
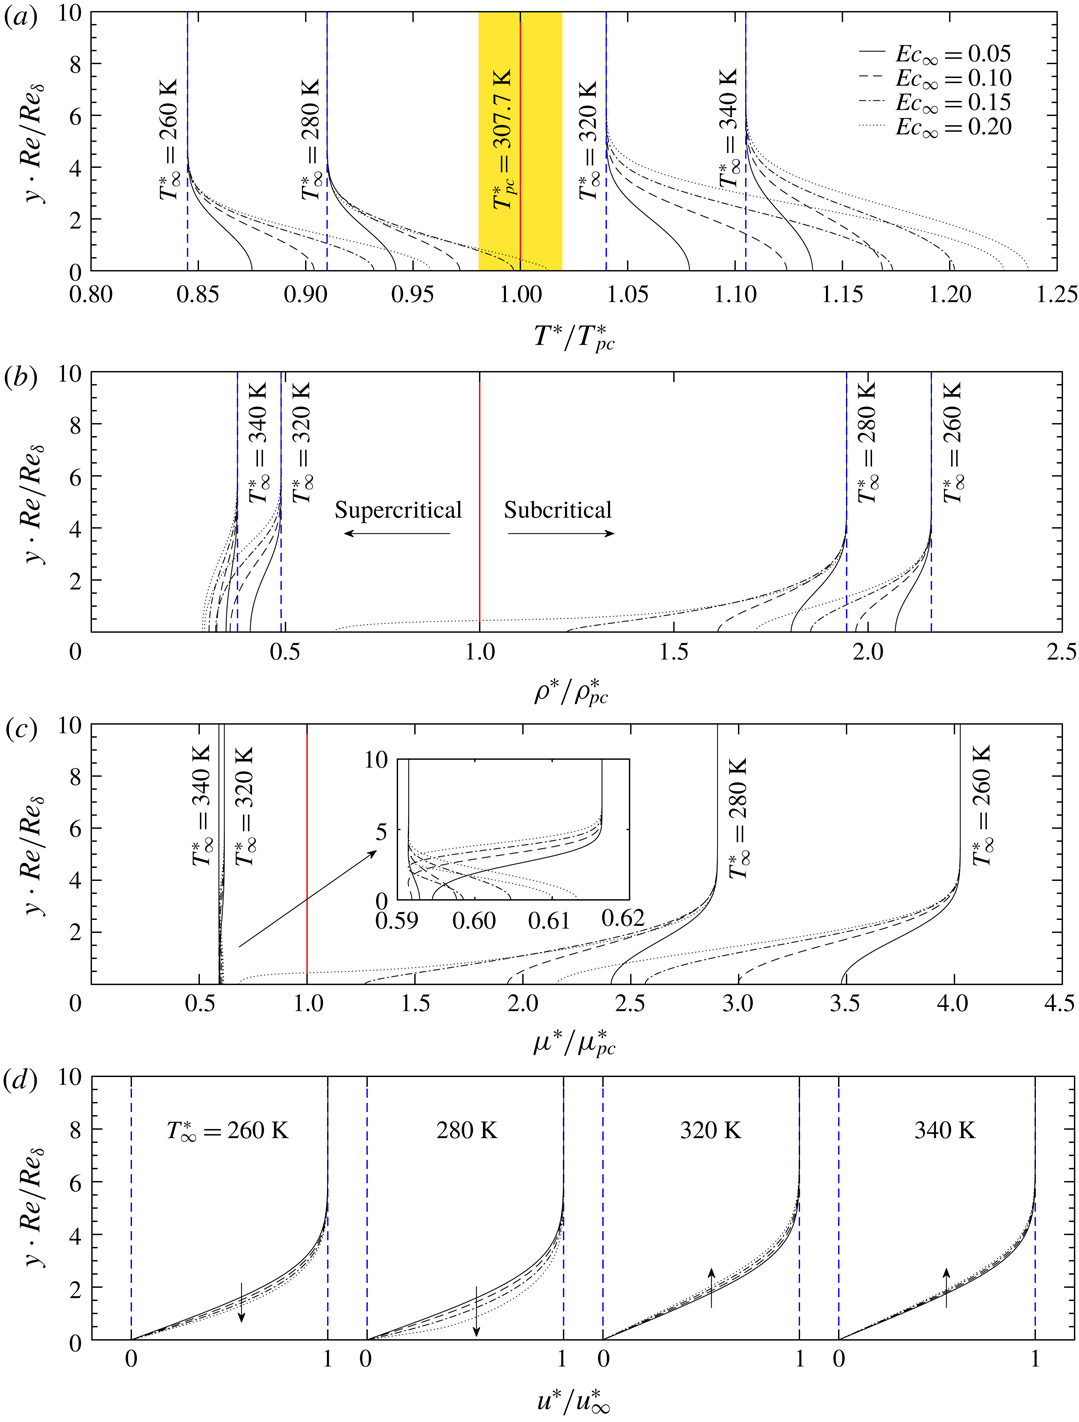
Figure 2. Base flow profiles of the T260, T280, T320 and T340 cases. Panels show the (a) temperature, (b) density (c) viscosity and (d) streamwise velocity as functions of the
![]() $\unicode[STIX]{x1D6FF}^{\ast }$
-scaled wall-normal coordinate
$\unicode[STIX]{x1D6FF}^{\ast }$
-scaled wall-normal coordinate
![]() $y\cdot \mathit{Re}/\mathit{Re}_{\unicode[STIX]{x1D6FF}}$
. The red solid line indicates the pseudo-critical point. The coloured area in (a) schematically shows the regime where non-ideal-gas effects are most prominent. A zoom-in of the viscosity for cases T320 and T340 is also shown in (c). Arrows in panel (d) stand for the increase of the Eckert number
$y\cdot \mathit{Re}/\mathit{Re}_{\unicode[STIX]{x1D6FF}}$
. The red solid line indicates the pseudo-critical point. The coloured area in (a) schematically shows the regime where non-ideal-gas effects are most prominent. A zoom-in of the viscosity for cases T320 and T340 is also shown in (c). Arrows in panel (d) stand for the increase of the Eckert number
![]() $\mathit{Ec}_{\infty }$
.
$\mathit{Ec}_{\infty }$
.
The base flow profiles are shown in figure 2 for cases T260, T280, T320 and T340. We show the distribution of temperature, density, viscosity and streamwise velocity as functions of the
![]() $\unicode[STIX]{x1D6FF}^{\ast }$
-scaled wall-normal coordinate
$\unicode[STIX]{x1D6FF}^{\ast }$
-scaled wall-normal coordinate
![]() $y\cdot \mathit{Re}/\mathit{Re}_{\unicode[STIX]{x1D6FF}}$
. In the temperature panel (a), the pseudo-critical point and the highly non-ideal regime around it are highlighted with a red line and yellow background. The flow temperature increases from the free-stream value, reaching a maximum at the wall due to viscous heating. Compatible with table 1, the T280E4 case has crossed the Widom line which leads to a significant density drop from the liquid-like (subcritical) to the vapour-like (supercritical) regime, as shown in figure 2(b) (see also figure 23). The density gradients are comparably smaller for the other cases. We show the distribution of the viscosity in panel (c); the value notably drops when the temperature increases from the subcritical regime. In the supercritical regime, the viscosity increases again with temperature. This can be seen in the zoom-in plot of case T340. As a result, the local Prandtl number
$y\cdot \mathit{Re}/\mathit{Re}_{\unicode[STIX]{x1D6FF}}$
. In the temperature panel (a), the pseudo-critical point and the highly non-ideal regime around it are highlighted with a red line and yellow background. The flow temperature increases from the free-stream value, reaching a maximum at the wall due to viscous heating. Compatible with table 1, the T280E4 case has crossed the Widom line which leads to a significant density drop from the liquid-like (subcritical) to the vapour-like (supercritical) regime, as shown in figure 2(b) (see also figure 23). The density gradients are comparably smaller for the other cases. We show the distribution of the viscosity in panel (c); the value notably drops when the temperature increases from the subcritical regime. In the supercritical regime, the viscosity increases again with temperature. This can be seen in the zoom-in plot of case T340. As a result, the local Prandtl number
![]() $\mathit{Pr}_{l}$
, which is usually assumed constant in flows with the ideal-gas assumption, demonstrates large variations near the pseudo-critical point. The non-ideal-gas effects are also visible in the velocity distributions, shown in figure 2(d). In the subcritical and transcritical cases, the velocity develops a fuller profile with increasing Eckert number, which is opposite to what is observed for the supercritical and the ideal-gas cases, where the boundary-layer thickness increases with Eckert number.
$\mathit{Pr}_{l}$
, which is usually assumed constant in flows with the ideal-gas assumption, demonstrates large variations near the pseudo-critical point. The non-ideal-gas effects are also visible in the velocity distributions, shown in figure 2(d). In the subcritical and transcritical cases, the velocity develops a fuller profile with increasing Eckert number, which is opposite to what is observed for the supercritical and the ideal-gas cases, where the boundary-layer thickness increases with Eckert number.
Although the fluid can be highly non-ideal, the self-similar solution makes use of the constant pressure in the wall-normal direction, such that all the local variables can be solved as unary functions of
![]() $\unicode[STIX]{x1D702}$
(2.8) only. The base flow has been validated by comparing with the laminar results obtained with the DNS code (without perturbation) in appendix B in order to further verify the use of the self-similar solution with highly non-ideal fluids over adiabatic flat plates.
$\unicode[STIX]{x1D702}$
(2.8) only. The base flow has been validated by comparing with the laminar results obtained with the DNS code (without perturbation) in appendix B in order to further verify the use of the self-similar solution with highly non-ideal fluids over adiabatic flat plates.
4 Results and discussions
In this section, we analyse the stability of boundary-layer flows by discussing the neutral curve, growth rate, phase velocity, perturbation profiles as well as the inviscid equations. Two-dimensional perturbations are first studied (§§ 4.1–4.3), while oblique effects are discussed in § 4.4. The dimensionless frequency
![]() $F$
is introduced,
$F$
is introduced,
which is directly proportional to the physical frequency
![]() $F^{\ast }$
of the perturbation, once the free-stream parameters are chosen.
$F^{\ast }$
of the perturbation, once the free-stream parameters are chosen.
4.1 The supercritical regime
Figure 3 shows the distribution of the local growth rate
![]() $(-\unicode[STIX]{x1D6FC}_{i})$
in the
$(-\unicode[STIX]{x1D6FC}_{i})$
in the
![]() $F{-}\mathit{Re}_{\unicode[STIX]{x1D6FF}}$
diagram. The contour levels start from the neutral curve (
$F{-}\mathit{Re}_{\unicode[STIX]{x1D6FF}}$
diagram. The contour levels start from the neutral curve (
![]() $\unicode[STIX]{x1D6FC}_{i}=0$
), up to the largest growth rate in the range of
$\unicode[STIX]{x1D6FC}_{i}=0$
), up to the largest growth rate in the range of
![]() $\mathit{Re}_{\unicode[STIX]{x1D6FF}}$
and
$\mathit{Re}_{\unicode[STIX]{x1D6FF}}$
and
![]() $F$
considered. In each panel the canvas is divided into four quadrants with mirrored coordinates to help compare results of four Eckert numbers. The dotted lines represent the neutral curve for
$F$
considered. In each panel the canvas is divided into four quadrants with mirrored coordinates to help compare results of four Eckert numbers. The dotted lines represent the neutral curve for
![]() $\mathit{Ec}_{\infty }=0.05$
, which are also plotted in the quadrants with the higher Eckert numbers to highlight the compressibility effects. Among the results, figure 3(d) provides a reference for the ideal-gas regime with
$\mathit{Ec}_{\infty }=0.05$
, which are also plotted in the quadrants with the higher Eckert numbers to highlight the compressibility effects. Among the results, figure 3(d) provides a reference for the ideal-gas regime with
![]() $T_{\infty }^{\ast }=800~\text{K}$
, where it can be seen that an increase in Eckert (Mach) number stabilizes the flow, as the growth rate reduces and the extent of the neutral curve decreases. This is expected and has been documented in the past by Mack (Reference Mack1984).
$T_{\infty }^{\ast }=800~\text{K}$
, where it can be seen that an increase in Eckert (Mach) number stabilizes the flow, as the growth rate reduces and the extent of the neutral curve decreases. This is expected and has been documented in the past by Mack (Reference Mack1984).
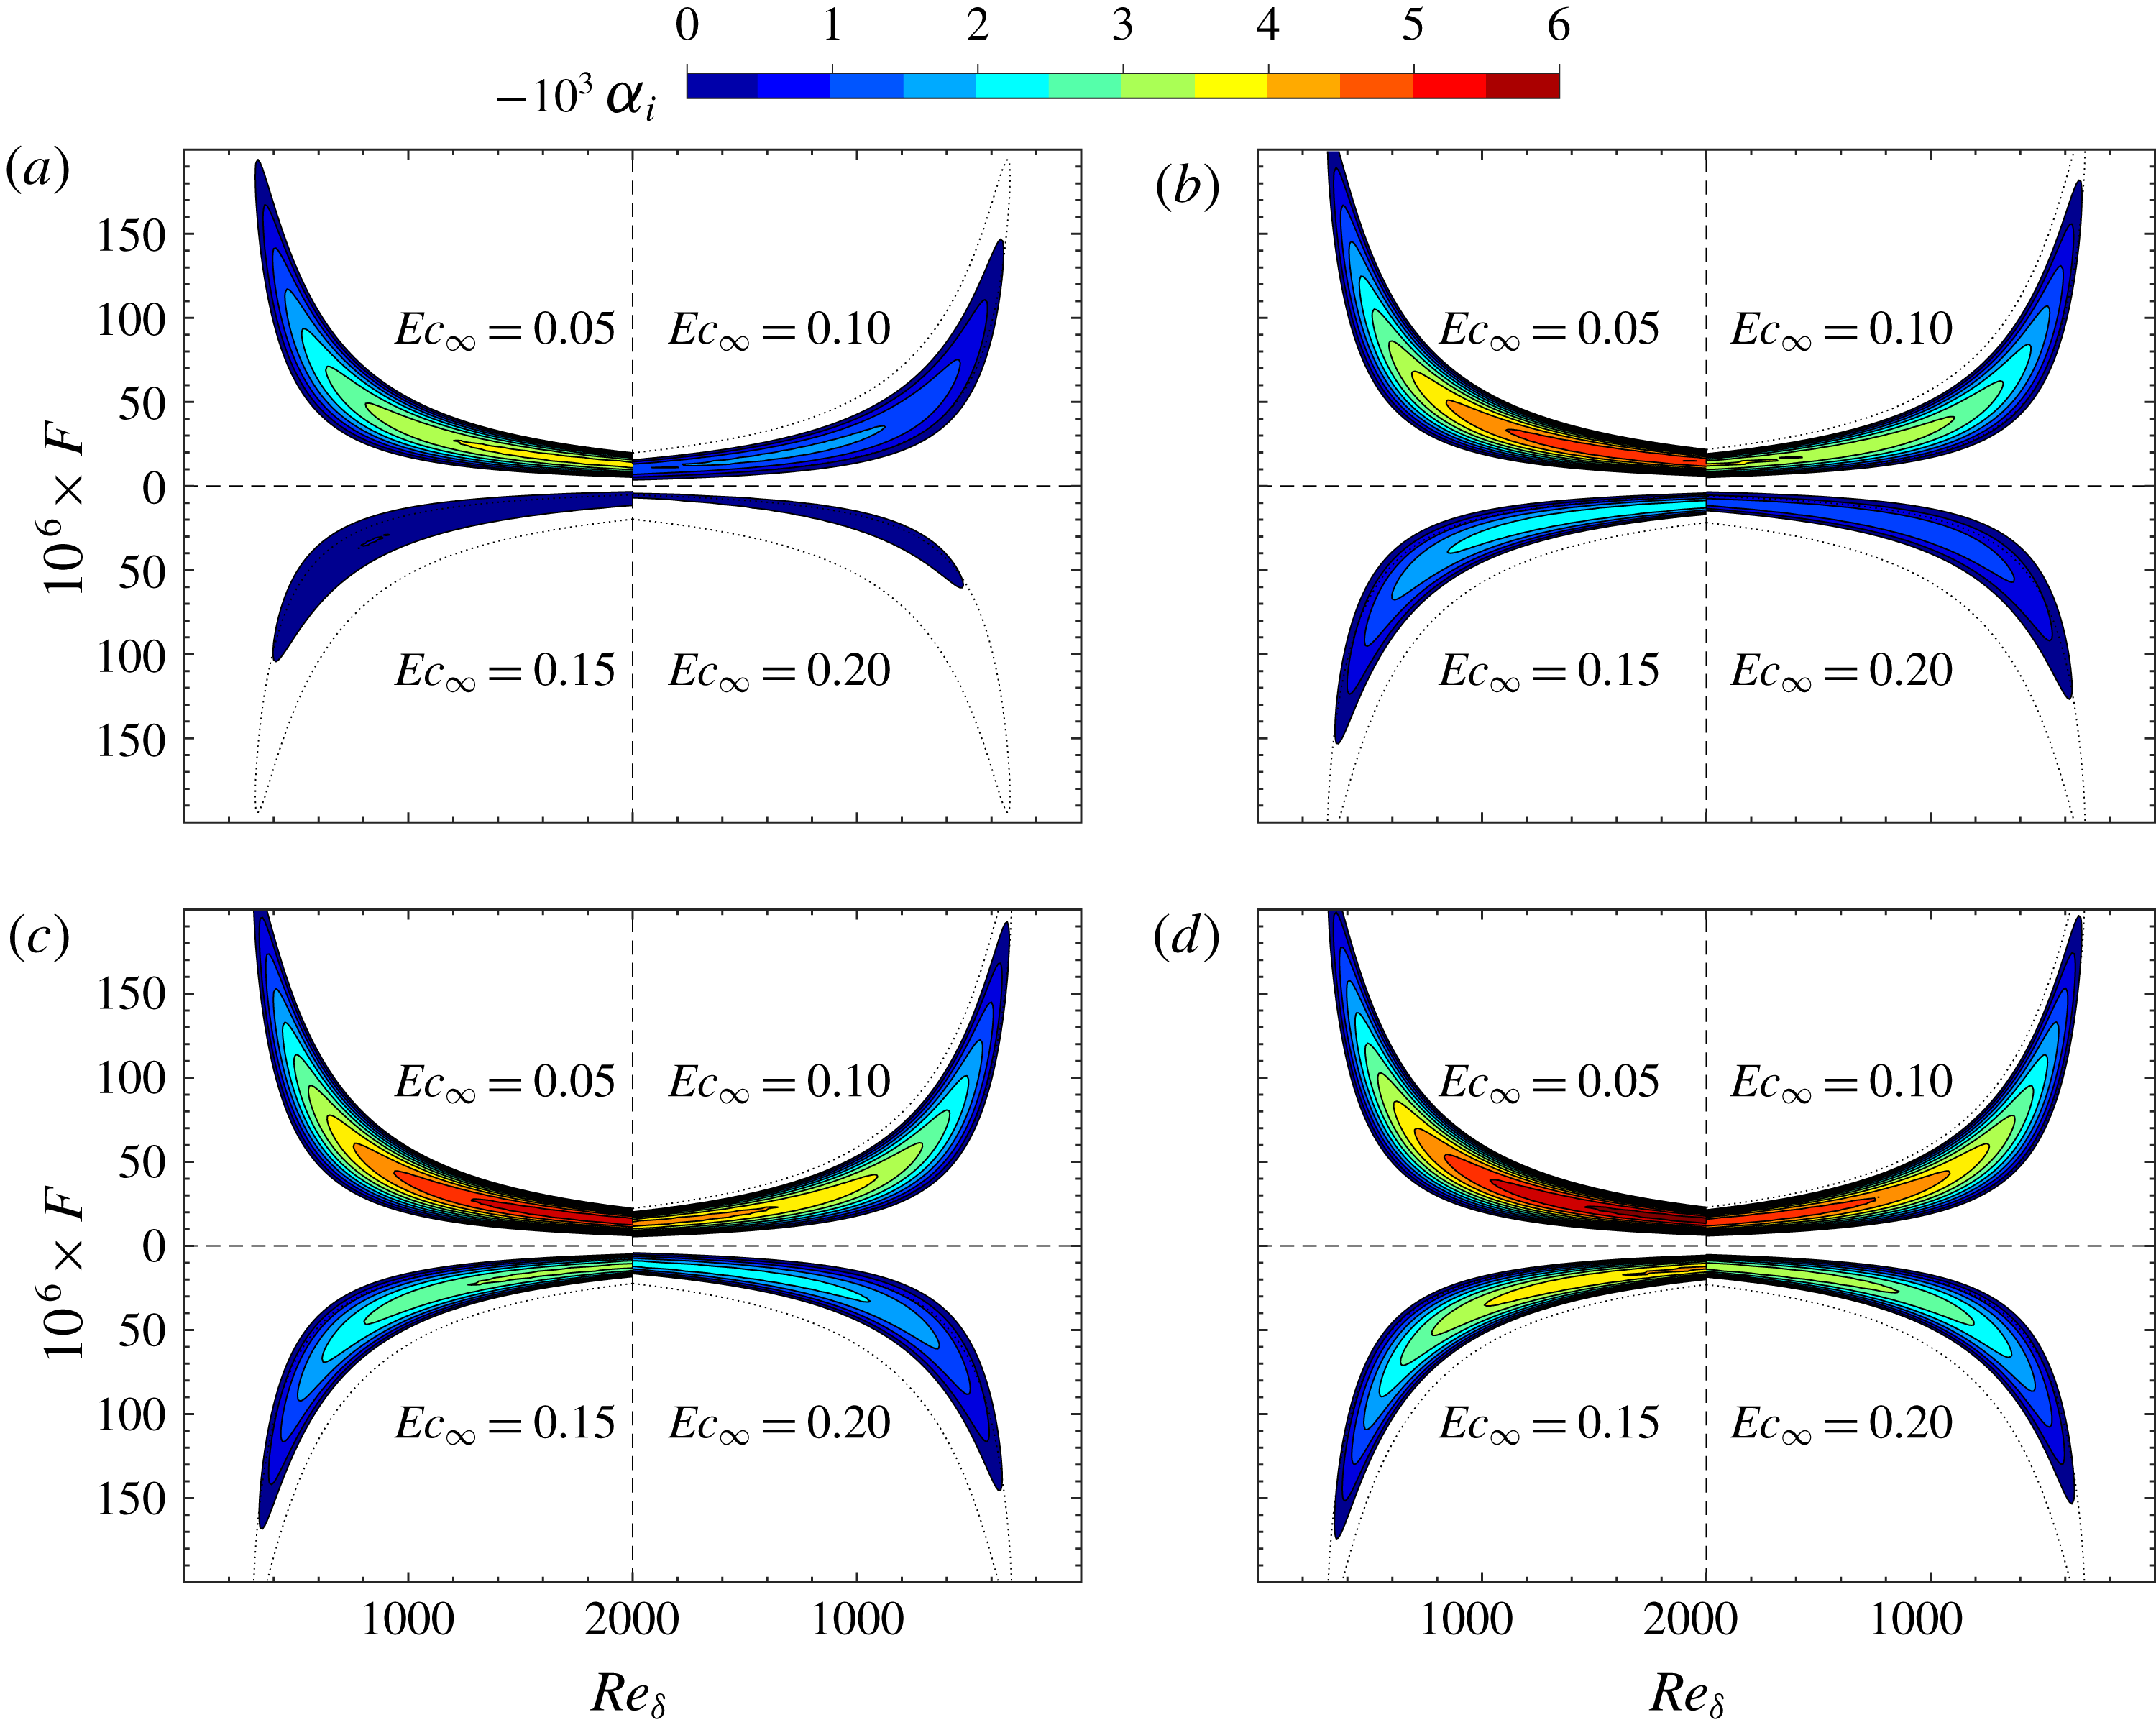
Figure 3. Growth rates (
![]() $-\unicode[STIX]{x1D6FC}_{i}$
) of 2-D perturbations in the
$-\unicode[STIX]{x1D6FC}_{i}$
) of 2-D perturbations in the
![]() $F{-}\mathit{Re}_{\infty }$
stability diagram with supercritical free-stream temperatures: (a)
$F{-}\mathit{Re}_{\infty }$
stability diagram with supercritical free-stream temperatures: (a)
![]() $T_{\infty }^{\ast }=320~\text{K}$
, (b)
$T_{\infty }^{\ast }=320~\text{K}$
, (b)
![]() $T_{\infty }^{\ast }=340~\text{K}$
, (c)
$T_{\infty }^{\ast }=340~\text{K}$
, (c)
![]() $T_{\infty }^{\ast }=360~\text{K}$
and (d)
$T_{\infty }^{\ast }=360~\text{K}$
and (d)
![]() $T_{\infty }^{\ast }=800~\text{K}$
. The coordinate in each panel has been mirrored in the centre in order to compare results for the four Eckert numbers.
$T_{\infty }^{\ast }=800~\text{K}$
. The coordinate in each panel has been mirrored in the centre in order to compare results for the four Eckert numbers.
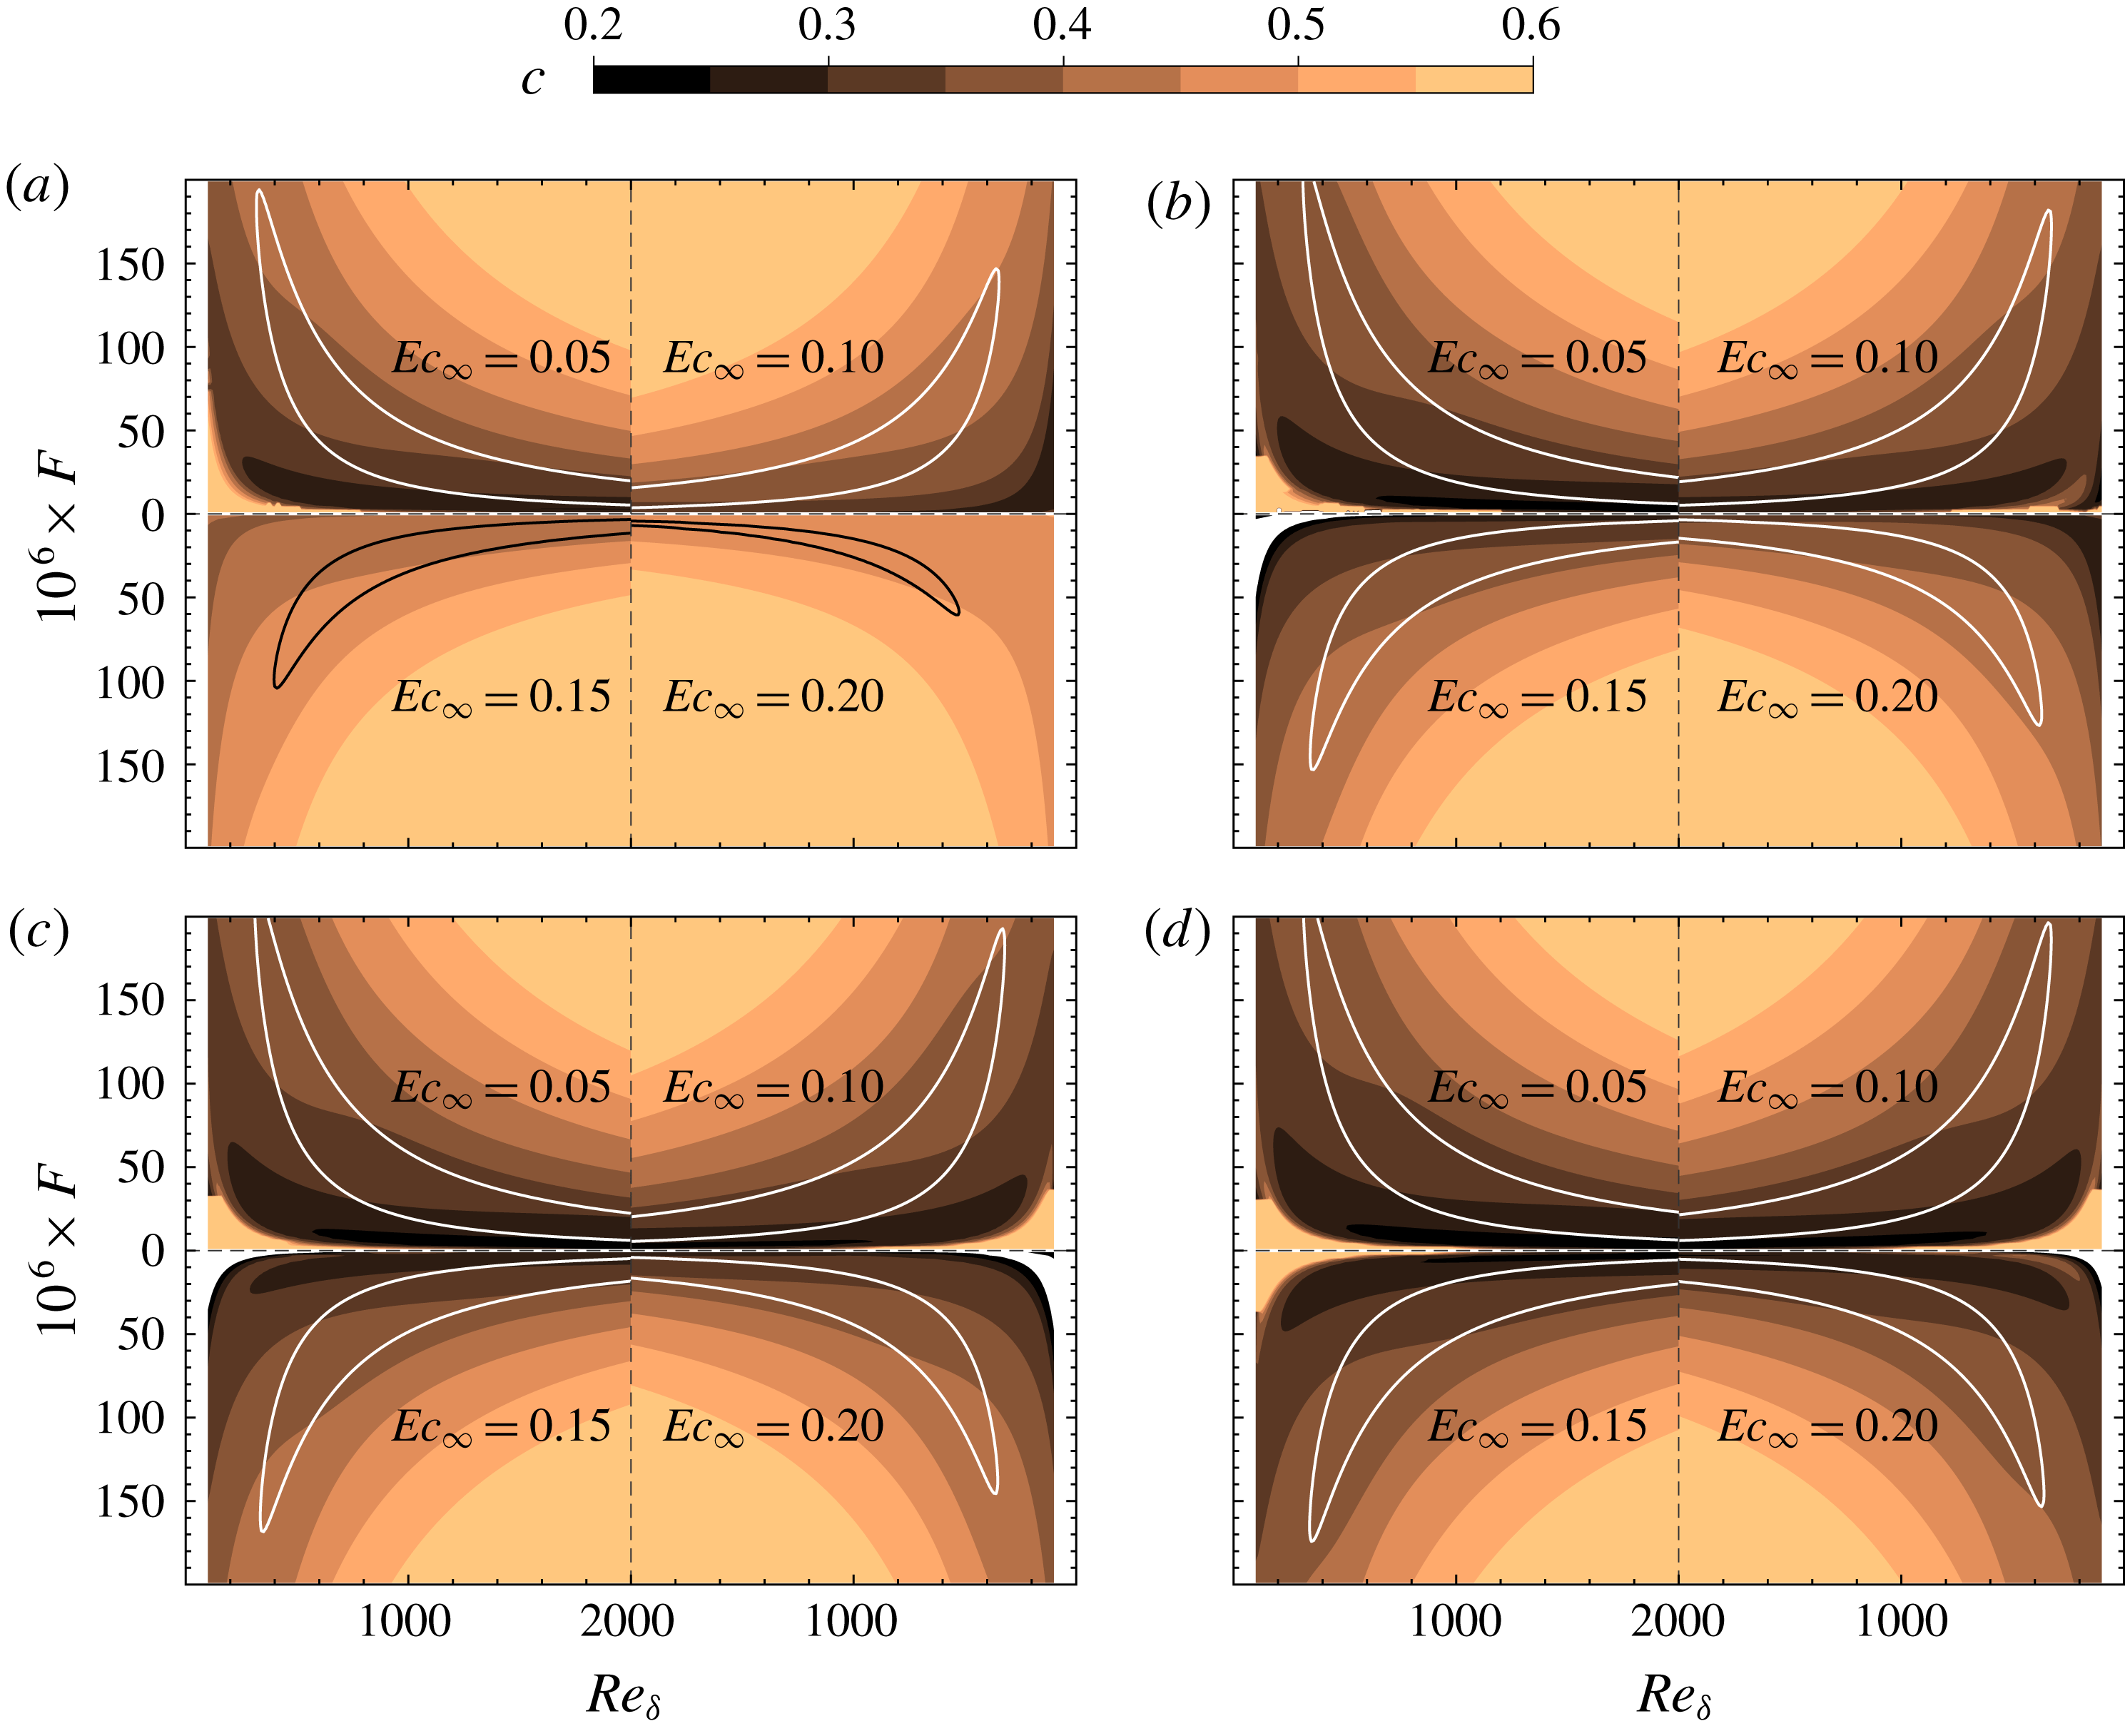
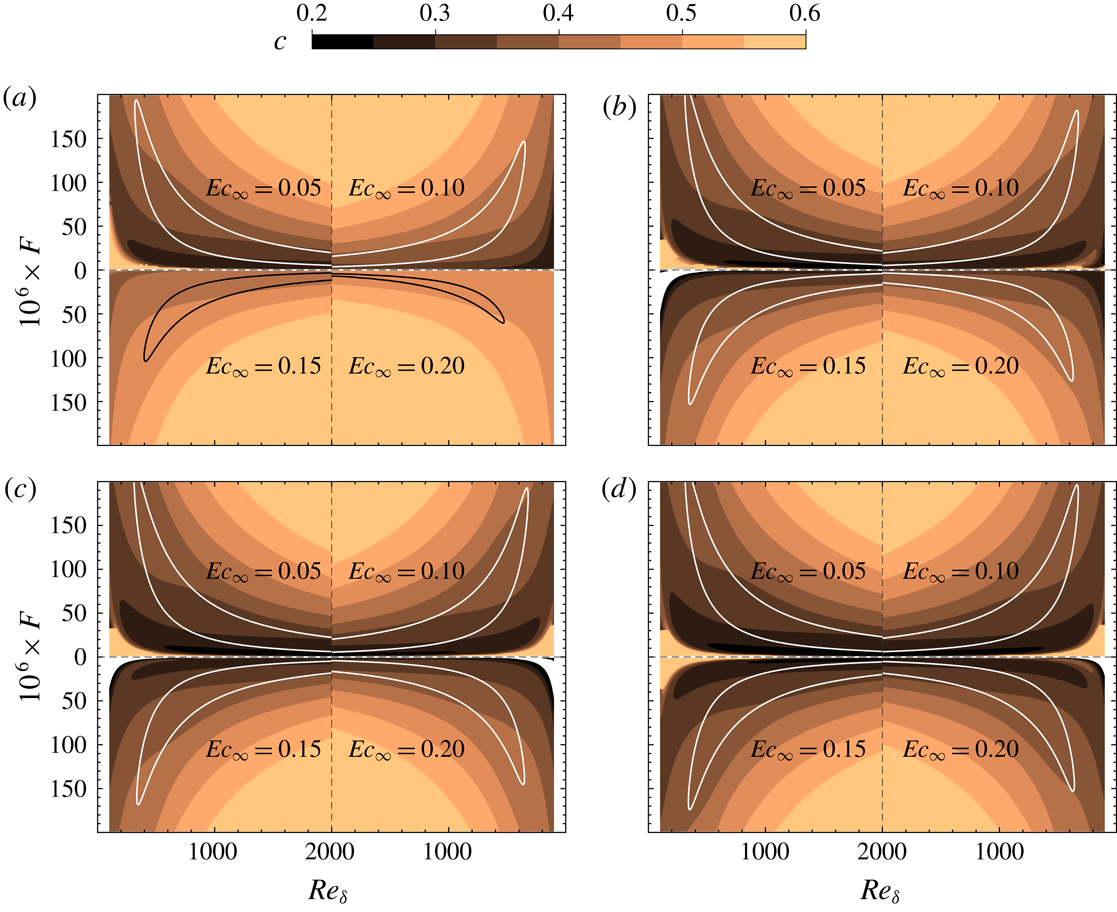
Figure 4. Phase velocities of perturbations (coloured contours) in the
![]() $F{-}\mathit{Re}$
stability diagram with supercritical free-stream temperatures: (a)
$F{-}\mathit{Re}$
stability diagram with supercritical free-stream temperatures: (a)
![]() $T_{\infty }^{\ast }=320~\text{K}$
, (b)
$T_{\infty }^{\ast }=320~\text{K}$
, (b)
![]() $T_{\infty }^{\ast }=340~\text{K}$
, (c)
$T_{\infty }^{\ast }=340~\text{K}$
, (c)
![]() $T_{\infty }^{\ast }=360~\text{K}$
and (d)
$T_{\infty }^{\ast }=360~\text{K}$
and (d)
![]() $T_{\infty }^{\ast }=800~\text{K}$
. The solid lines indicate neutral curves of the corresponding cases.
$T_{\infty }^{\ast }=800~\text{K}$
. The solid lines indicate neutral curves of the corresponding cases.
However, if the free-stream temperature decreases towards values slightly above the pseudo-critical temperature, the non-ideal-gas effects considerably increase the stability of the base flow for high Eckert numbers. For example, the neutral curve for case T320E4 has become smaller, indicating a very narrow band of unstable frequencies. For low Eckert numbers (e.g.
![]() $\mathit{Ec}_{\infty }=0.05$
), the size of the neutral curve is comparable, but the growth rate decreases with decreasing free-stream temperature.
$\mathit{Ec}_{\infty }=0.05$
), the size of the neutral curve is comparable, but the growth rate decreases with decreasing free-stream temperature.
Note that the results presented in figure 3 can be interpreted either by specifying
![]() $\mathit{Ec}_{\infty }$
and comparing results for different
$\mathit{Ec}_{\infty }$
and comparing results for different
![]() $T_{\infty }^{\ast }$
, or conversely setting
$T_{\infty }^{\ast }$
, or conversely setting
![]() $T_{\infty }^{\ast }$
and comparing different
$T_{\infty }^{\ast }$
and comparing different
![]() $\mathit{Ec}_{\infty }$
. Both show a stabilization of the base flow through non-ideal-gas (varying
$\mathit{Ec}_{\infty }$
. Both show a stabilization of the base flow through non-ideal-gas (varying
![]() $T_{\infty }^{\ast }$
) and compressibility effects (varying
$T_{\infty }^{\ast }$
) and compressibility effects (varying
![]() $\mathit{Ec}_{\infty }$
). One may argue that
$\mathit{Ec}_{\infty }$
). One may argue that
![]() $\mathit{Ma}_{\infty }$
can be used to show the compressibility effects. Here we clarify the advantage of using
$\mathit{Ma}_{\infty }$
can be used to show the compressibility effects. Here we clarify the advantage of using
![]() $\mathit{Ec}_{\infty }$
instead of
$\mathit{Ec}_{\infty }$
instead of
![]() $\mathit{Ma}_{\infty }$
. From table 1, it is clear that a higher
$\mathit{Ma}_{\infty }$
. From table 1, it is clear that a higher
![]() $\mathit{Ec}_{\infty }$
corresponds to a higher
$\mathit{Ec}_{\infty }$
corresponds to a higher
![]() $\mathit{Ma}_{\infty }$
, therefore the stabilization due to compressibility effects can be characterized by
$\mathit{Ma}_{\infty }$
, therefore the stabilization due to compressibility effects can be characterized by
![]() $\mathit{Ma}_{\infty }$
. However,
$\mathit{Ma}_{\infty }$
. However,
![]() $\mathit{Ma}_{\infty }$
is not a suitable parameter to measure the degree of compressibility when non-ideal-gas effects are present. In fact, the speed of sound for the non-ideal gas drops sharply near the critical point. For example, for
$\mathit{Ma}_{\infty }$
is not a suitable parameter to measure the degree of compressibility when non-ideal-gas effects are present. In fact, the speed of sound for the non-ideal gas drops sharply near the critical point. For example, for
![]() $\text{CO}_{2}$
at 80 bar the speed of sound
$\text{CO}_{2}$
at 80 bar the speed of sound
![]() $a^{\ast }$
drops from
$a^{\ast }$
drops from
![]() $987.5$
to
$987.5$
to
![]() $178.9~\text{m}~\text{s}^{-1}$
and increases again to
$178.9~\text{m}~\text{s}^{-1}$
and increases again to
![]() $433.3~\text{m}~\text{s}^{-1}$
when temperature increases from 220 K, to the pseudo-critical value of 307.7 K and further to 800 K, respectively. As a result, non-ideal-gas effects cannot be correctly quantified at fixed
$433.3~\text{m}~\text{s}^{-1}$
when temperature increases from 220 K, to the pseudo-critical value of 307.7 K and further to 800 K, respectively. As a result, non-ideal-gas effects cannot be correctly quantified at fixed
![]() $\mathit{Ma}_{\infty }$
.
$\mathit{Ma}_{\infty }$
.
The phase velocity (
![]() $c=\unicode[STIX]{x1D714}/\unicode[STIX]{x1D6FC}_{r}$
) shown in figure 4 is another important physical variable that characterizes the perturbation. The corresponding neutral curves are shown to indicate the region of instability. It is clear that the phase velocities within the neutral curves remain between 0.2 and 0.6. The distributions of
$c=\unicode[STIX]{x1D714}/\unicode[STIX]{x1D6FC}_{r}$
) shown in figure 4 is another important physical variable that characterizes the perturbation. The corresponding neutral curves are shown to indicate the region of instability. It is clear that the phase velocities within the neutral curves remain between 0.2 and 0.6. The distributions of
![]() $c$
in the
$c$
in the
![]() $F{-}\mathit{Re}_{\unicode[STIX]{x1D6FF}}$
diagram are similar for all the cases, i.e. an increase in
$F{-}\mathit{Re}_{\unicode[STIX]{x1D6FF}}$
diagram are similar for all the cases, i.e. an increase in
![]() $\mathit{Re}_{\unicode[STIX]{x1D6FF}}$
or
$\mathit{Re}_{\unicode[STIX]{x1D6FF}}$
or
![]() $F$
leads to a larger
$F$
leads to a larger
![]() $c$
. Non-ideal-gas effects, as well as compressibility effects, are seen to both increase the phase velocity. In accordance with an actual experimental/engineering set-up, the growth rate and phase velocity can be readily transferred into a physical
$c$
. Non-ideal-gas effects, as well as compressibility effects, are seen to both increase the phase velocity. In accordance with an actual experimental/engineering set-up, the growth rate and phase velocity can be readily transferred into a physical
![]() $x^{\ast }-F^{\ast }$
diagram using (2.5) and (4.1).
$x^{\ast }-F^{\ast }$
diagram using (2.5) and (4.1).
We show profiles of perturbations in figure 5 for
![]() $T_{\infty }^{\ast }=320~\text{K}$
and
$T_{\infty }^{\ast }=320~\text{K}$
and
![]() $T_{\infty }^{\ast }=360$
. The results are also compared for two Eckert numbers of 0.05 and 0.20. The profiles correspond to the largest growth rate in the
$T_{\infty }^{\ast }=360$
. The results are also compared for two Eckert numbers of 0.05 and 0.20. The profiles correspond to the largest growth rate in the
![]() $F{-}\mathit{Re}_{\unicode[STIX]{x1D6FF}}$
diagram shown in figure 3, and they are normalized by the amplitude of the streamwise velocity perturbation
$F{-}\mathit{Re}_{\unicode[STIX]{x1D6FF}}$
diagram shown in figure 3, and they are normalized by the amplitude of the streamwise velocity perturbation
![]() $\hat{u}$
. As shown in the figure,
$\hat{u}$
. As shown in the figure,
![]() $\hat{u}$
and
$\hat{u}$
and
![]() $\hat{v}$
are similar in all four cases. Perturbations are dominated by
$\hat{v}$
are similar in all four cases. Perturbations are dominated by
![]() $\hat{u}$
except the T320E4 case, in which
$\hat{u}$
except the T320E4 case, in which
![]() $\hat{\unicode[STIX]{x1D70C}}$
dominates the entire perturbation fields. Figure 5 demonstrates that compressibility (increase
$\hat{\unicode[STIX]{x1D70C}}$
dominates the entire perturbation fields. Figure 5 demonstrates that compressibility (increase
![]() $\mathit{Ec}_{\infty }$
) and non-ideal-gas effects (reduce
$\mathit{Ec}_{\infty }$
) and non-ideal-gas effects (reduce
![]() $T_{\infty }^{\ast }$
) both increase the amplitude of density perturbations.
$T_{\infty }^{\ast }$
) both increase the amplitude of density perturbations.
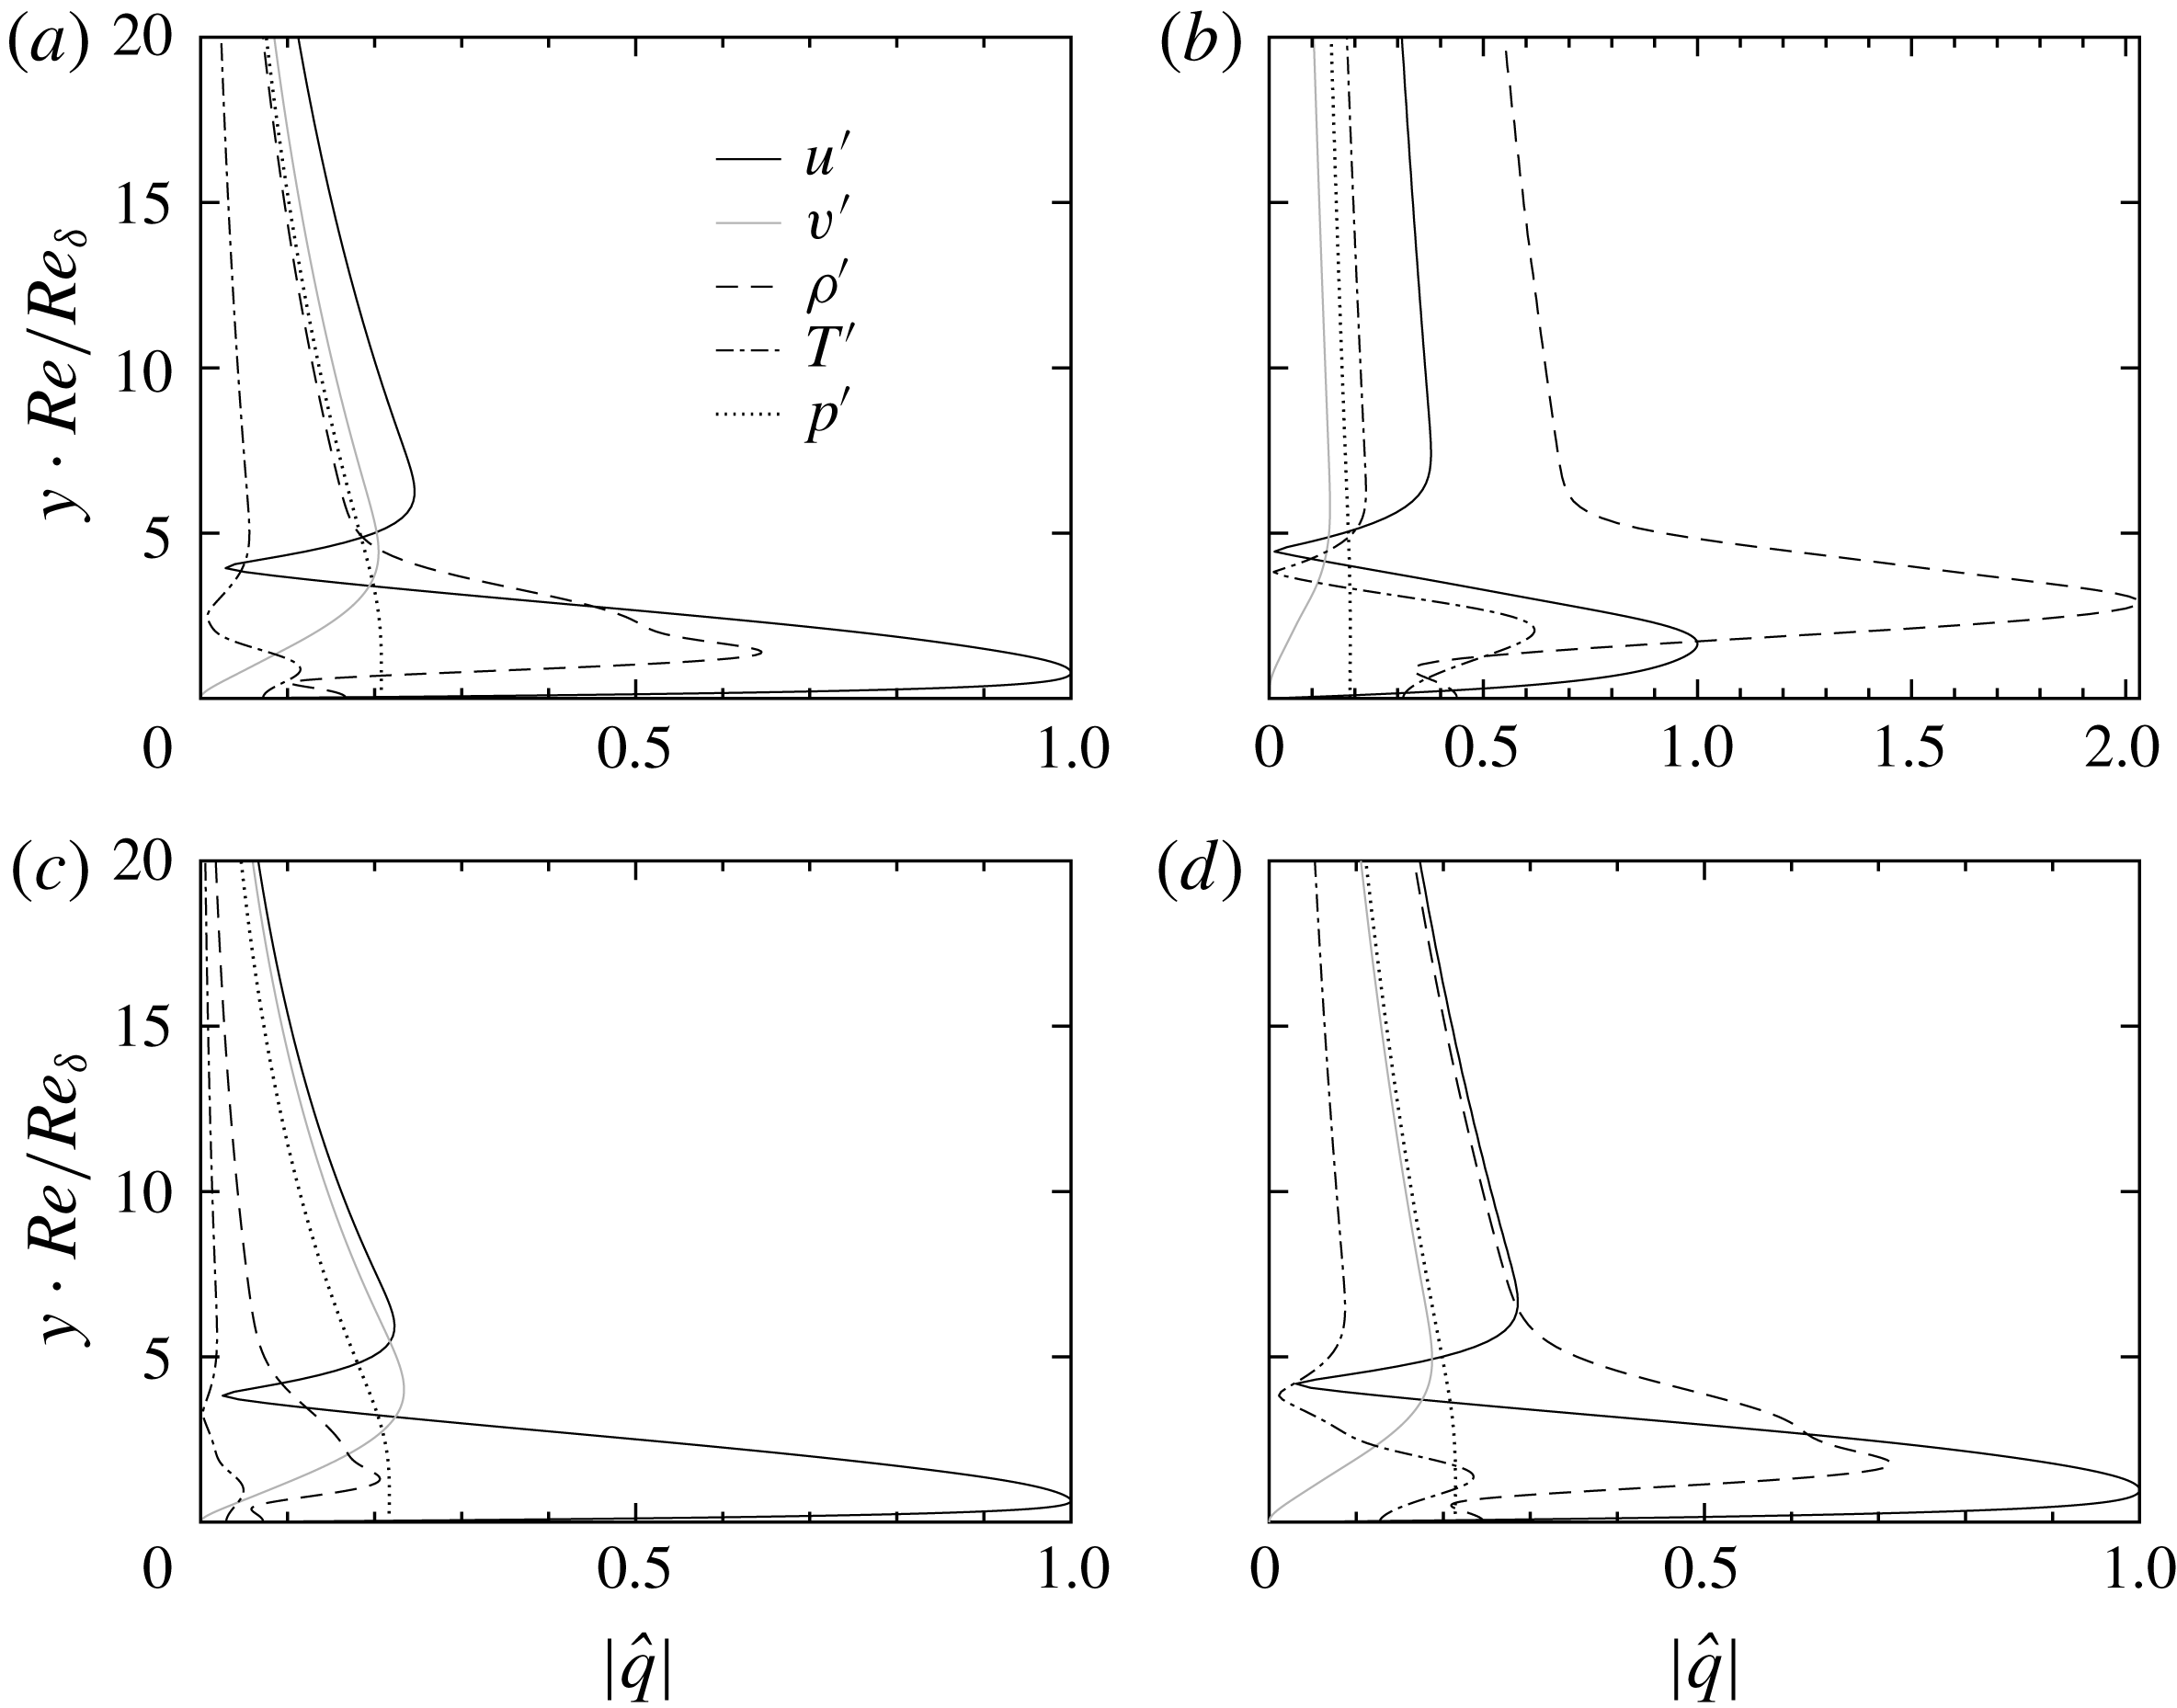
Figure 5. Profiles of the most amplified perturbations in the stability diagram of figure 4: (a)
![]() $T_{\infty }^{\ast }=320~\text{K}$
,
$T_{\infty }^{\ast }=320~\text{K}$
,
![]() $\mathit{Ec}_{\infty }=0.05$
, (b)
$\mathit{Ec}_{\infty }=0.05$
, (b)
![]() $T_{\infty }^{\ast }=320~\text{K}$
,
$T_{\infty }^{\ast }=320~\text{K}$
,
![]() $\mathit{Ec}_{\infty }=0.20$
, (c)
$\mathit{Ec}_{\infty }=0.20$
, (c)
![]() $T_{\infty }^{\ast }=360~\text{K}$
,
$T_{\infty }^{\ast }=360~\text{K}$
,
![]() $\mathit{Ec}_{\infty }=0.05$
and (d)
$\mathit{Ec}_{\infty }=0.05$
and (d)
![]() $T_{\infty }^{\ast }=360~\text{K}$
,
$T_{\infty }^{\ast }=360~\text{K}$
,
![]() $\mathit{Ec}_{\infty }=0.20$
.
$\mathit{Ec}_{\infty }=0.20$
.
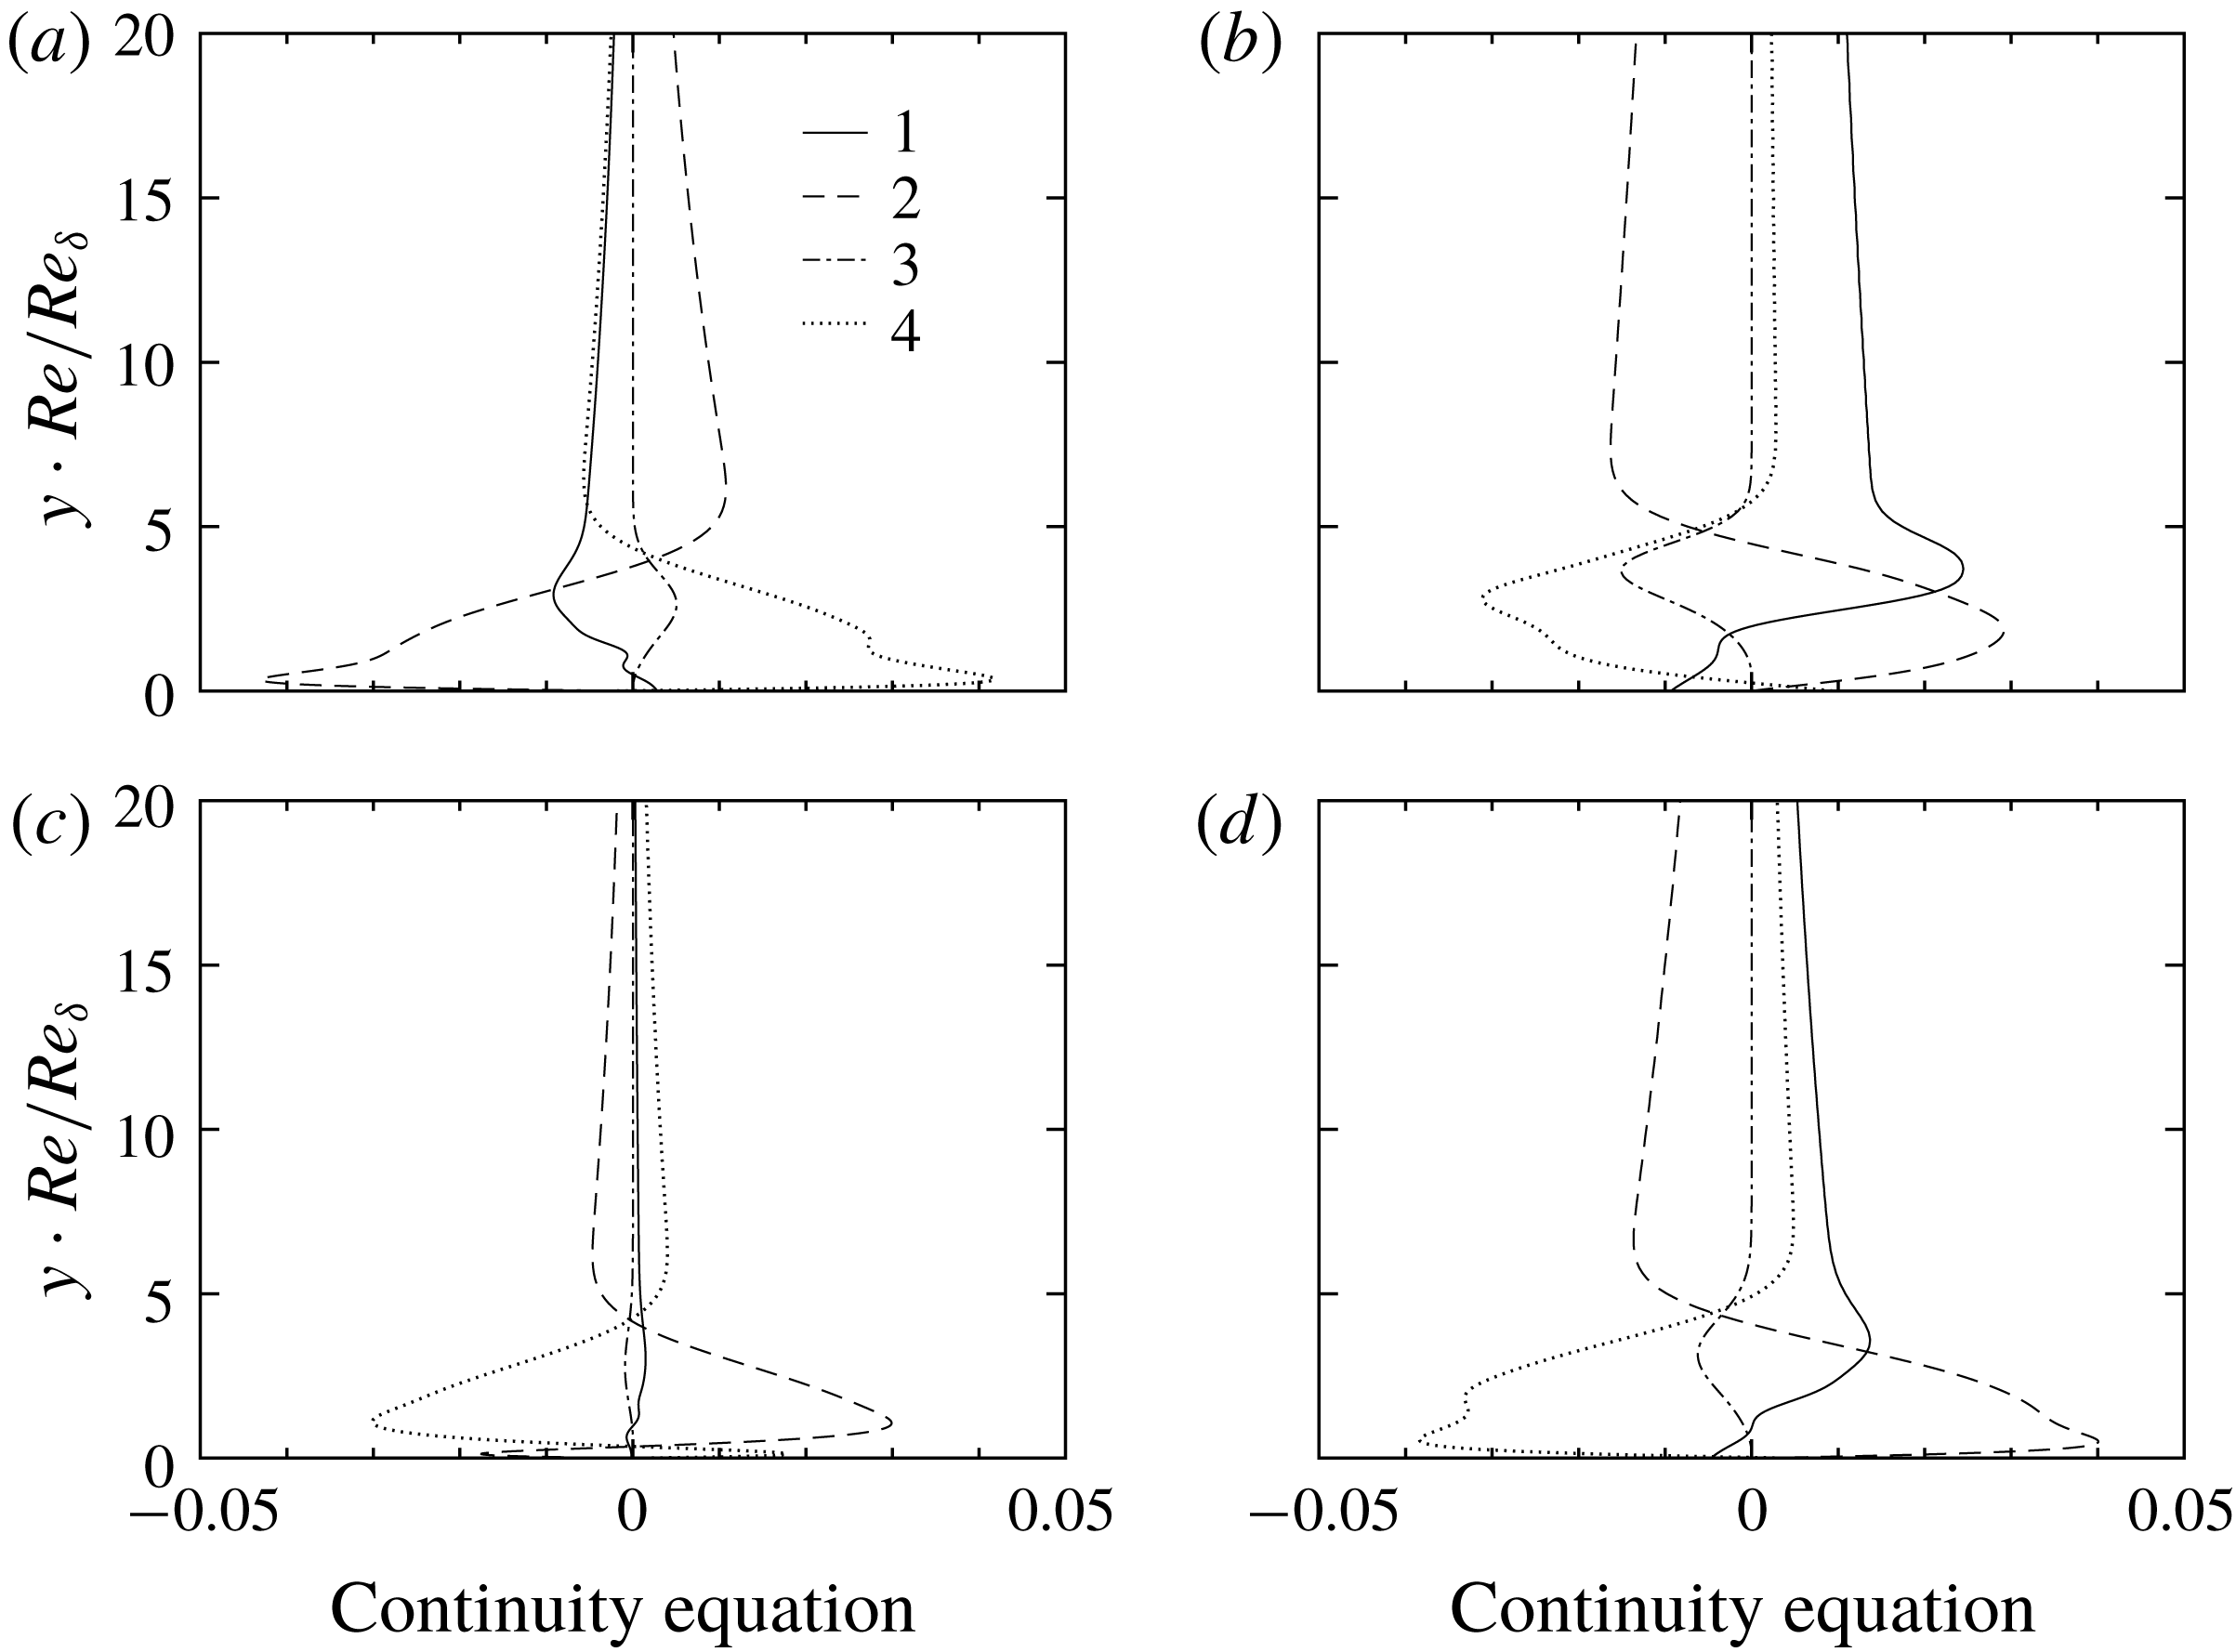
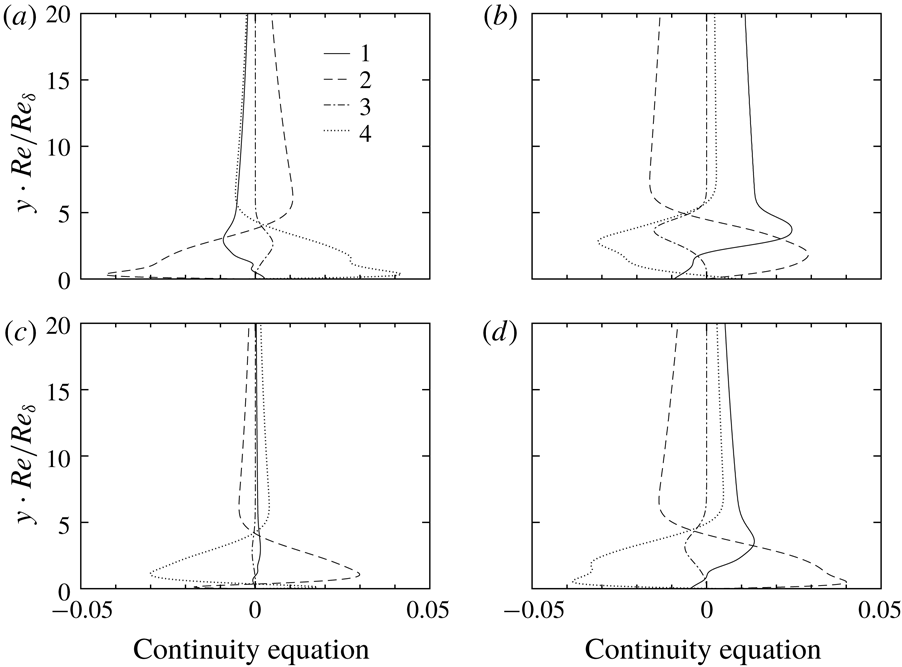
This can be explained by the balance of the linearized continuity equation,
 $$\begin{eqnarray}\underbrace{(\text{i}\unicode[STIX]{x1D6FC}u_{0}-\text{i}\unicode[STIX]{x1D714})\hat{\unicode[STIX]{x1D70C}}}_{1}+\underbrace{\text{i}\unicode[STIX]{x1D6FC}\unicode[STIX]{x1D70C}_{0}\hat{u} }_{2}+\underbrace{{\displaystyle \frac{\text{d}\unicode[STIX]{x1D70C}_{0}}{\text{d}y}}\hat{v}}_{3}+\underbrace{\unicode[STIX]{x1D70C}_{0}{\displaystyle \frac{\text{d}\hat{v}}{\text{d}y}}}_{4}=0.\end{eqnarray}$$
When non-ideal and compressibility effects are insignificant, see figure 5(c), the density gradient of the base flow is weak and, consequently,
![]() $\hat{\unicode[STIX]{x1D70C}}$
is small in amplitude. Therefore, equation (4.2) is mainly balanced by term 2 and term 4, as shown in figure 6(c). Either reducing
$\hat{\unicode[STIX]{x1D70C}}$
is small in amplitude. Therefore, equation (4.2) is mainly balanced by term 2 and term 4, as shown in figure 6(c). Either reducing
![]() $T_{\infty }^{\ast }$
or increasing
$T_{\infty }^{\ast }$
or increasing
![]() $\mathit{Ec}_{\infty }$
results in an increase of
$\mathit{Ec}_{\infty }$
results in an increase of
![]() $\text{d}\unicode[STIX]{x1D70C}_{0}/\text{d}y$
. This increase is fairly significant when
$\text{d}\unicode[STIX]{x1D70C}_{0}/\text{d}y$
. This increase is fairly significant when
![]() $T_{\infty }^{\ast }$
is close to the pseudo-critical point (see figure 2). The increase of term 3 has to be balanced with the help of term 1, namely, a comparable density perturbation.
$T_{\infty }^{\ast }$
is close to the pseudo-critical point (see figure 2). The increase of term 3 has to be balanced with the help of term 1, namely, a comparable density perturbation.
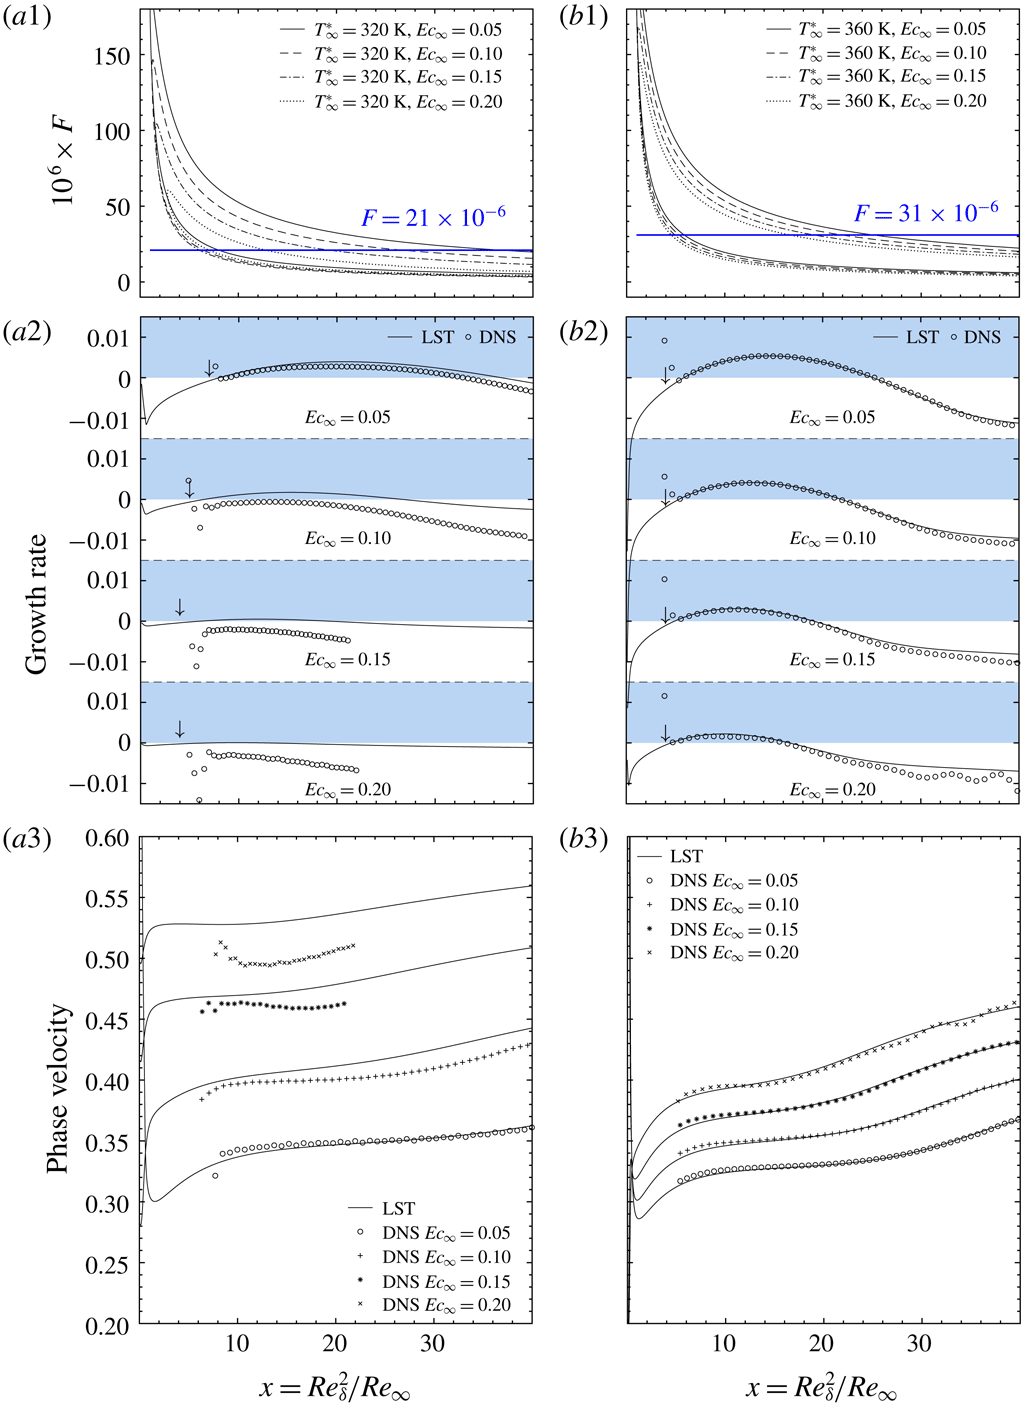
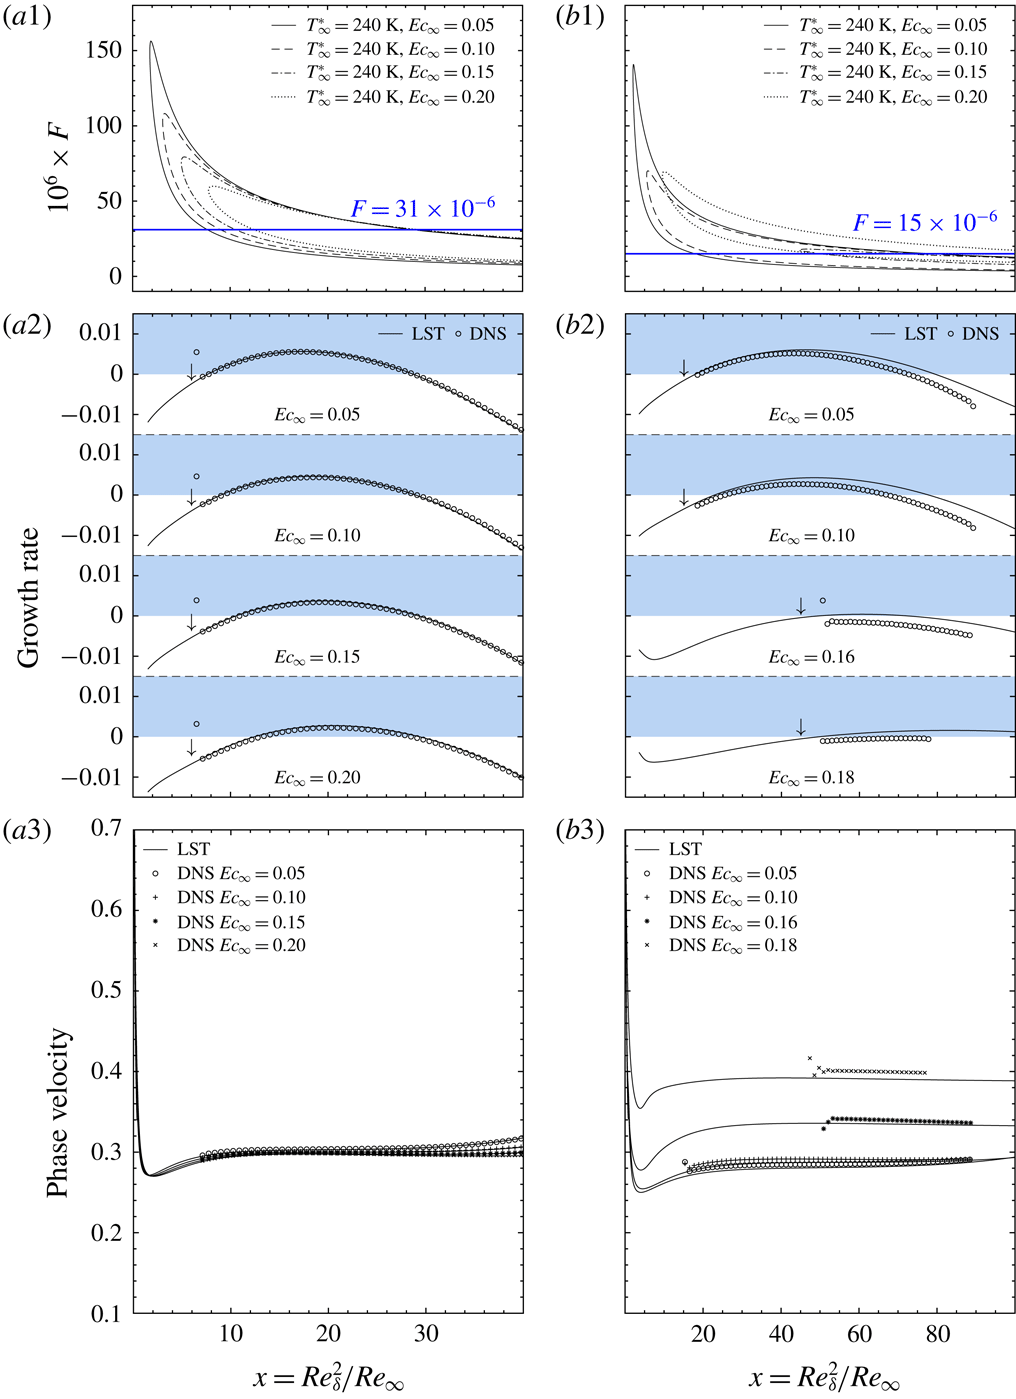
To account for possible non-parallel base flow effects and to validate the linear stability theory, DNS are performed for the T360 and T320 cases (the validation for the subcritical cases follows in the next section).
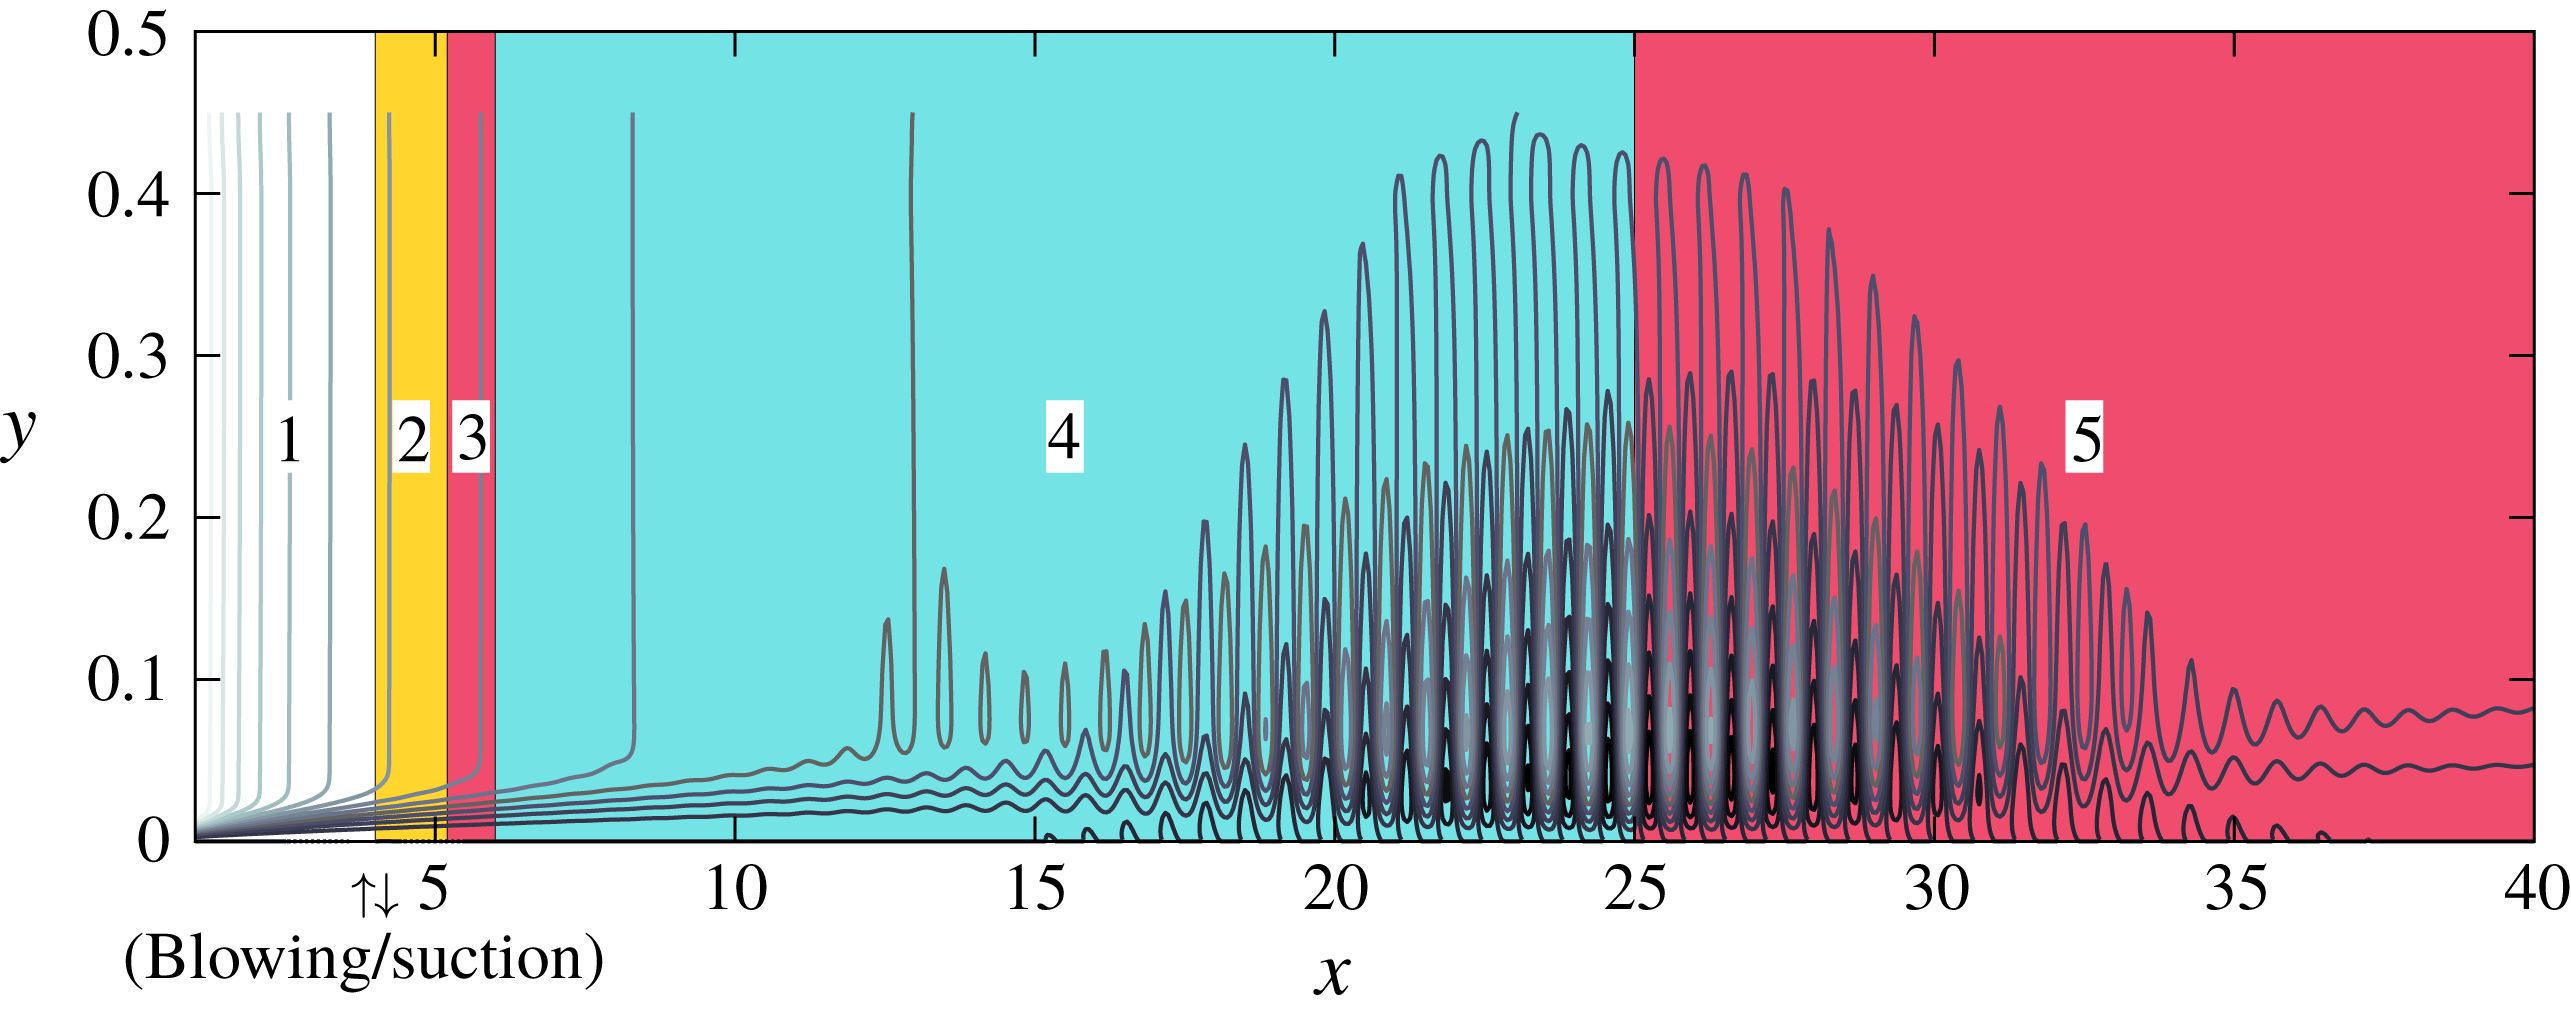
Figure 7. DNS of the T360E1 case. Contour lines of the wall-normal velocity in five coloured regions show the laminar flow (1), receptivity stage (2), modal decay before branch-I of the neutral curve (3), followed by the modal growth (4) and modal decay (5) after branch-II of the neutral curve. The up/down arrows at
![]() $x=4$
show the introduced wall blowing/suction. A movie of the perturbation development is available as a supplementary file (movie 1) at https://doi.org/10.1017/jfm.2019.348.
$x=4$
show the introduced wall blowing/suction. A movie of the perturbation development is available as a supplementary file (movie 1) at https://doi.org/10.1017/jfm.2019.348.
Figure 7 shows an example of the DNS results for the T360E1 case. Results are displayed by the contour plot of the wall-normal velocity, which nicely shows the development of the perturbation. Five physical regions can be identified: before the sinusoidal wall blowing/suction is introduced at
![]() $x=4$
to excite the T–S wave, the flow remains laminar in region 1; the receptivity process takes places in region 2, where the forced external perturbation excites the T–S waves; the perturbation is well formed in the boundary layer and starts to follow the LST prediction in region 3. This region is yet ahead of branch-I of the neutral curve, therefore, perturbations goes through modal decay until region 4; in regions 4 and 5, perturbations follow the linear stability theory and goes through a modal growth and decay.
$x=4$
to excite the T–S wave, the flow remains laminar in region 1; the receptivity process takes places in region 2, where the forced external perturbation excites the T–S waves; the perturbation is well formed in the boundary layer and starts to follow the LST prediction in region 3. This region is yet ahead of branch-I of the neutral curve, therefore, perturbations goes through modal decay until region 4; in regions 4 and 5, perturbations follow the linear stability theory and goes through a modal growth and decay.

Figure 8. DNS validation of the T320 (a1–a3) and T360 (b1–b3) cases. (a1) and (b1) show the neutral curve in the
![]() $F{-}x$
diagram. The blue solid line indicates the frequency of wall blowing/suction introduced to excite the T–S wave. (a2), (b2), (a3) and (b3) provide comparisons of the growth rate and phase velocity between DNS and LST. The arrows in (a2) and (b2) indicate the position where wall blowing/suction is introduced.
$F{-}x$
diagram. The blue solid line indicates the frequency of wall blowing/suction introduced to excite the T–S wave. (a2), (b2), (a3) and (b3) provide comparisons of the growth rate and phase velocity between DNS and LST. The arrows in (a2) and (b2) indicate the position where wall blowing/suction is introduced.
To quantitatively compare LST and DNS, figure 8(a1,b1) shows the neutral curve in the
![]() $F{-}x$
diagram. The arrow in figure 8(a2,b2) indicates the location where wall blowing/suction is introduced (upstream of branch-I of the neutral curves). The amplitude of the forced blowing/suction has been kept small (
$F{-}x$
diagram. The arrow in figure 8(a2,b2) indicates the location where wall blowing/suction is introduced (upstream of branch-I of the neutral curves). The amplitude of the forced blowing/suction has been kept small (
![]() $O(10^{-4})$
of the Mach number based on wall-normal momentum flux) so that the development of the perturbation stays in the linear regime. The frequencies
$O(10^{-4})$
of the Mach number based on wall-normal momentum flux) so that the development of the perturbation stays in the linear regime. The frequencies
![]() $F=21\times 10^{-6}$
and
$F=21\times 10^{-6}$
and
![]() $31\times 10^{-6}$
are chosen for the T320 and T360 cases respectively, which cut through the neutral curves (see figure 8
a1,b1). One would expect modal growth of the perturbation between the two branches of each neutral curve.
$31\times 10^{-6}$
are chosen for the T320 and T360 cases respectively, which cut through the neutral curves (see figure 8
a1,b1). One would expect modal growth of the perturbation between the two branches of each neutral curve.
The DNS is thoroughly compared with LST in figure 8(a2,b2,a3,b3) in terms of the growth rate and phase velocity. A local average is applied to the DNS results to remove numerical oscillations. For the T360 cases (b1–b3), the DNS and LST match very well. Small differences can be seen for the high Eckert number cases, which can be attributed to the lower growth rate and the ensuing lower amplitude of the perturbation. To calculate the growth rate (2.14), a lower amplitude of perturbations can cause a relatively larger error.
On the other hand, the flow is considerably stabilized at
![]() $T_{\infty }^{\ast }=320~\text{K}$
(figure 8
a1–a3). As can be inferred from the neutral curve (figure 8
a1), the unstable region in
$T_{\infty }^{\ast }=320~\text{K}$
(figure 8
a1–a3). As can be inferred from the neutral curve (figure 8
a1), the unstable region in
![]() $x$
is substantially reduced. Figure 8(a2,a3) shows that the DNS and LST match well at
$x$
is substantially reduced. Figure 8(a2,a3) shows that the DNS and LST match well at
![]() $\mathit{Ec}_{\infty }=0.05$
. The difference becomes larger with increasing Eckert number. In the two cases of
$\mathit{Ec}_{\infty }=0.05$
. The difference becomes larger with increasing Eckert number. In the two cases of
![]() $\mathit{Ec}_{\infty }=0.15$
and 0.20, the growth rate predicted by LST is very small, which is not completely captured by DNS. Note that we have shortened the domain of the DNS for the
$\mathit{Ec}_{\infty }=0.15$
and 0.20, the growth rate predicted by LST is very small, which is not completely captured by DNS. Note that we have shortened the domain of the DNS for the
![]() $\mathit{Ec}_{\infty }=0.15$
and 0.20 cases, the number of grid points both in
$\mathit{Ec}_{\infty }=0.15$
and 0.20 cases, the number of grid points both in
![]() $x$
and
$x$
and
![]() $y$
have been refined to make sure the results are grid independent. Differences in the phase velocity at
$y$
have been refined to make sure the results are grid independent. Differences in the phase velocity at
![]() $\mathit{Ec}_{\infty }=0.20$
also indicate that the modal instability predicted by LST (though the growth rate is small but positive) cannot be well captured in the DNS simulations. One of the possible reasons lies in the fact that in DNS the perturbed flow field is a result of multiple eigenmodes. Therefore, when the growth rate of the single unstable mode is exceedingly small, the flow field can be co-dominated by multiple decaying modes, and the post-processed growth rate and phase velocity from DNS cannot match a single mode from LST.
$\mathit{Ec}_{\infty }=0.20$
also indicate that the modal instability predicted by LST (though the growth rate is small but positive) cannot be well captured in the DNS simulations. One of the possible reasons lies in the fact that in DNS the perturbed flow field is a result of multiple eigenmodes. Therefore, when the growth rate of the single unstable mode is exceedingly small, the flow field can be co-dominated by multiple decaying modes, and the post-processed growth rate and phase velocity from DNS cannot match a single mode from LST.
The above results have confirmed that the non-ideal-gas effects stabilize the flow in the supercritical regime. The stabilization is more significant when the free-stream temperature is closer to the pseudo-critical value and/or when coupled with strong compressibility effects.
4.2 The subcritical and transcritical regimes
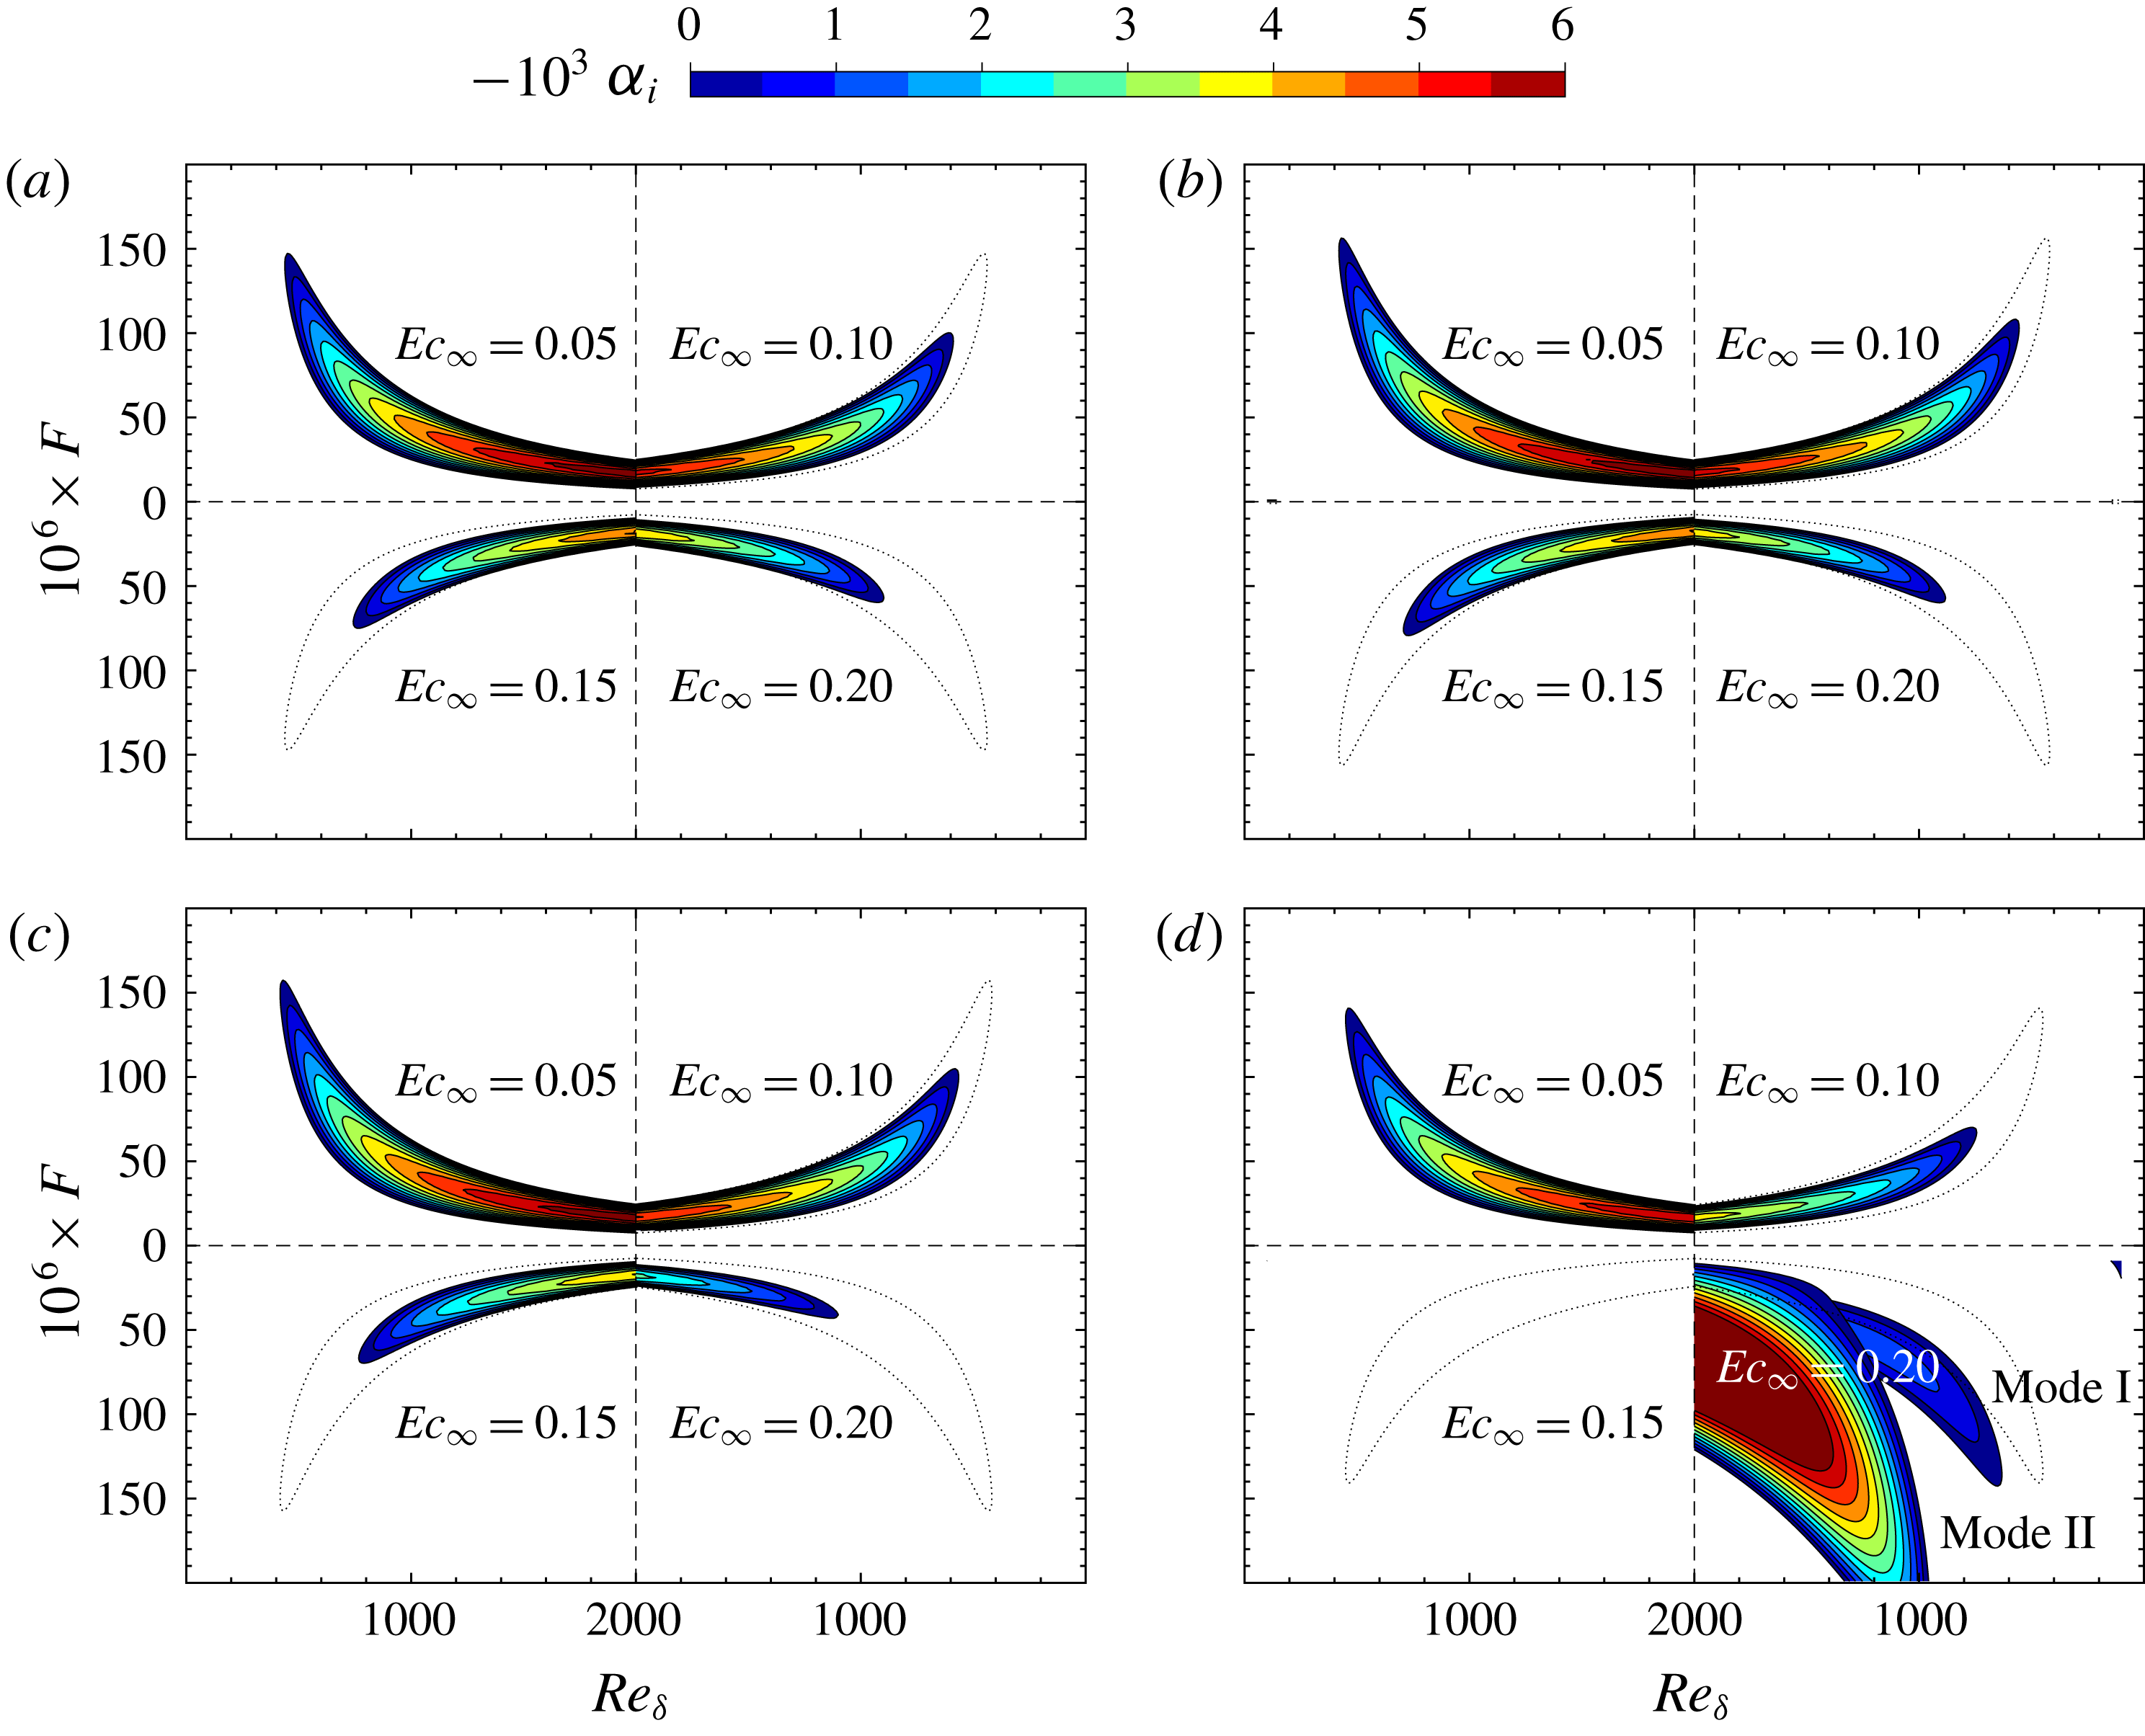
Figure 9. Growth rates of perturbations in the
![]() $F{-}\mathit{Re}_{\unicode[STIX]{x1D6FF}}$
stability diagram with subcritical free-stream temperatures: (a)
$F{-}\mathit{Re}_{\unicode[STIX]{x1D6FF}}$
stability diagram with subcritical free-stream temperatures: (a)
![]() $T_{\infty }^{\ast }=220~\text{K}$
, (b)
$T_{\infty }^{\ast }=220~\text{K}$
, (b)
![]() $T_{\infty }^{\ast }=240~\text{K}$
, (c)
$T_{\infty }^{\ast }=240~\text{K}$
, (c)
![]() $T_{\infty }^{\ast }=260~\text{K}$
and (d)
$T_{\infty }^{\ast }=260~\text{K}$
and (d)
![]() $T_{\infty }^{\ast }=280~\text{K}$
.
$T_{\infty }^{\ast }=280~\text{K}$
.
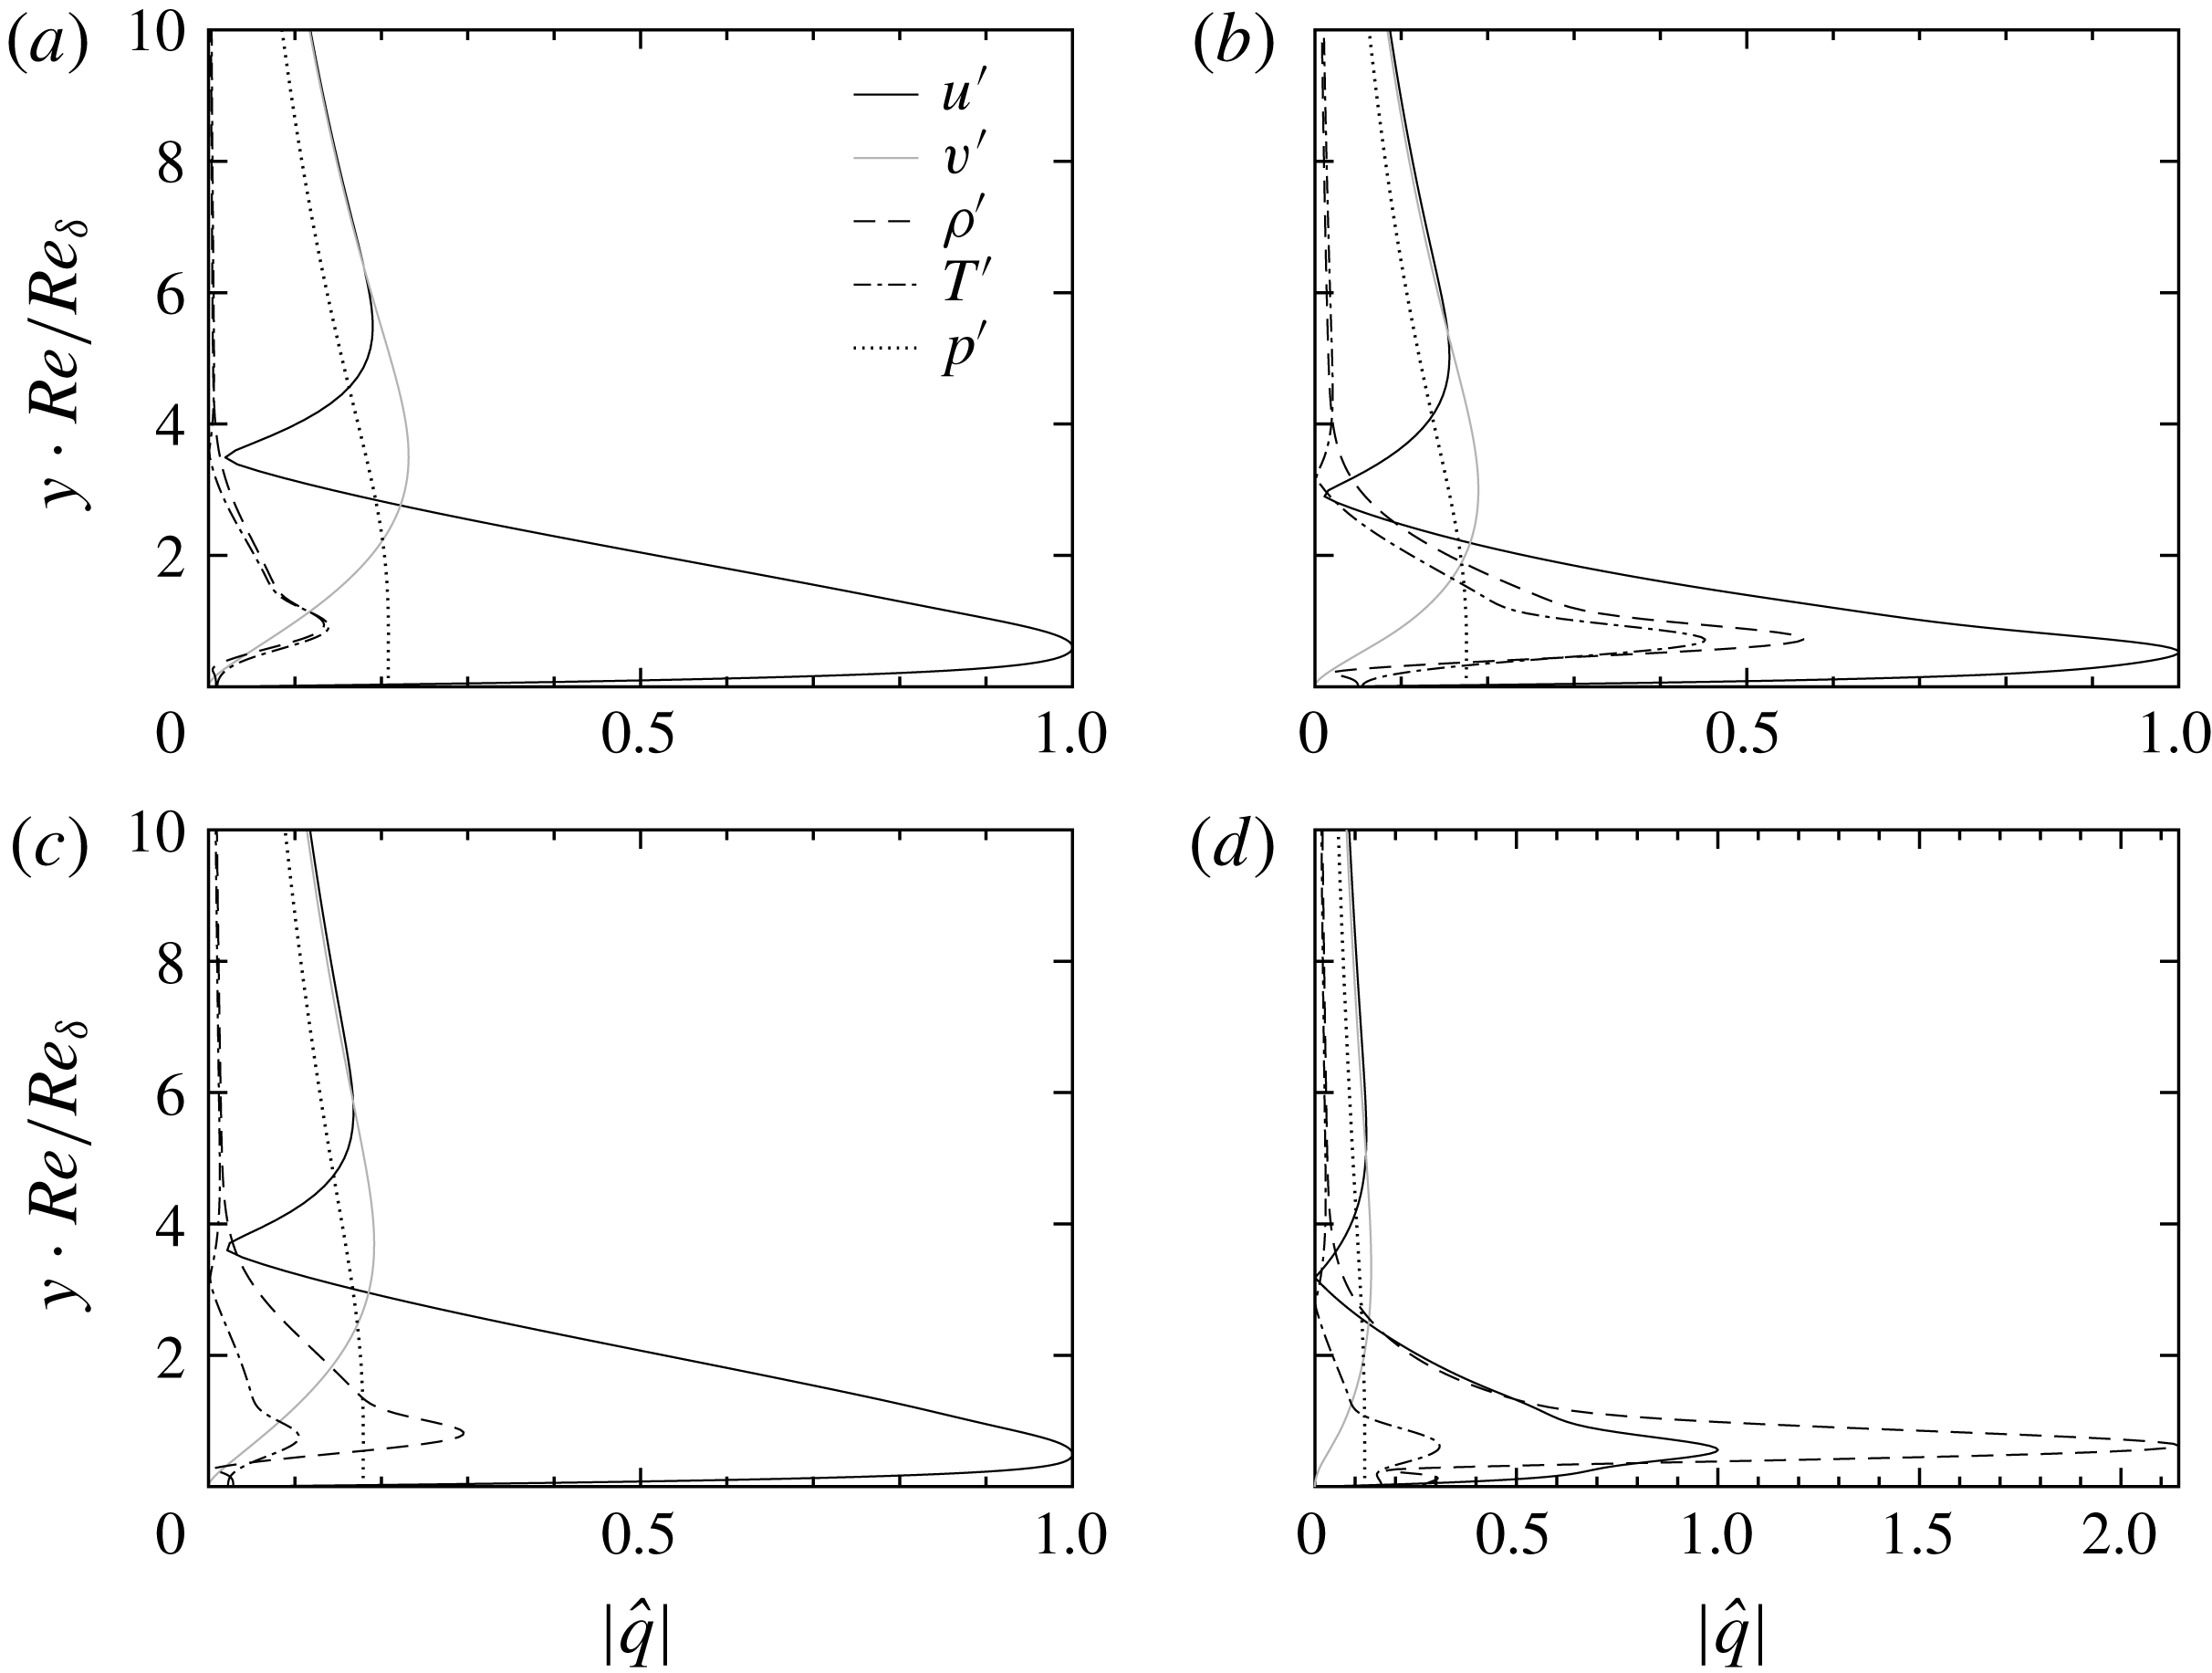
Figure 10. Profiles of the most amplified perturbations in the stability diagram of figure 9: (a)
![]() $T_{\infty }^{\ast }=240~\text{K}$
,
$T_{\infty }^{\ast }=240~\text{K}$
,
![]() $\mathit{Ec}_{\infty }=0.05$
, (b)
$\mathit{Ec}_{\infty }=0.05$
, (b)
![]() $T_{\infty }^{\ast }=240~\text{K}$
,
$T_{\infty }^{\ast }=240~\text{K}$
,
![]() $\mathit{Ec}_{\infty }=0.20$
, (c)
$\mathit{Ec}_{\infty }=0.20$
, (c)
![]() $T_{\infty }^{\ast }=280~\text{K}$
,
$T_{\infty }^{\ast }=280~\text{K}$
,
![]() $\mathit{Ec}_{\infty }=0.05$
and (d)
$\mathit{Ec}_{\infty }=0.05$
and (d)
![]() $T_{\infty }^{\ast }=280~\text{K}$
,
$T_{\infty }^{\ast }=280~\text{K}$
,
![]() $\mathit{Ec}_{\infty }=0.15$
.
$\mathit{Ec}_{\infty }=0.15$
.
In this section, we discuss cases with subcritical free-stream temperatures (T220, T240, T260 and T280). Recall the base flow in § 3, the laminar flow stays in the subcritical regime except for the transcritical case with
![]() $T_{\infty }^{\ast }=280~\text{K}$
and
$T_{\infty }^{\ast }=280~\text{K}$
and
![]() $\mathit{Ec}_{\infty }$
sufficiently large (T280E4).
$\mathit{Ec}_{\infty }$
sufficiently large (T280E4).
The growth rates for these cases are shown in figure 9. Comparing the four quadrants in each panel, it can be seen that the flow is stabilized by increasing
![]() $\mathit{Ec}_{\infty }$
in the subcritical regime. Similar to the supercritical regime, non-ideal-gas effects (increase in
$\mathit{Ec}_{\infty }$
in the subcritical regime. Similar to the supercritical regime, non-ideal-gas effects (increase in
![]() $T_{\infty }^{\ast }$
) further stabilize the subcritical flows. In the subcritical regime, the perturbation profiles for cases T240E1, T240E4, T280E1 and T280E3 are provided in figure 10. Recalling the discussion for the supercritical regime, the profiles in the subcritical regime follow a similar trend: the compressibility and non-ideal-gas effects increase the amplitude of the density perturbation due to the increase of the base flow’s density gradient
$T_{\infty }^{\ast }$
) further stabilize the subcritical flows. In the subcritical regime, the perturbation profiles for cases T240E1, T240E4, T280E1 and T280E3 are provided in figure 10. Recalling the discussion for the supercritical regime, the profiles in the subcritical regime follow a similar trend: the compressibility and non-ideal-gas effects increase the amplitude of the density perturbation due to the increase of the base flow’s density gradient
![]() $\unicode[STIX]{x2202}\unicode[STIX]{x1D70C}_{0}/\unicode[STIX]{x2202}y$
and the balancing mechanism of the linearized continuity equation. To avoid repetition, the quantitative DNS validation of the stabilization of non-ideal-gas effects in the subcritical regime has been provided in appendix C.
$\unicode[STIX]{x2202}\unicode[STIX]{x1D70C}_{0}/\unicode[STIX]{x2202}y$
and the balancing mechanism of the linearized continuity equation. To avoid repetition, the quantitative DNS validation of the stabilization of non-ideal-gas effects in the subcritical regime has been provided in appendix C.
More attention shall be paid to the T280 cases in figure 9(d). The stability of the base flow noticeably increases with growing Eckert number. For instance, at
![]() $\mathit{Ec}_{\infty }=0.15$
no modal instability can be seen for Reynolds numbers up to
$\mathit{Ec}_{\infty }=0.15$
no modal instability can be seen for Reynolds numbers up to
![]() $\mathit{Re}_{\unicode[STIX]{x1D6FF}}=2000$
. After the base flow crosses the pseudo-critical point (at
$\mathit{Re}_{\unicode[STIX]{x1D6FF}}=2000$
. After the base flow crosses the pseudo-critical point (at
![]() $\mathit{Ec}_{\infty }=0.20$
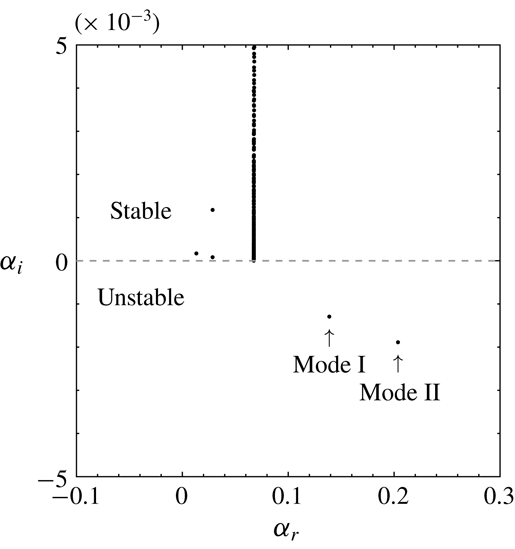
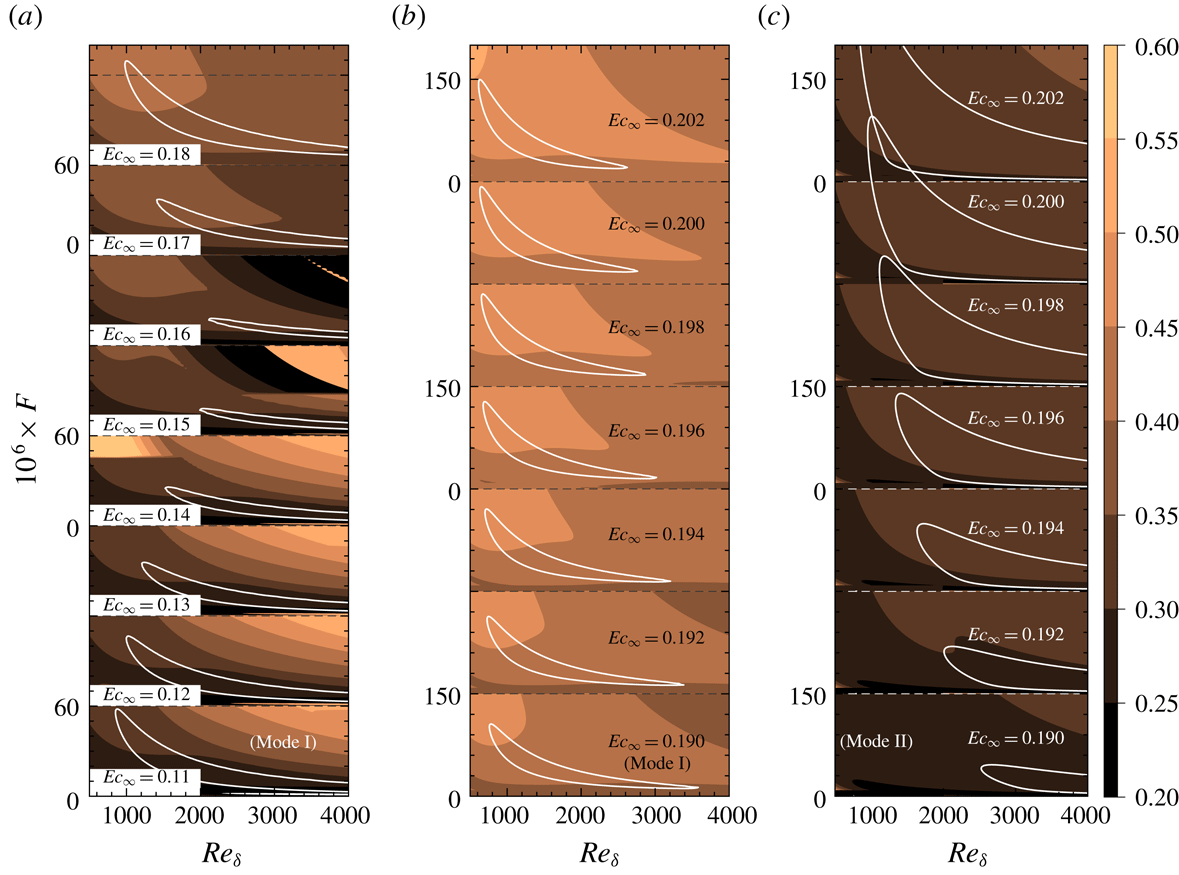
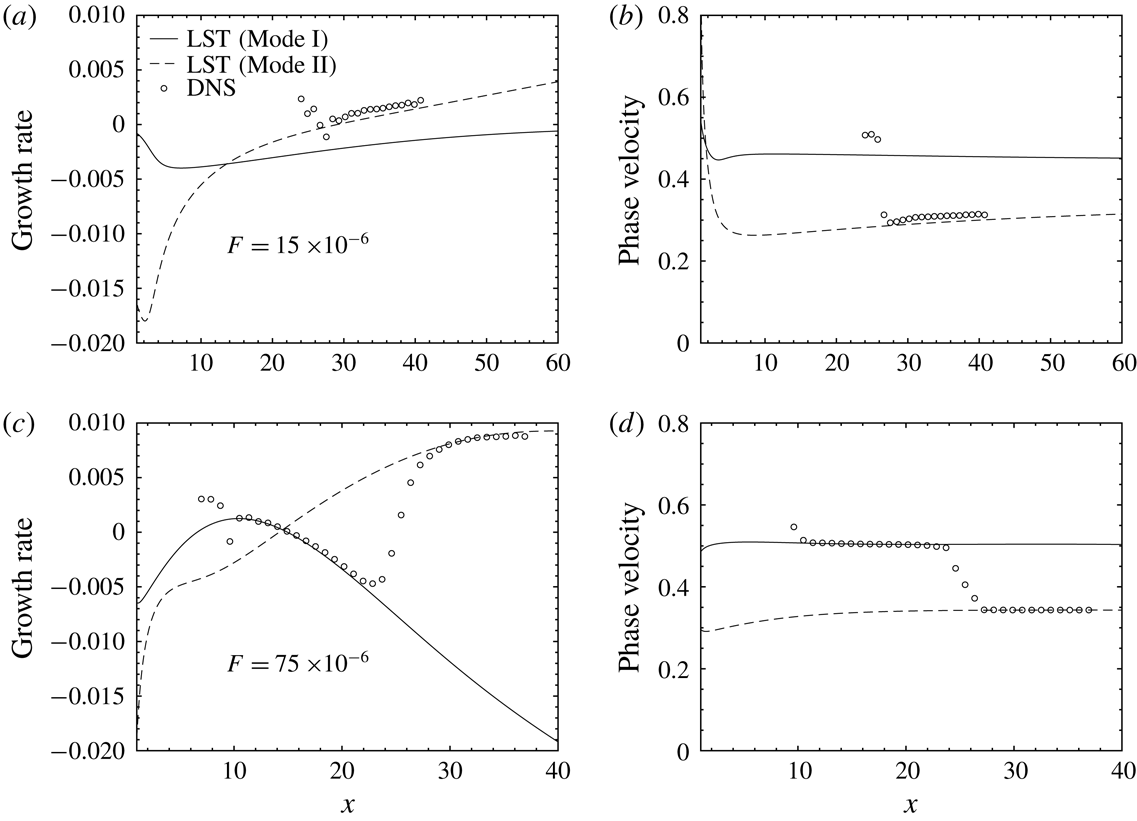
), a co-existence of dual unstable modes is observed, which we term Mode I and Mode II. The neutral curve of Mode I has a similar shape to the subcritical regime, while Mode II has a much larger growth rate and unstable band. For this case, a typical eigenspectrum is provided in figure 11 with
$\mathit{Ec}_{\infty }=0.20$
), a co-existence of dual unstable modes is observed, which we term Mode I and Mode II. The neutral curve of Mode I has a similar shape to the subcritical regime, while Mode II has a much larger growth rate and unstable band. For this case, a typical eigenspectrum is provided in figure 11 with
![]() $\mathit{Re}_{\infty }=1500$
and
$\mathit{Re}_{\infty }=1500$
and
![]() $F=45\times 10^{-6}$
. As it can be clearly inferred, both modes are unstable with the eigenvalue of
$F=45\times 10^{-6}$
. As it can be clearly inferred, both modes are unstable with the eigenvalue of
![]() $\unicode[STIX]{x1D6FC}=0.1338{-}0.001293i$
(Mode I) and
$\unicode[STIX]{x1D6FC}=0.1338{-}0.001293i$
(Mode I) and
![]() $\unicode[STIX]{x1D6FC}=0.2037{-}0.001887i$
(Mode II). As such, it can be concluded that with increasing Eckert number, the non-ideal-gas effects initially stabilize Mode I. However, after the base flow becomes transcritical, Mode II emerges and finally dominates the instability.
$\unicode[STIX]{x1D6FC}=0.2037{-}0.001887i$
(Mode II). As such, it can be concluded that with increasing Eckert number, the non-ideal-gas effects initially stabilize Mode I. However, after the base flow becomes transcritical, Mode II emerges and finally dominates the instability.
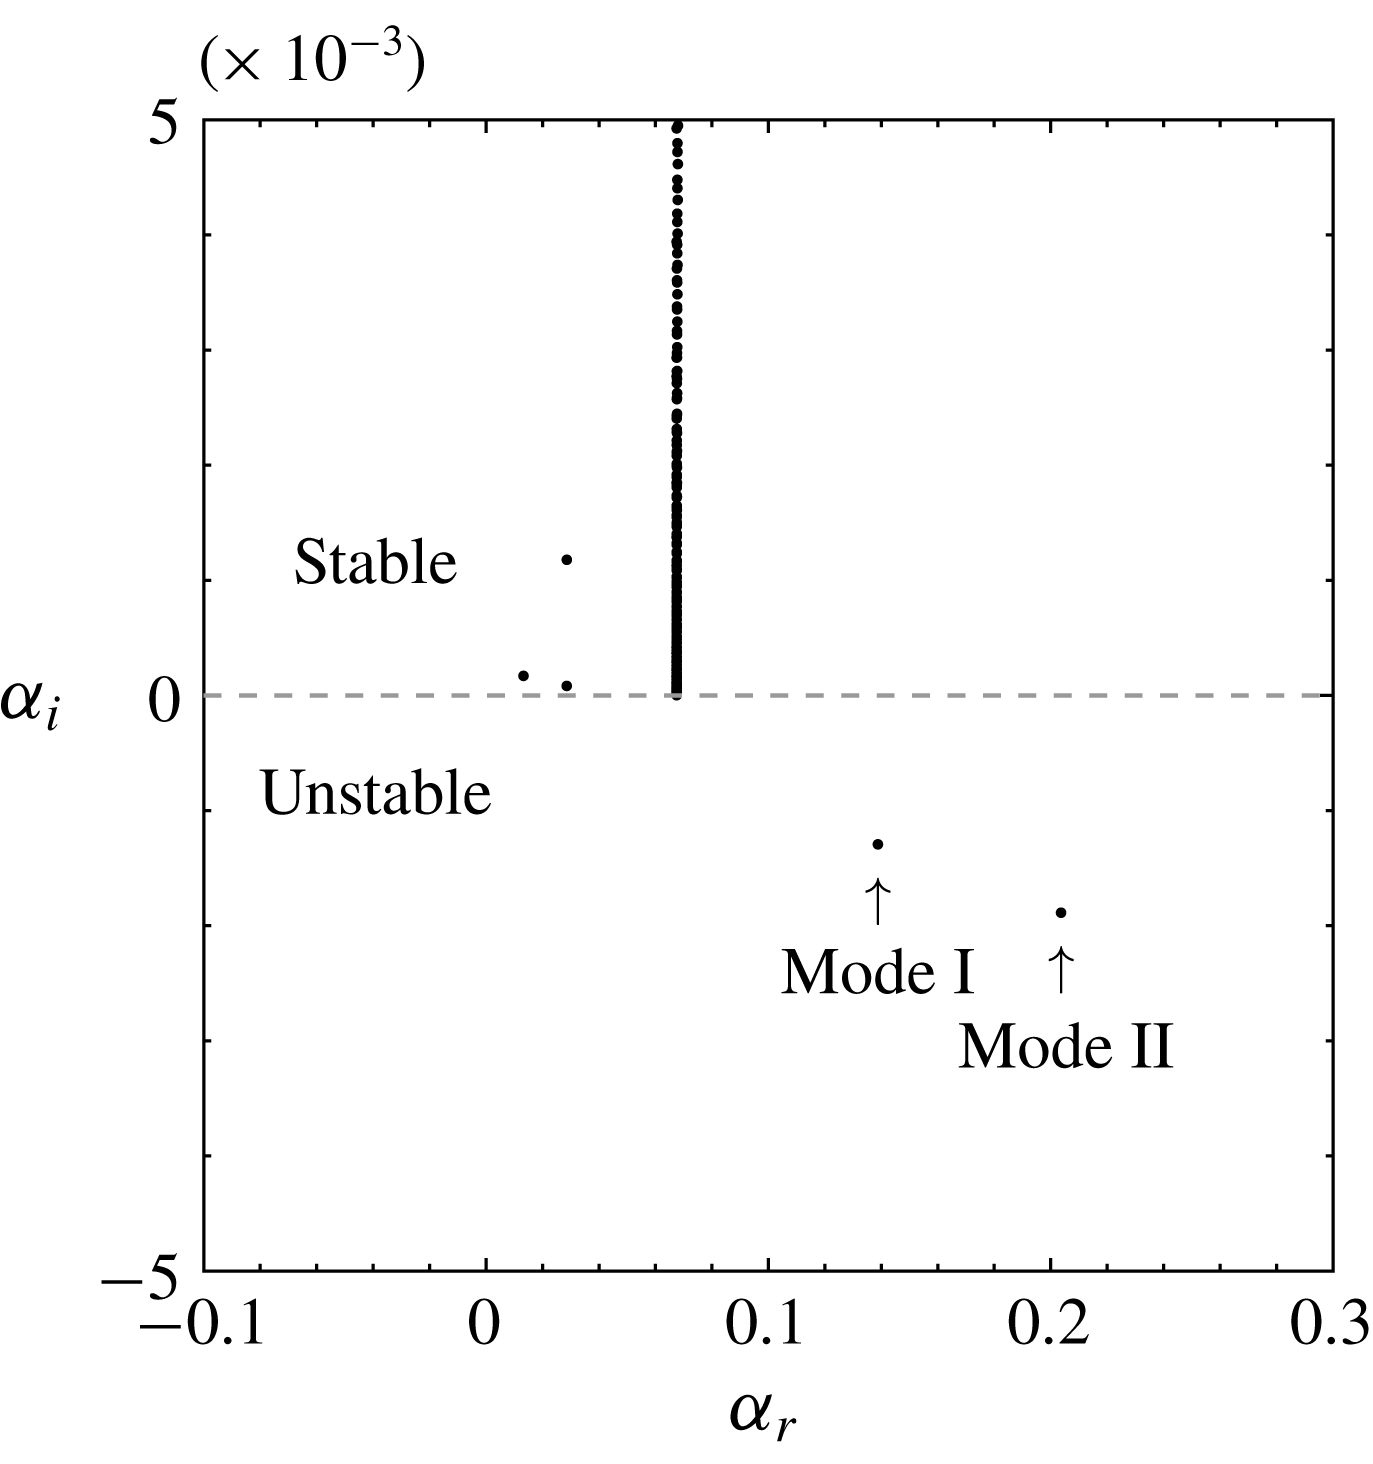
Figure 11. Eigenspectrum of the transcritical case with
![]() $T_{\infty }^{\ast }=280~\text{K}$
,
$T_{\infty }^{\ast }=280~\text{K}$
,
![]() $\mathit{Ec}_{\infty }=0.20$
,
$\mathit{Ec}_{\infty }=0.20$
,
![]() $\mathit{Re}_{\unicode[STIX]{x1D6FF}}=1500$
and
$\mathit{Re}_{\unicode[STIX]{x1D6FF}}=1500$
and
![]() $F=45\times 10^{-6}$
. The dual modes are highlighted with arrows.
$F=45\times 10^{-6}$
. The dual modes are highlighted with arrows.
To further explore the transcritical regime for the T280 cases, we show in figures 12 and 13 the detailed evolution of the growth rate and phase velocity on gradually increasing the Eckert number from
![]() $\mathit{Ec}_{\infty }=0.11$
to
$\mathit{Ec}_{\infty }=0.11$
to
![]() $\mathit{Ec}_{\infty }=0.202$
. In order to show the compelling stabilizing effect as observed in figure 9(d) (at
$\mathit{Ec}_{\infty }=0.202$
. In order to show the compelling stabilizing effect as observed in figure 9(d) (at
![]() $\mathit{Ec}_{\infty }=0.15$
), the range of
$\mathit{Ec}_{\infty }=0.15$
), the range of
![]() $\mathit{Re}_{\unicode[STIX]{x1D6FF}}$
has been extended to
$\mathit{Re}_{\unicode[STIX]{x1D6FF}}$
has been extended to
![]() $\mathit{Re}_{\unicode[STIX]{x1D6FF}}=4000$
. Figure 12(a,b) shows the neutral curve of Mode I, while in figure 12(c) we show Mode II that becomes unstable at
$\mathit{Re}_{\unicode[STIX]{x1D6FF}}=4000$
. Figure 12(a,b) shows the neutral curve of Mode I, while in figure 12(c) we show Mode II that becomes unstable at
![]() $\mathit{Ec}_{\infty }\geqslant 0.19$
. It appears that the maximum critical Reynolds number
$\mathit{Ec}_{\infty }\geqslant 0.19$
. It appears that the maximum critical Reynolds number
![]() $\mathit{Re}_{\unicode[STIX]{x1D6FF}}$
occurs at
$\mathit{Re}_{\unicode[STIX]{x1D6FF}}$
occurs at
![]() $\mathit{Ec}_{\infty }=0.16$
. The flow enters the transcritical regime (the temperature crosses the pseudo-critical point) at
$\mathit{Ec}_{\infty }=0.16$
. The flow enters the transcritical regime (the temperature crosses the pseudo-critical point) at
![]() $\mathit{Ec}_{\infty }\geqslant 0.17$
, and the growth rate and the extent of the neutral curve of Mode I again increase. Figure 12(b) shows the evolution of Mode I in the transcritical regime. With an increase in
$\mathit{Ec}_{\infty }\geqslant 0.17$
, and the growth rate and the extent of the neutral curve of Mode I again increase. Figure 12(b) shows the evolution of Mode I in the transcritical regime. With an increase in
![]() $\mathit{Ec}_{\infty }$
, the range of unstable
$\mathit{Ec}_{\infty }$
, the range of unstable
![]() $\mathit{Re}_{\unicode[STIX]{x1D6FF}}$
decreases, while the range for unstable
$\mathit{Re}_{\unicode[STIX]{x1D6FF}}$
decreases, while the range for unstable
![]() $F$
increases. Most noteworthy is the growth rate of Mode II, shown in figure 12(c), which increases much faster with
$F$
increases. Most noteworthy is the growth rate of Mode II, shown in figure 12(c), which increases much faster with
![]() $\mathit{Ec}_{\infty }$
and becomes much larger than Mode I. This indicates that the flow in the transcritical regime is significantly destabilized by non-ideal-gas effects through Mode II. In addition, we also show the development of the phase velocity in figure 13. The phase velocity of Mode I remains between 0.2 and 0.54, while Mode II is between 0.3 and 0.35. Both increase with Eckert number.
$\mathit{Ec}_{\infty }$
and becomes much larger than Mode I. This indicates that the flow in the transcritical regime is significantly destabilized by non-ideal-gas effects through Mode II. In addition, we also show the development of the phase velocity in figure 13. The phase velocity of Mode I remains between 0.2 and 0.54, while Mode II is between 0.3 and 0.35. Both increase with Eckert number.

Figure 12. Growth rates of perturbations in the
![]() $F{-}\mathit{Re}_{\unicode[STIX]{x1D6FF}}$
stability diagram with
$F{-}\mathit{Re}_{\unicode[STIX]{x1D6FF}}$
stability diagram with
![]() $T_{\infty }^{\ast }=280~\text{K}$
. (a)
$T_{\infty }^{\ast }=280~\text{K}$
. (a)
![]() $\mathit{Ec}_{\infty }=0.11,0.12,\ldots ,0.19$
, (b)
$\mathit{Ec}_{\infty }=0.11,0.12,\ldots ,0.19$
, (b)
![]() $\mathit{Ec}_{\infty }=0.190$
,
$\mathit{Ec}_{\infty }=0.190$
,
![]() $0.192,\ldots ,0.202$
(Mode I), (c)
$0.192,\ldots ,0.202$
(Mode I), (c)
![]() $\mathit{Ec}_{\infty }=0.190$
,
$\mathit{Ec}_{\infty }=0.190$
,
![]() $0.192,\ldots ,0.202$
(Mode II).
$0.192,\ldots ,0.202$
(Mode II).

Figure 13. Phase velocities of perturbations in the
![]() $F{-}\mathit{Re}_{\unicode[STIX]{x1D6FF}}$
stability diagram with
$F{-}\mathit{Re}_{\unicode[STIX]{x1D6FF}}$
stability diagram with
![]() $T_{\infty }^{\ast }=280~\text{K}$
. (a)
$T_{\infty }^{\ast }=280~\text{K}$
. (a)
![]() $\mathit{Ec}_{\infty }=0.11,0.12,\ldots ,0.19$
, (b)
$\mathit{Ec}_{\infty }=0.11,0.12,\ldots ,0.19$
, (b)
![]() $\mathit{Ec}_{\infty }=0.190$
,
$\mathit{Ec}_{\infty }=0.190$
,
![]() $0.192,\ldots ,0.202$
(Mode I), (c)
$0.192,\ldots ,0.202$
(Mode I), (c)
![]() $\mathit{Ec}_{\infty }=0.190,0.192,\ldots ,0.202$
(Mode II).
$\mathit{Ec}_{\infty }=0.190,0.192,\ldots ,0.202$
(Mode II).
Similar to the super- and subcritical cases discussed before, we also use DNS to validate the results from LST and to confirm the co-existence of the dual modes, as well as the dominance of Mode II. We show the neutral curve for
![]() $\mathit{Ec}_{\infty }=0.20$
(case T280E4) in the
$\mathit{Ec}_{\infty }=0.20$
(case T280E4) in the
![]() $F{-}x$
diagram in figure 14. Mode II has a much larger unstable region both in terms of
$F{-}x$
diagram in figure 14. Mode II has a much larger unstable region both in terms of
![]() $F$
and
$F$
and
![]() $x$
. In order to properly observe the two modes, the flow is perturbed with frequencies of
$x$
. In order to properly observe the two modes, the flow is perturbed with frequencies of
![]() $F_{1}=15\times 10^{-6}$
and
$F_{1}=15\times 10^{-6}$
and
![]() $F_{2}=75\times 10^{-6}$
, respectively. From the LST prediction in figure 14, the forced frequency
$F_{2}=75\times 10^{-6}$
, respectively. From the LST prediction in figure 14, the forced frequency
![]() $F_{1}$
shall excite Mode II on entering the neutral curve, and the perturbation of frequency
$F_{1}$
shall excite Mode II on entering the neutral curve, and the perturbation of frequency
![]() $F_{2}$
will be modulated by Mode I and II sequentially.
$F_{2}$
will be modulated by Mode I and II sequentially.
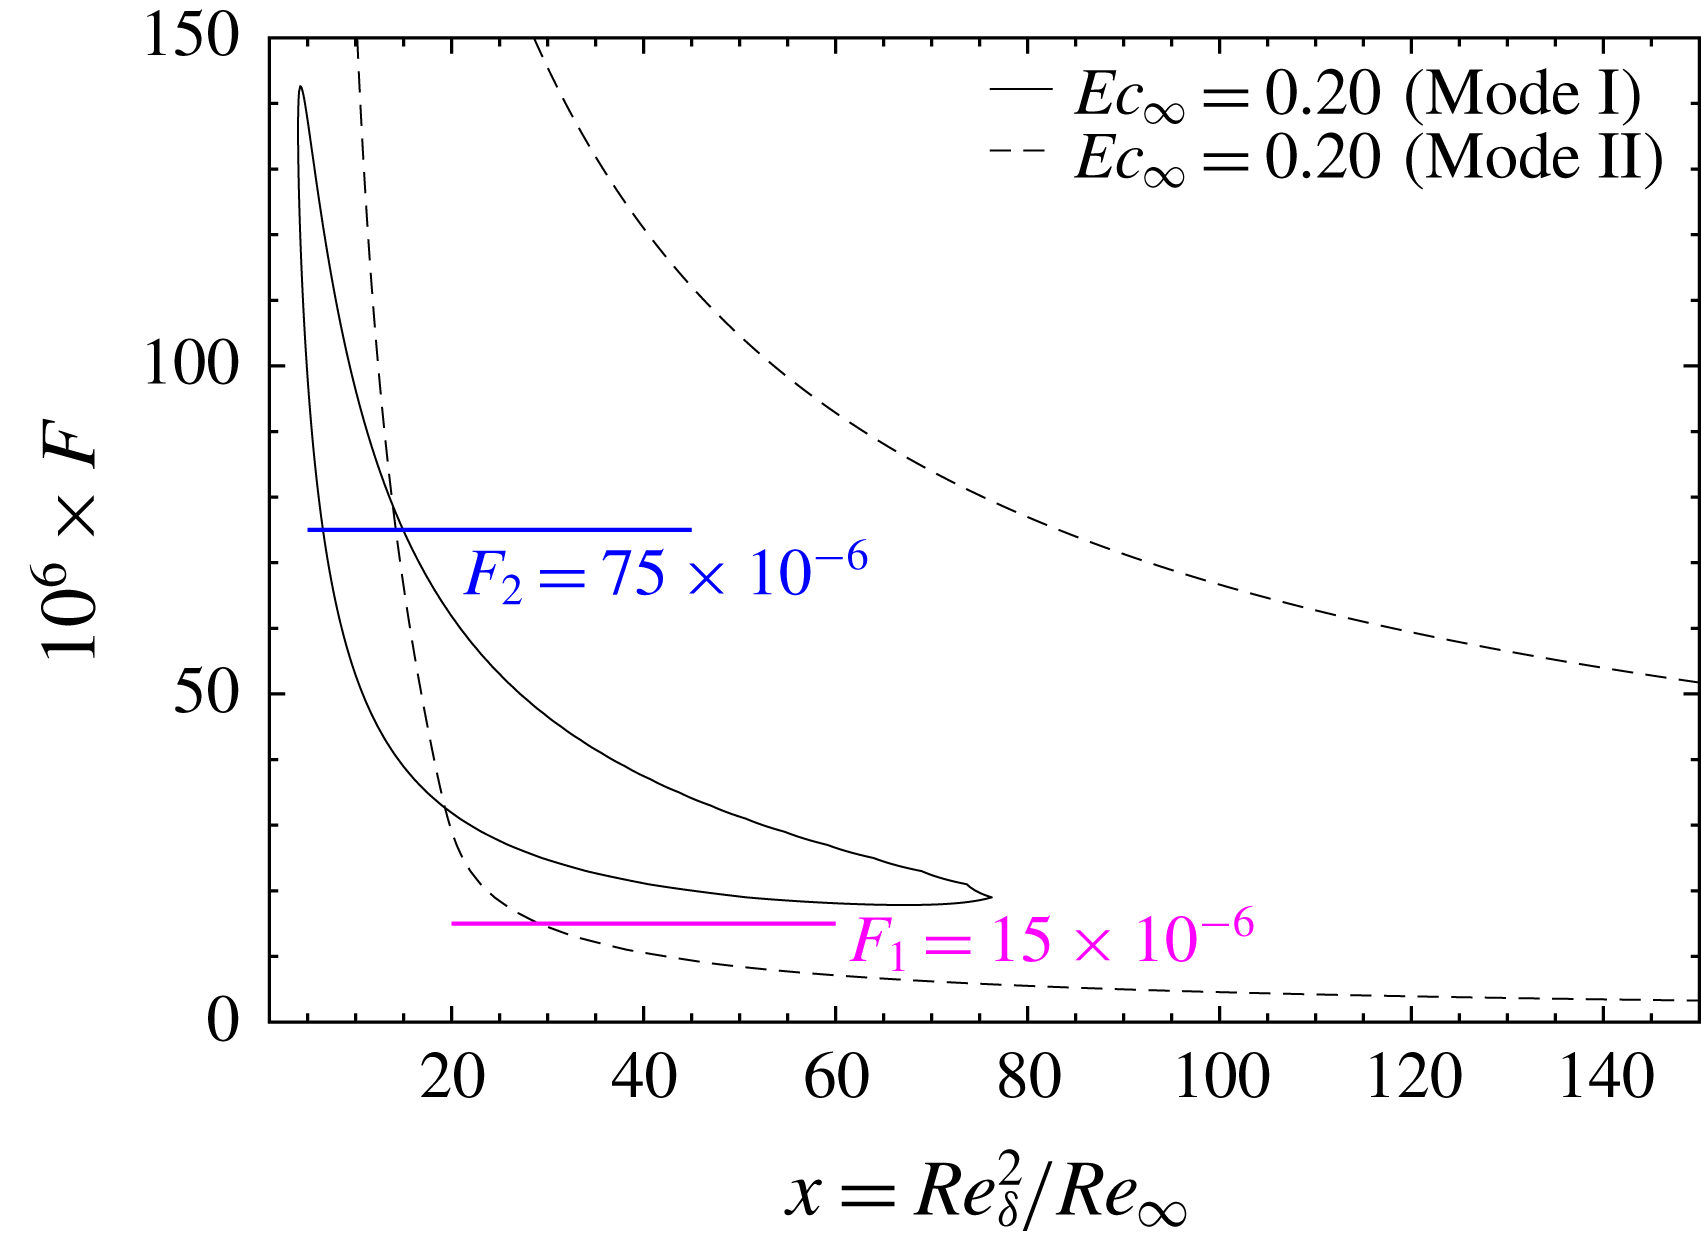
Figure 14. Neutral curve of the T280E4 case in the
![]() $F{-}x$
diagram. The magenta and blue lines indicate the domain and frequency
$F{-}x$
diagram. The magenta and blue lines indicate the domain and frequency
![]() $F_{1}=15\times 10^{-6}$
and
$F_{1}=15\times 10^{-6}$
and
![]() $F_{2}=75\times 10^{-6}$
simulated in the DNS.
$F_{2}=75\times 10^{-6}$
simulated in the DNS.
Figure 15 shows the DNS validation, where the growth rate and phase velocity are compared with LST. In the
![]() $F_{1}$
case, the perturbation grows due to the positive growth rate of Mode II. In the
$F_{1}$
case, the perturbation grows due to the positive growth rate of Mode II. In the
![]() $F_{2}$
case, the instability is initially dominated by Mode I and sequentially by Mode II, due to the cross-over of the growth rates of the two modes as shown in figure 15(c). In both cases, the DNS matches well with the LST predictions.
$F_{2}$
case, the instability is initially dominated by Mode I and sequentially by Mode II, due to the cross-over of the growth rates of the two modes as shown in figure 15(c). In both cases, the DNS matches well with the LST predictions.
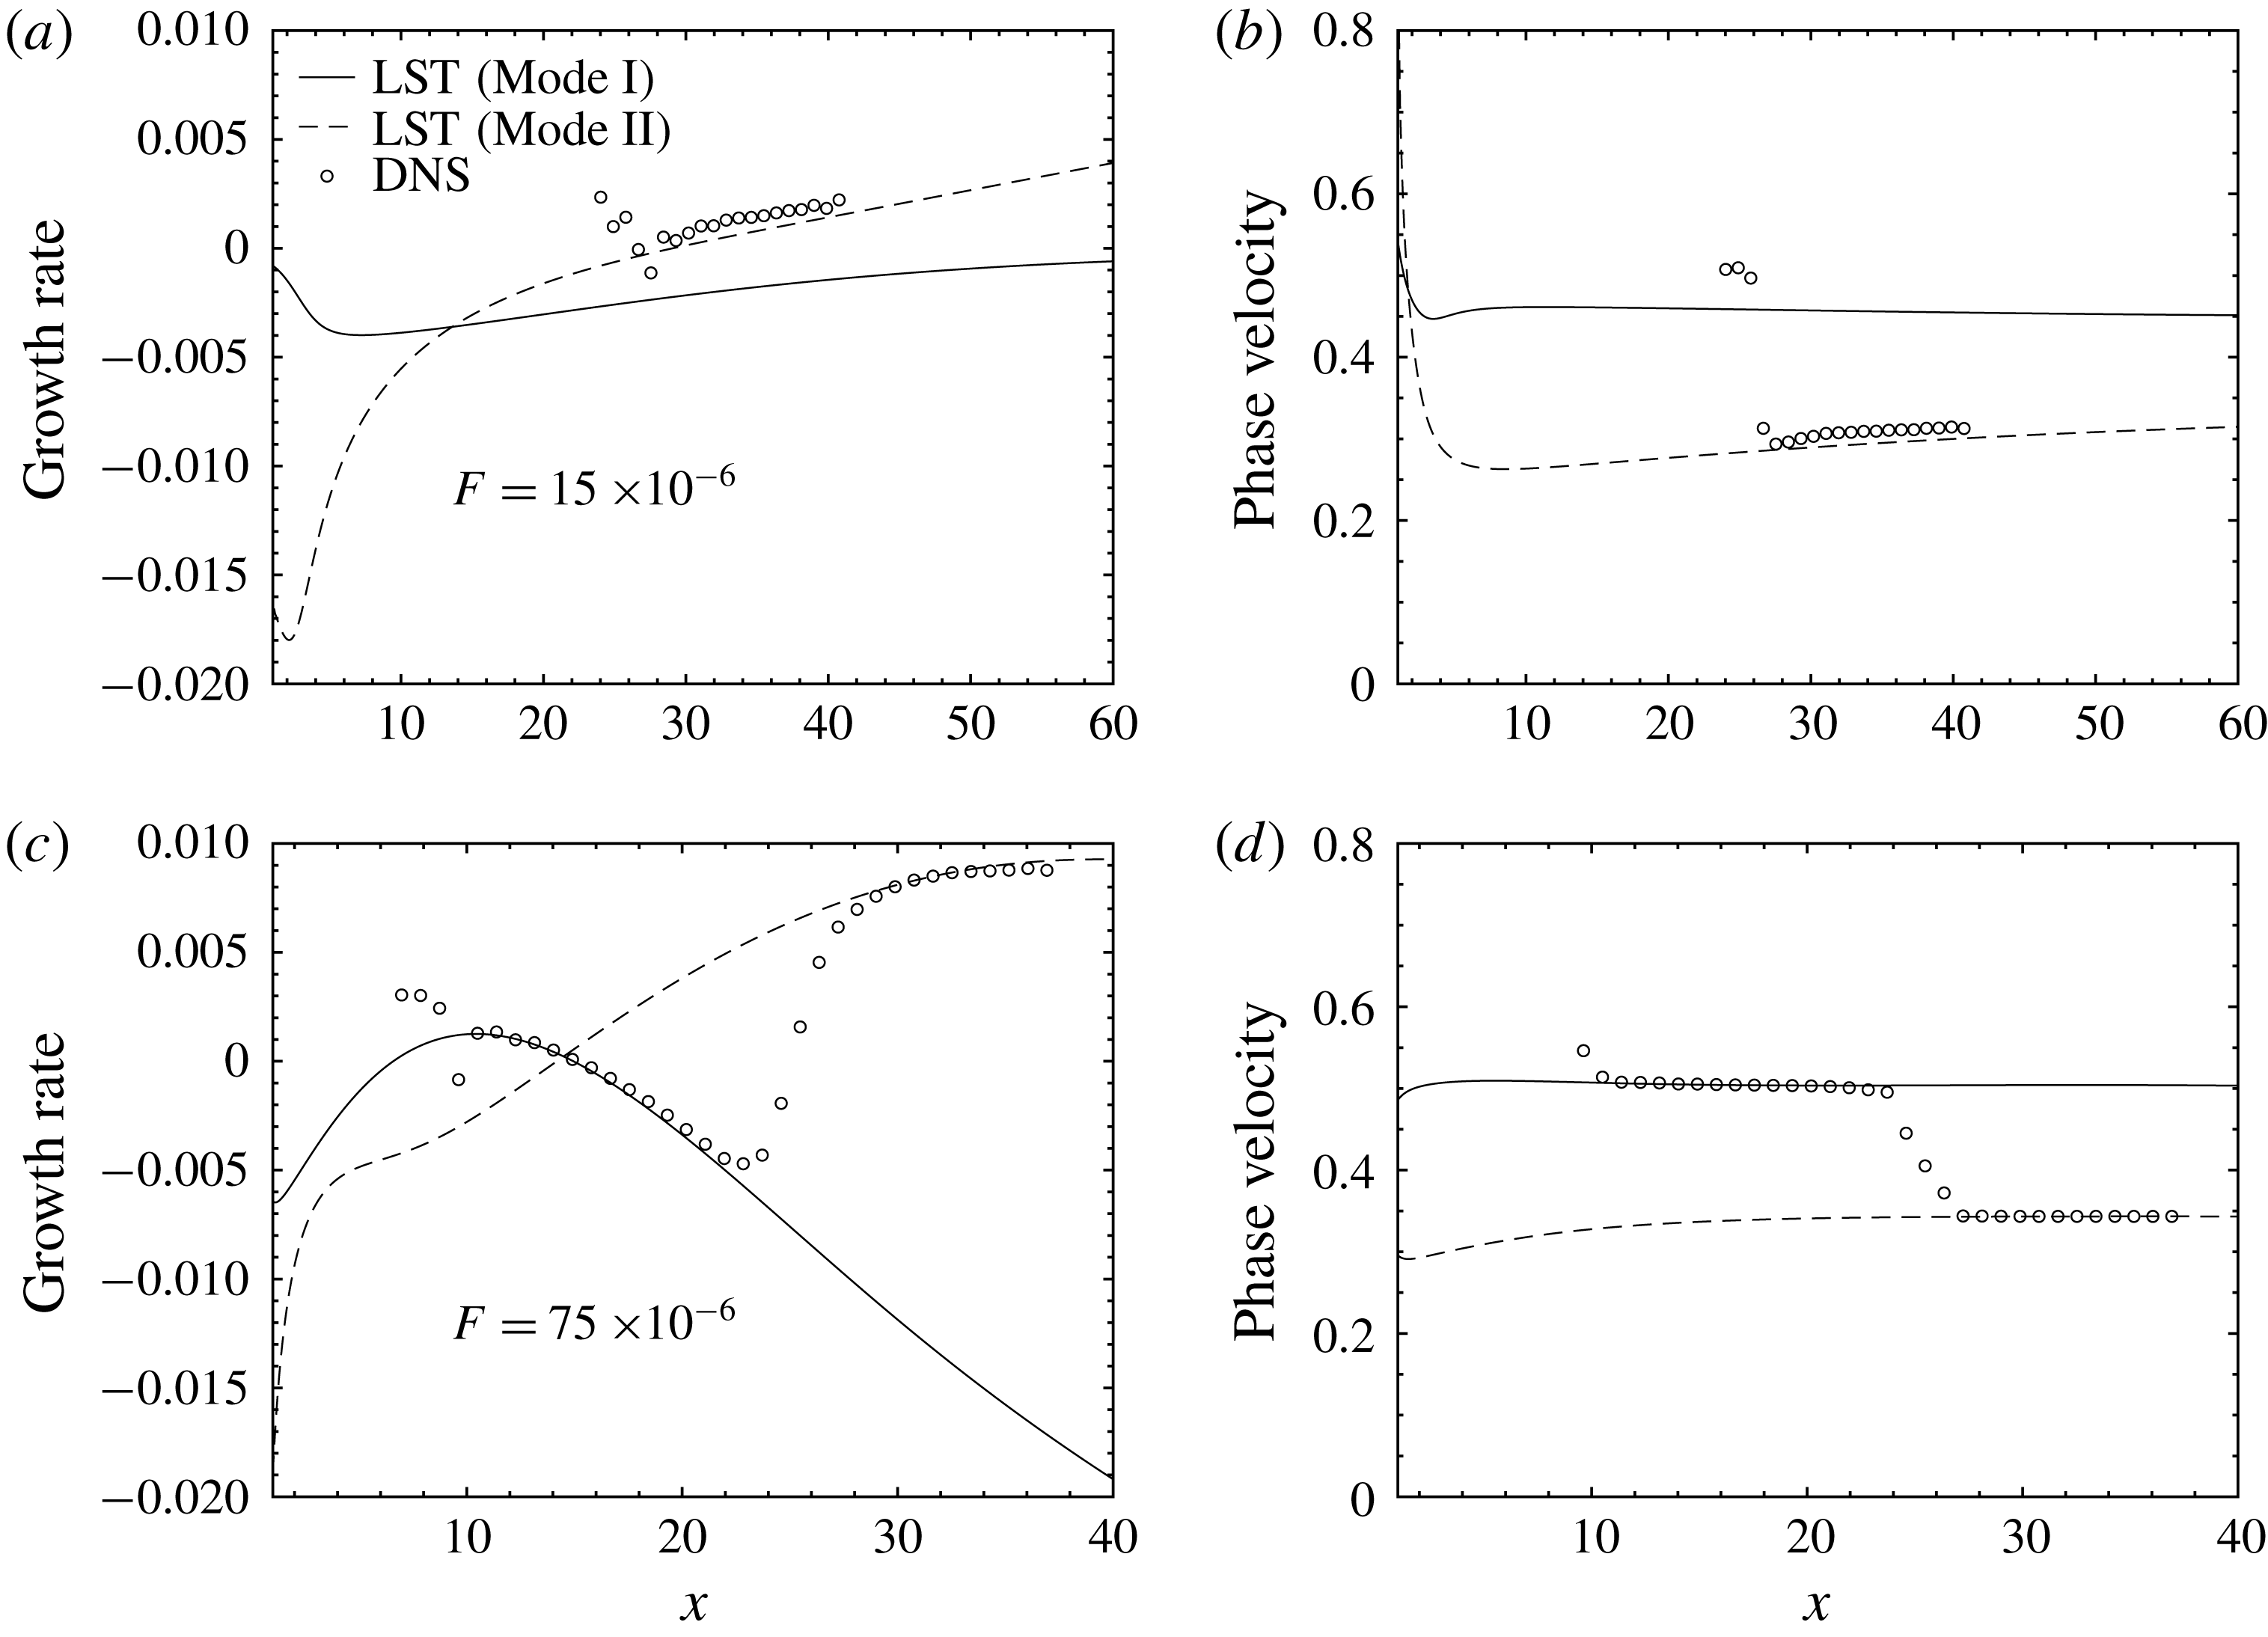
Figure 15. Comparison of the growth rate and phase velocity between LST and DNS:
![]() $T_{\infty }^{\ast }=280~\text{K}$
;
$T_{\infty }^{\ast }=280~\text{K}$
;
![]() $\mathit{Ec}_{\infty }=0.20$
, (a,b)
$\mathit{Ec}_{\infty }=0.20$
, (a,b)
![]() $F=15\times 10^{-6}$
; (c,d)
$F=15\times 10^{-6}$
; (c,d)
![]() $F=75\times 10^{-6}$
.
$F=75\times 10^{-6}$
.
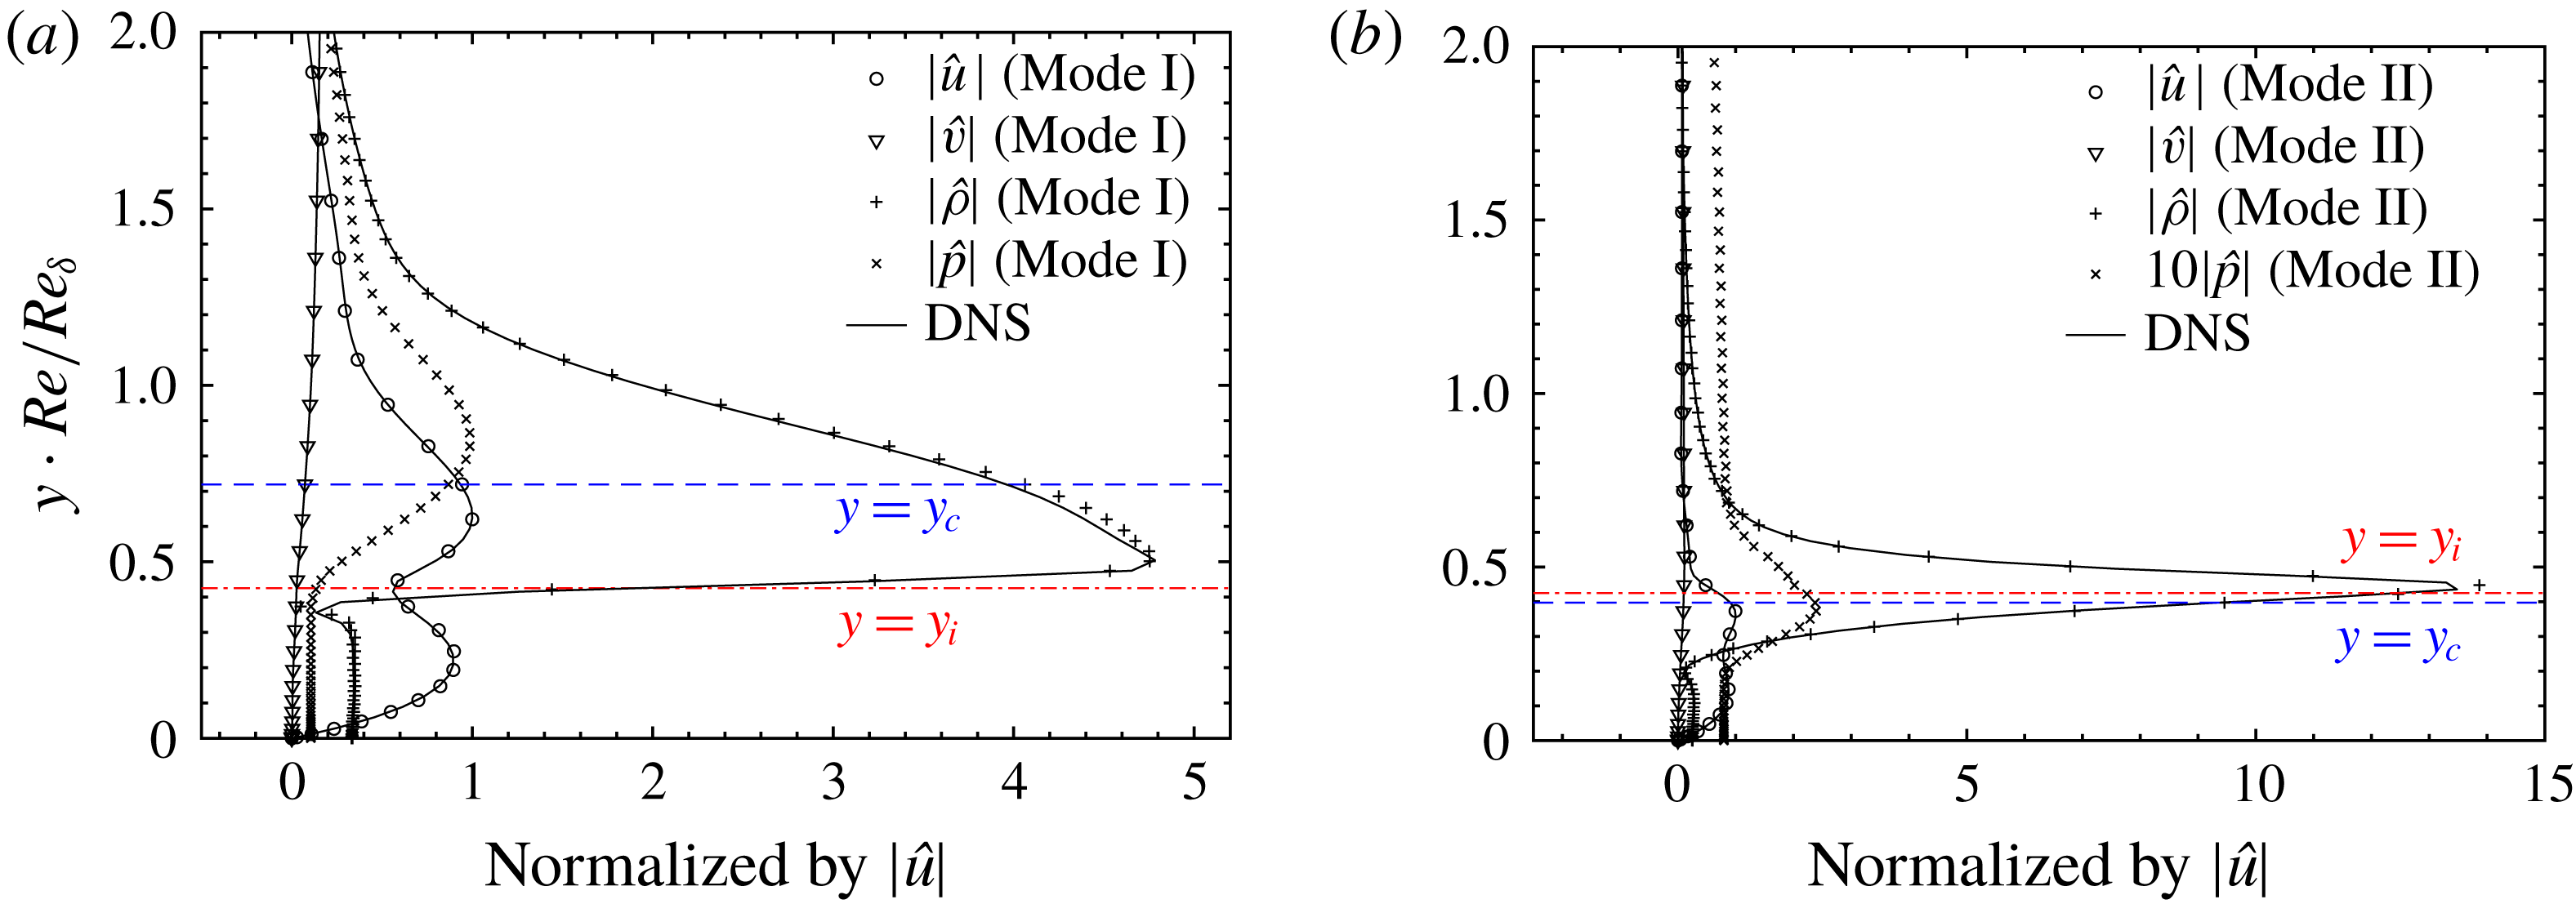
Figure 16. Comparison of the profiles (
![]() $\hat{u}$
,
$\hat{u}$
,
![]() $\hat{v}$
,
$\hat{v}$
,
![]() $\hat{\unicode[STIX]{x1D70C}}$
) of the perturbations between LST and DNS. The amplitude has been normalized by
$\hat{\unicode[STIX]{x1D70C}}$
) of the perturbations between LST and DNS. The amplitude has been normalized by
![]() $|\hat{u} |$
:
$|\hat{u} |$
:
![]() $T_{\infty }^{\ast }=280~\text{K}$
,
$T_{\infty }^{\ast }=280~\text{K}$
,
![]() $\mathit{Ec}_{\infty }=0.20$
,
$\mathit{Ec}_{\infty }=0.20$
,
![]() $F=75\times 10^{-6}$
; (a)
$F=75\times 10^{-6}$
; (a)
![]() $x=16.00$
,
$x=16.00$
,
![]() $\mathit{Re}_{\unicode[STIX]{x1D6FF}}=1264.9$
; (b)
$\mathit{Re}_{\unicode[STIX]{x1D6FF}}=1264.9$
; (b)
![]() $x=36.00$
,
$x=36.00$
,
![]() $\mathit{Re}_{\unicode[STIX]{x1D6FF}}=1894.7$
. The critical point (
$\mathit{Re}_{\unicode[STIX]{x1D6FF}}=1894.7$
. The critical point (
![]() $y=y_{c}$
,
$y=y_{c}$
,
![]() $u_{0}(y_{c})=c$
) and the generalized inflection point (
$u_{0}(y_{c})=c$
) and the generalized inflection point (
![]() $y=y_{i}$
) are denoted with the blue dashed line and red dash-dotted line respectively.
$y=y_{i}$
) are denoted with the blue dashed line and red dash-dotted line respectively.
The perturbation profiles with
![]() $F=75\times 10^{-6}$
obtained from LST and DNS are provided and compared in figure 16. The comparison is made at
$F=75\times 10^{-6}$
obtained from LST and DNS are provided and compared in figure 16. The comparison is made at
![]() $x=16.00$
(Mode I dominates) and
$x=16.00$
(Mode I dominates) and
![]() $x=36.00$
(Mode II dominates). Figure 16 shows that the perturbation profiles obtained from DNS match very well with the LST predictions of Mode I and Mode II at
$x=36.00$
(Mode II dominates). Figure 16 shows that the perturbation profiles obtained from DNS match very well with the LST predictions of Mode I and Mode II at
![]() $x=16.00$
and
$x=16.00$
and
![]() $x=36.00$
, respectively. Due to the large gradient of
$x=36.00$
, respectively. Due to the large gradient of
![]() $\unicode[STIX]{x2202}\unicode[STIX]{x1D70C}_{0}/\unicode[STIX]{x2202}y$
, the density perturbation is the largest component for both modes. Note that
$\unicode[STIX]{x2202}\unicode[STIX]{x1D70C}_{0}/\unicode[STIX]{x2202}y$
, the density perturbation is the largest component for both modes. Note that
![]() $|\hat{\unicode[STIX]{x1D70C}}|$
is considerably larger for Mode II. On the other hand, the velocity components
$|\hat{\unicode[STIX]{x1D70C}}|$
is considerably larger for Mode II. On the other hand, the velocity components
![]() $\hat{u}$
and
$\hat{u}$
and
![]() $\hat{v}$
remain similar for both modes, indicating that Mode II is caused by the dramatic variation of thermodynamic and transport properties. The above comparisons validated the co-existence of the dual modes and the dominance of Mode II in the transcritical regime.
$\hat{v}$
remain similar for both modes, indicating that Mode II is caused by the dramatic variation of thermodynamic and transport properties. The above comparisons validated the co-existence of the dual modes and the dominance of Mode II in the transcritical regime.
4.3 Is Mode II comparable to Mack’s second mode?
Based on the findings in § 4.2, Mode II is generated when the fluid is transcritical although the flow is subsonic. In this section, using the inviscid theory, we clarify the relation to Mack’s second mode which appears in hypersonic flows.
The inviscid stability equations for the 2-D perturbations are given by
 $$\begin{eqnarray}\left.\begin{array}{@{}c@{}}\displaystyle (\unicode[STIX]{x1D6FC}u_{0}-\unicode[STIX]{x1D714})\hat{\unicode[STIX]{x1D70C}}+\unicode[STIX]{x1D6FC}\unicode[STIX]{x1D70C}_{0}\hat{u} =\text{i}\unicode[STIX]{x1D70C}_{0}D\hat{v}+\text{i}{\displaystyle \frac{\unicode[STIX]{x2202}\unicode[STIX]{x1D70C}_{0}}{\unicode[STIX]{x2202}y}}\hat{v}\\ \displaystyle \unicode[STIX]{x1D6FC}\hat{p}+(\unicode[STIX]{x1D6FC}u_{0}-\unicode[STIX]{x1D714})\unicode[STIX]{x1D70C}_{0}\hat{u} =\text{i}\unicode[STIX]{x1D70C}_{0}{\displaystyle \frac{\unicode[STIX]{x2202}u_{0}}{\unicode[STIX]{x2202}y}}\hat{v}\\ \displaystyle (\unicode[STIX]{x1D6FC}u_{0}-\unicode[STIX]{x1D714})\unicode[STIX]{x1D70C}_{0}\hat{v}-\text{i}D\hat{p}=0\\ \displaystyle (\unicode[STIX]{x1D6FC}u_{0}-\unicode[STIX]{x1D714})\unicode[STIX]{x1D70C}_{0}\hat{e}+\unicode[STIX]{x1D6FC}p_{0}\hat{u} =\text{i}p_{0}D\hat{v}+\text{i}\unicode[STIX]{x1D70C}_{0}{\displaystyle \frac{\unicode[STIX]{x2202}e_{0}}{\unicode[STIX]{x2202}y}}\hat{v}\end{array}\right\},\end{eqnarray}$$
where
![]() $e_{0}$
and
$e_{0}$
and
![]() $\hat{e}$
are the internal energy and its perturbation. Equation (4.3) can be reduced to a single equation,
$\hat{e}$
are the internal energy and its perturbation. Equation (4.3) can be reduced to a single equation,
 $$\begin{eqnarray}\displaystyle & & \displaystyle \left[\left(\left.{\displaystyle \frac{\unicode[STIX]{x2202}\unicode[STIX]{x1D70C}_{0}}{\unicode[STIX]{x2202}e_{0}}}\right|_{p}{\displaystyle \frac{p_{0}}{\unicode[STIX]{x1D70C}_{0}^{2}}}-1\right)\unicode[STIX]{x1D6FC}^{2}+(\unicode[STIX]{x1D6FC}u_{0}-\unicode[STIX]{x1D714})^{2}\left.{\displaystyle \frac{\unicode[STIX]{x2202}\unicode[STIX]{x1D70C}_{0}}{\unicode[STIX]{x2202}p_{0}}}\right|_{e}\right]\hat{p}-\left(\left.{\displaystyle \frac{\unicode[STIX]{x2202}\unicode[STIX]{x1D70C}_{0}}{\unicode[STIX]{x2202}e_{0}}}\right|_{p}{\displaystyle \frac{p_{0}}{\unicode[STIX]{x1D70C}_{0}^{2}}}-1\right)D^{2}\hat{p}\nonumber\\ \displaystyle & & \displaystyle \quad +\left[\!\left.{\displaystyle \frac{\unicode[STIX]{x2202}\unicode[STIX]{x1D70C}_{0}}{\unicode[STIX]{x2202}e_{0}}}\right|_{p}{\displaystyle \frac{p_{0}}{\unicode[STIX]{x1D70C}_{0}^{3}}}{\displaystyle \frac{\unicode[STIX]{x2202}\unicode[STIX]{x1D70C}_{0}}{\unicode[STIX]{x2202}y}}+\!\left(\!\left.{\displaystyle \frac{\unicode[STIX]{x2202}\unicode[STIX]{x1D70C}_{0}}{\unicode[STIX]{x2202}e_{0}}}\right|_{p}{\displaystyle \frac{p_{0}}{\unicode[STIX]{x1D70C}_{0}^{2}}}-1\!\right)\!{\displaystyle \frac{2\unicode[STIX]{x1D6FC}}{\unicode[STIX]{x1D6FC}u_{0}-\unicode[STIX]{x1D714}}}{\displaystyle \frac{\unicode[STIX]{x2202}u_{0}}{\unicode[STIX]{x2202}y}}-{\displaystyle \frac{1}{\unicode[STIX]{x1D70C}_{0}}}\left.{\displaystyle \frac{\unicode[STIX]{x2202}\unicode[STIX]{x1D70C}_{0}}{\unicode[STIX]{x2202}e_{0}}}\right|_{p}\!{\displaystyle \frac{\unicode[STIX]{x2202}e_{0}}{\unicode[STIX]{x2202}y}}\!\right]D\hat{p}=0.\qquad \quad\end{eqnarray}$$
Following Mack (Reference Mack1984), neglecting the term related to
![]() $D\hat{p}$
results in
$D\hat{p}$
results in
 $$\begin{eqnarray}\displaystyle D^{2}\hat{p}-\unicode[STIX]{x1D6FC}^{2}\left[1-{\displaystyle \frac{(u_{0}-c)^{2}}{1-\left.{\displaystyle \frac{\unicode[STIX]{x2202}\unicode[STIX]{x1D70C}_{0}}{\unicode[STIX]{x2202}e_{0}}}\right|_{p}{\displaystyle \frac{p_{0}}{\unicode[STIX]{x1D70C}_{0}^{2}}}}}\left.{\displaystyle \frac{\unicode[STIX]{x2202}\unicode[STIX]{x1D70C}_{0}}{\unicode[STIX]{x2202}p_{0}}}\right|_{e}\right]\hat{p}=0.\end{eqnarray}$$
We introduce the relative Mach number
![]() $M_{r}$
,
$M_{r}$
,
 $$\begin{eqnarray}\displaystyle M_{r}={\displaystyle \frac{u_{0}-c}{\sqrt{\left(1-\left.{\displaystyle \frac{\unicode[STIX]{x2202}\unicode[STIX]{x1D70C}_{0}}{\unicode[STIX]{x2202}e_{0}}}\right|_{p}{\displaystyle \frac{p_{0}}{\unicode[STIX]{x1D70C}_{0}^{2}}}\right)\left(\left.{\displaystyle \frac{\unicode[STIX]{x2202}\unicode[STIX]{x1D70C}_{0}}{\unicode[STIX]{x2202}p_{0}}}\right|_{e}\right)^{-1}}}}.\end{eqnarray}$$
Using Maxwell relations for partial derivatives of thermodynamic properties, it can be mathematically proven (see appendix D) that the relative Mach number (4.6) for non-ideal gases equals to
 $$\begin{eqnarray}\displaystyle M_{r}={\displaystyle \frac{u_{0}-c}{\sqrt{\left.{\displaystyle \frac{\unicode[STIX]{x2202}p_{0}}{\unicode[STIX]{x2202}\unicode[STIX]{x1D70C}_{0}}}\right|_{s}}}}={\displaystyle \frac{u_{0}-c}{a_{0}}},\end{eqnarray}$$
which is equivalent to the result of Mack (Reference Mack1984). Equation (4.5) changes its behaviour from elliptic to hyperbolic when
![]() $(1-M_{r}^{2})$
changes sign (from positive to negative) and multiple solutions (modes) can be present. This has successfully explained Mack’s second mode in high-speed flows of ideal gas. Equation (4.7) indicates that the relative Mach number for non-ideal gases possesses the same physical nature, i.e. a local supersonic region relative to the phase velocity can give rise to multiple modes. We show in figure 17 the distribution of
$(1-M_{r}^{2})$
changes sign (from positive to negative) and multiple solutions (modes) can be present. This has successfully explained Mack’s second mode in high-speed flows of ideal gas. Equation (4.7) indicates that the relative Mach number for non-ideal gases possesses the same physical nature, i.e. a local supersonic region relative to the phase velocity can give rise to multiple modes. We show in figure 17 the distribution of
![]() $M_{r}^{2}$
. The results are given for phase velocities
$M_{r}^{2}$
. The results are given for phase velocities
![]() $c=$
0.30 and 0.54, which correspond to the lower and upper limits of the dual modes (
$c=$
0.30 and 0.54, which correspond to the lower and upper limits of the dual modes (
![]() $0.19\leqslant \mathit{Ec}_{\infty }\leqslant 0.20$
). The figure shows that
$0.19\leqslant \mathit{Ec}_{\infty }\leqslant 0.20$
). The figure shows that
![]() $M_{r}$
stays always below 1 in the transcritical regime (
$M_{r}$
stays always below 1 in the transcritical regime (
![]() $T_{\infty }^{\ast }=280~\text{K}$
and
$T_{\infty }^{\ast }=280~\text{K}$
and
![]() $\mathit{Ec}_{\infty }=0.20$
) where the dual modes co-exist. This implies that Mode II is different from Mack’s second mode.
$\mathit{Ec}_{\infty }=0.20$
) where the dual modes co-exist. This implies that Mode II is different from Mack’s second mode.
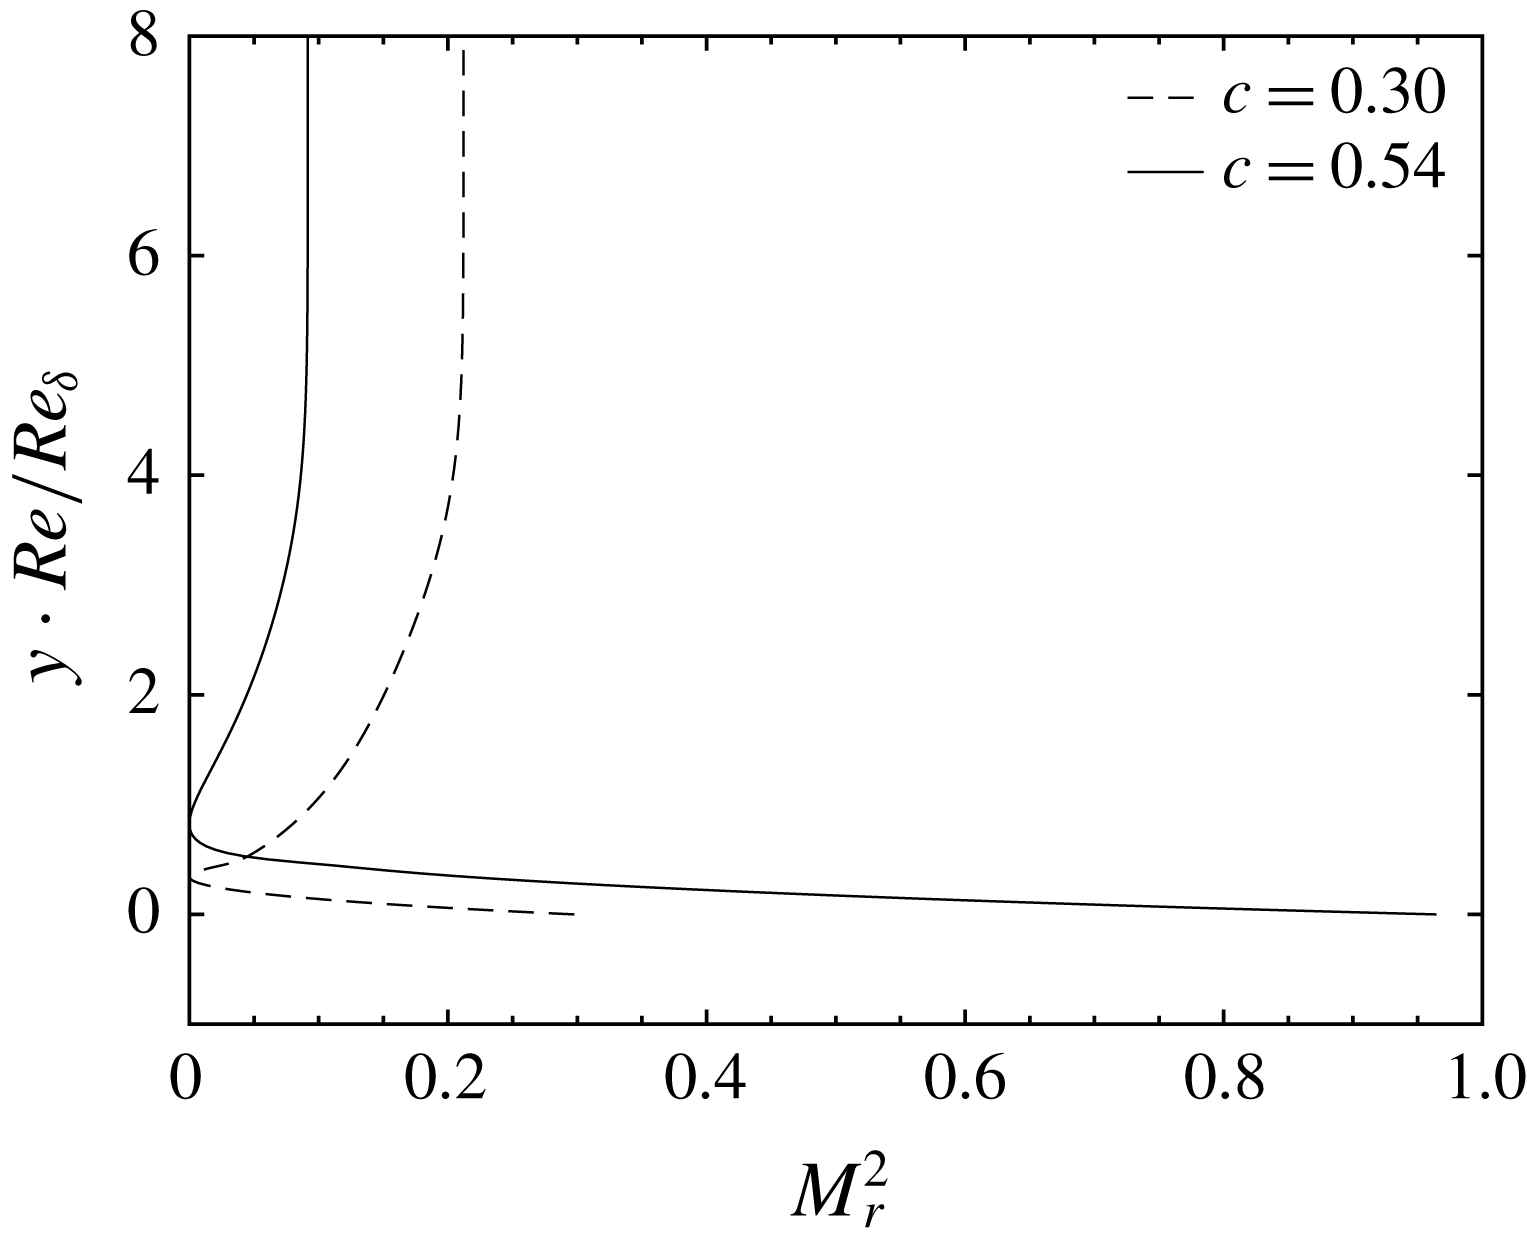
Figure 17. The relative Mach number with
![]() $T_{\infty }^{\ast }=280~\text{K}$
and
$T_{\infty }^{\ast }=280~\text{K}$
and
![]() $\mathit{Ec}_{\infty }=0.20$
.
$\mathit{Ec}_{\infty }=0.20$
.
Another evidence to highlight the difference between Mode II and Mack’s second mode is the co-existence of dual unstable modes with same parameters (
![]() $F$
,
$F$
,
![]() $\unicode[STIX]{x1D6FD}$
,
$\unicode[STIX]{x1D6FD}$
,
![]() $\mathit{Re}_{\unicode[STIX]{x1D6FF}}$
and
$\mathit{Re}_{\unicode[STIX]{x1D6FF}}$
and
![]() $\mathit{Ec}_{\infty }$
). In fact, according to the new terminology summarized in Fedorov & Tumin (Reference Fedorov and Tumin2011), Mack’s second mode is a result of synchronization between the fast mode and the slow mode, which stems from the continuous spectrum of the fast and slow acoustic waves. As such, only one unstable eigenmode is present for certain parameters (
$\mathit{Ec}_{\infty }$
). In fact, according to the new terminology summarized in Fedorov & Tumin (Reference Fedorov and Tumin2011), Mack’s second mode is a result of synchronization between the fast mode and the slow mode, which stems from the continuous spectrum of the fast and slow acoustic waves. As such, only one unstable eigenmode is present for certain parameters (
![]() $F$
,
$F$
,
![]() $\unicode[STIX]{x1D6FD}$
,
$\unicode[STIX]{x1D6FD}$
,
![]() $\mathit{Re}_{\unicode[STIX]{x1D6FF}}$
and
$\mathit{Re}_{\unicode[STIX]{x1D6FF}}$
and
![]() $\mathit{Ec}_{\infty }$
) of the base flow and the perturbation. This leads to the conventional neutral curve for hypersonic boundary-layer flows (see for example figure 1 in Ren, Fu & Hanifi Reference Ren, Fu and Hanifi2016). However, the neutral curves of Mode I and Mode II presented here, indeed overlap with each other. Both modes can be unstable with the same frequency
$\mathit{Ec}_{\infty }$
) of the base flow and the perturbation. This leads to the conventional neutral curve for hypersonic boundary-layer flows (see for example figure 1 in Ren, Fu & Hanifi Reference Ren, Fu and Hanifi2016). However, the neutral curves of Mode I and Mode II presented here, indeed overlap with each other. Both modes can be unstable with the same frequency
![]() $F$
and wavenumber.
$F$
and wavenumber.
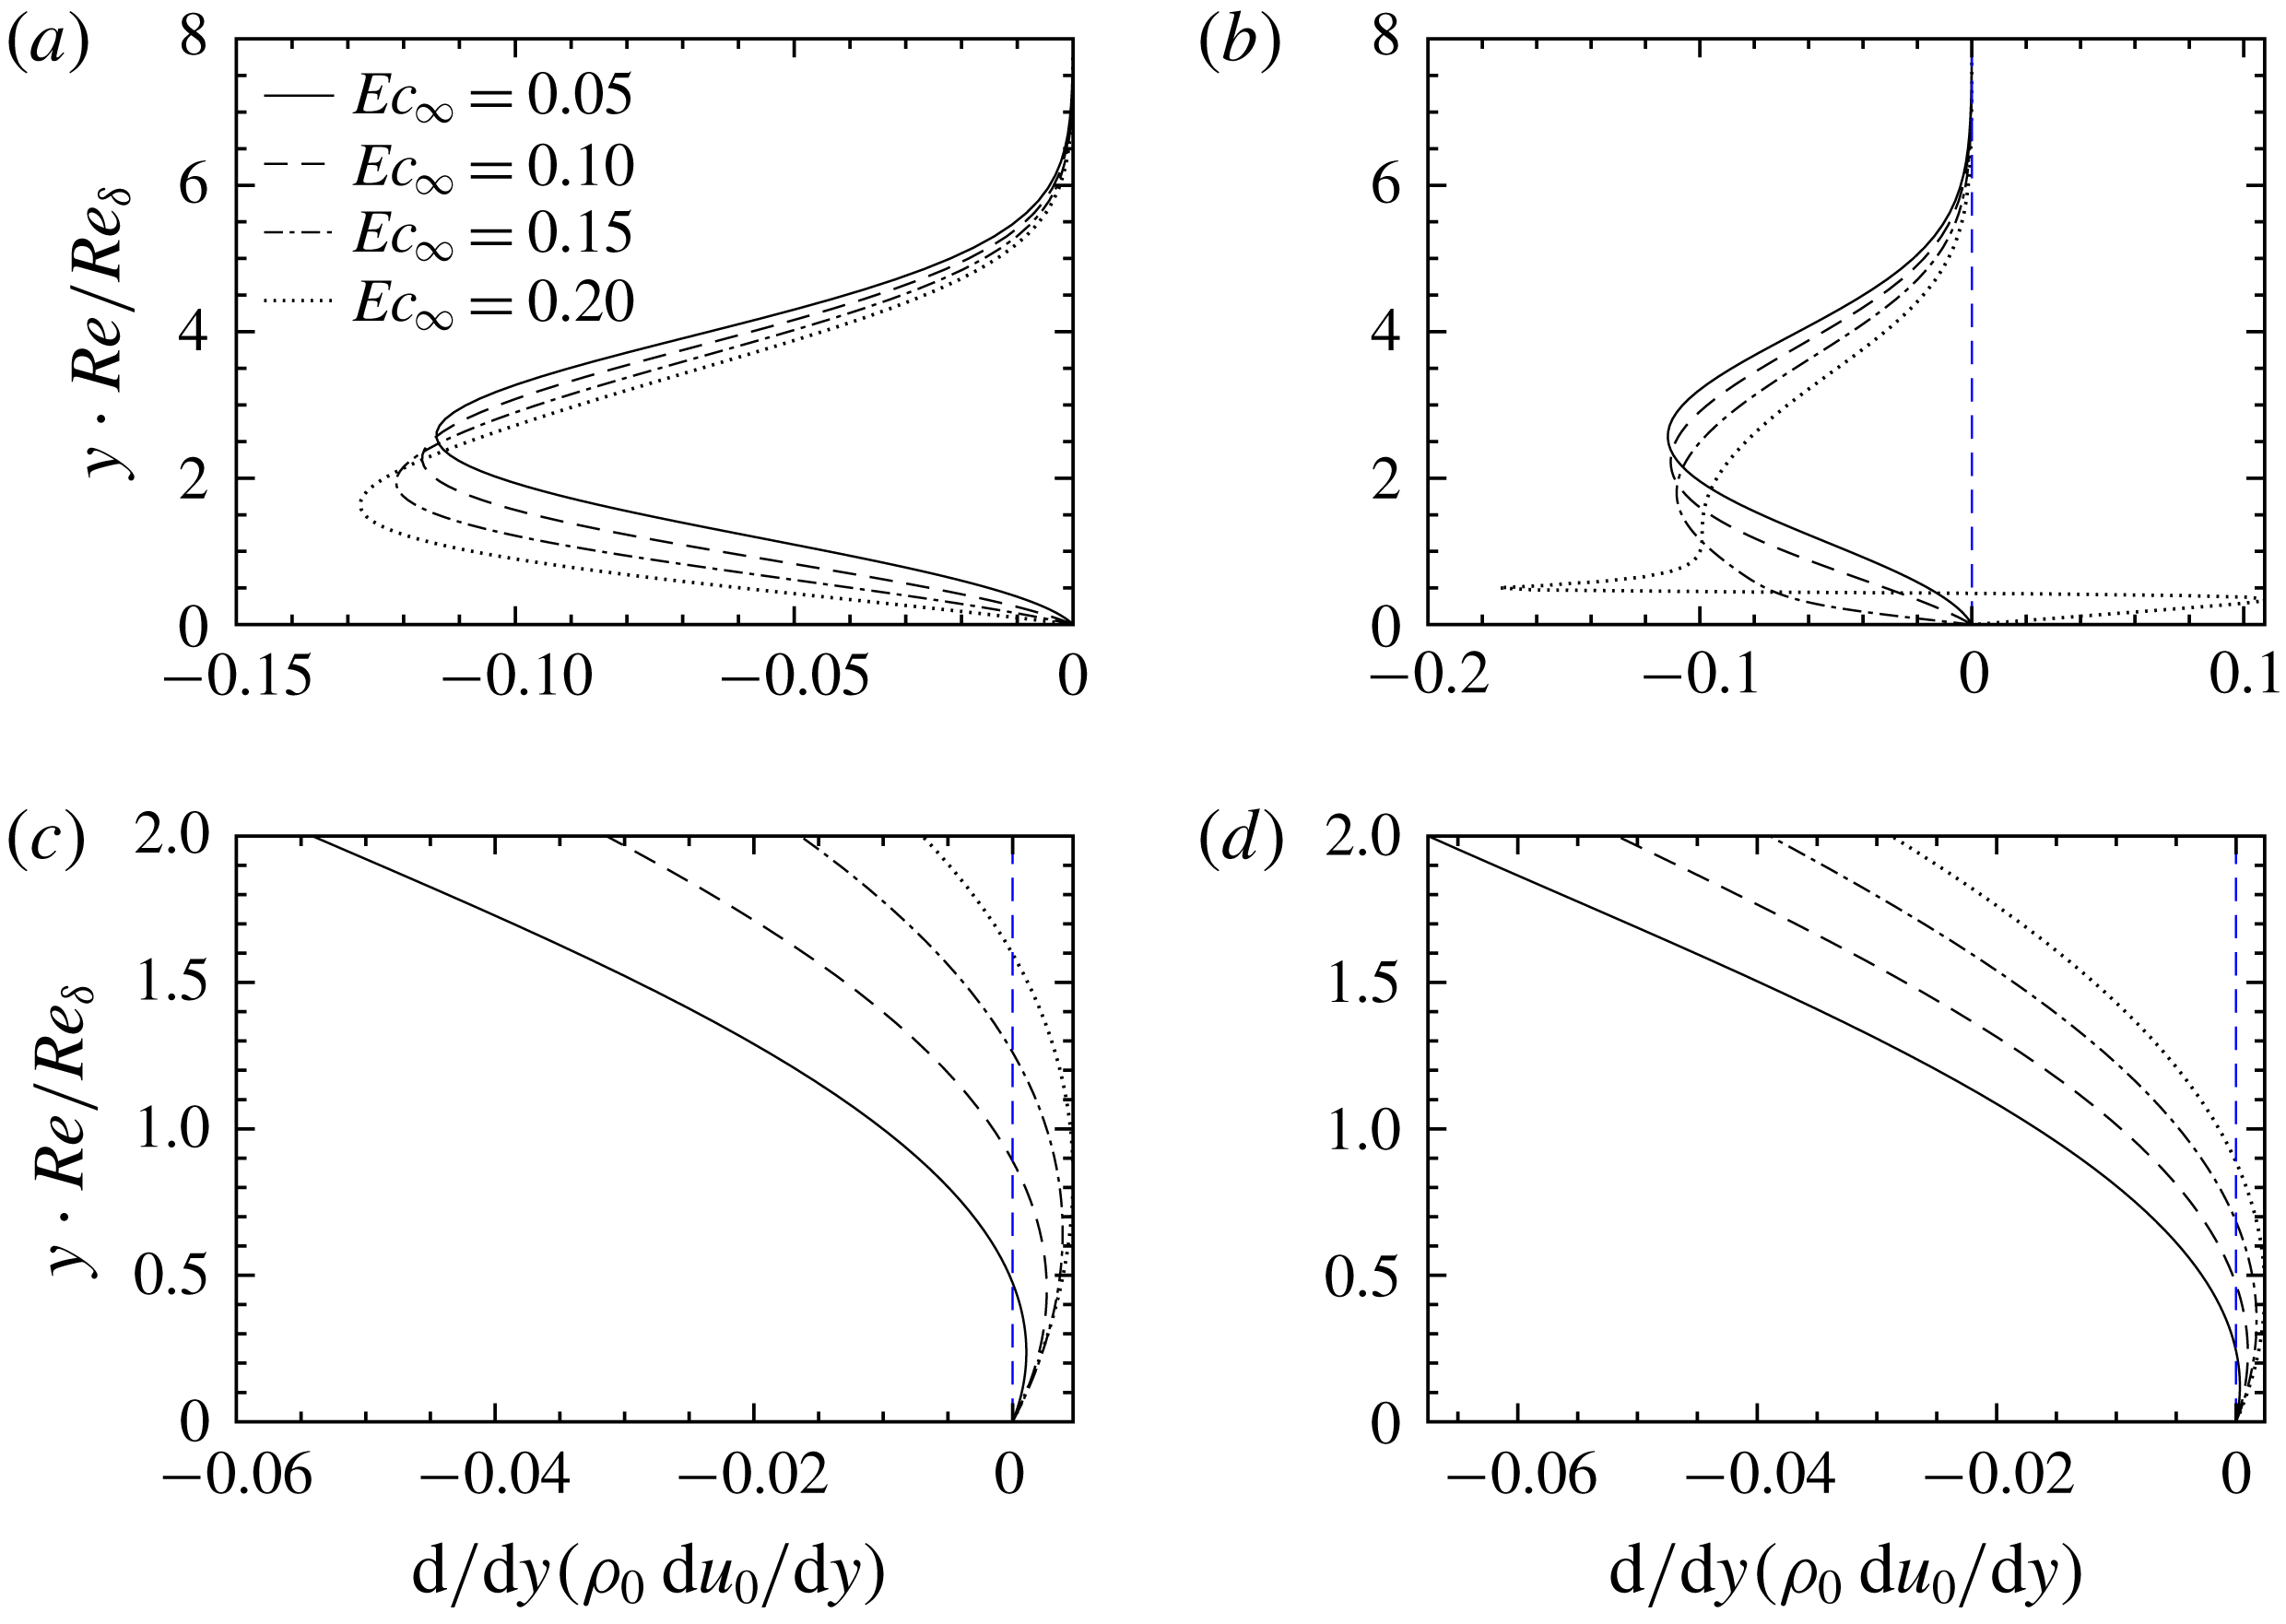
Figure 18. Generalized derivatives of the base flow
![]() $\text{d}(\unicode[STIX]{x1D70C}_{0}\text{d}u_{0}/\text{d}y)/\text{d}y$
for cases (a) T260, (b) T280, (c) T320 and (d) T340.
$\text{d}(\unicode[STIX]{x1D70C}_{0}\text{d}u_{0}/\text{d}y)/\text{d}y$
for cases (a) T260, (b) T280, (c) T320 and (d) T340.
Under the inviscid assumption, Lees & Lin (Reference Lees and Lin1946) derived the generalized inflection point criterion
![]() $D(Du_{0}/T_{0})$
, which gives the necessary condition for a compressible boundary-layer flow to be inviscidly unstable. They used the ideal-gas equation of state (
$D(Du_{0}/T_{0})$
, which gives the necessary condition for a compressible boundary-layer flow to be inviscidly unstable. They used the ideal-gas equation of state (
![]() $\unicode[STIX]{x1D70C}_{0}T_{0}=1$
) and below we show that a similar criterion applies for non-ideal gases. From (4.4) for
$\unicode[STIX]{x1D70C}_{0}T_{0}=1$
) and below we show that a similar criterion applies for non-ideal gases. From (4.4) for
![]() $\hat{p}$
and using the relation
$\hat{p}$
and using the relation
![]() $D\hat{p}=-\text{i}\unicode[STIX]{x1D70C}_{0}(\unicode[STIX]{x1D6FC}u_{0}-\unicode[STIX]{x1D714})\hat{v}$
, the equation for
$D\hat{p}=-\text{i}\unicode[STIX]{x1D70C}_{0}(\unicode[STIX]{x1D6FC}u_{0}-\unicode[STIX]{x1D714})\hat{v}$
, the equation for
![]() $\hat{v}$
then reads,
$\hat{v}$
then reads,
where
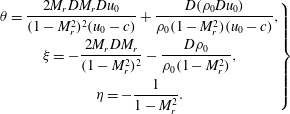 $$\begin{eqnarray}\left.\begin{array}{@{}c@{}}\unicode[STIX]{x1D703}={\displaystyle \frac{2M_{r}DM_{r}Du_{0}}{(1-M_{r}^{2})^{2}(u_{0}-c)}}+{\displaystyle \frac{D(\unicode[STIX]{x1D70C}_{0}Du_{0})}{\unicode[STIX]{x1D70C}_{0}(1-M_{r}^{2})(u_{0}-c)}},\\ \unicode[STIX]{x1D709}=-{\displaystyle \frac{2M_{r}DM_{r}}{(1-M_{r}^{2})^{2}}}-{\displaystyle \frac{D\unicode[STIX]{x1D70C}_{0}}{\unicode[STIX]{x1D70C}_{0}(1-M_{r}^{2})}},\\ \unicode[STIX]{x1D702}=-{\displaystyle \frac{1}{1-M_{r}^{2}}}.\end{array}\right\}\end{eqnarray}$$
It can be recognized that at the critical layer
![]() $y=y_{c}$
, where
$y=y_{c}$
, where
![]() $u_{0}=c$
and
$u_{0}=c$
and
![]() $M_{r}=0$
, the term
$M_{r}=0$
, the term
![]() $D\left(\unicode[STIX]{x1D70C}_{0}Du_{0}\right)$
must vanish such that
$D\left(\unicode[STIX]{x1D70C}_{0}Du_{0}\right)$
must vanish such that
![]() $y=y_{c}$
is a regular singular point of the
$y=y_{c}$
is a regular singular point of the
![]() $\hat{v}$
equation (4.8). Therefore,
$\hat{v}$
equation (4.8). Therefore,
![]() $D\left(\unicode[STIX]{x1D70C}_{0}Du_{0}\right)$
plays the same role as
$D\left(\unicode[STIX]{x1D70C}_{0}Du_{0}\right)$
plays the same role as
![]() $D\left(Du_{0}/T_{0}\right)$
given by Lees & Lin (Reference Lees and Lin1946) and provides the generalized inflection point criterion for non-ideal gases.
$D\left(Du_{0}/T_{0}\right)$
given by Lees & Lin (Reference Lees and Lin1946) and provides the generalized inflection point criterion for non-ideal gases.
In figure 18, we show the generalized derivatives
![]() $\text{d}(\unicode[STIX]{x1D70C}_{0}\text{d}u_{0}/\text{d}y)/\text{d}y$
for cases T260, T280, T320 and T340, each with four Eckert numbers. It indicates that like ideal gases, an inviscid mechanism exists in the supercritical regime, while the stability is viscous in nature in the subcritical regime. It is worth noting that a generalized inflection point suddenly appears once the base flow turns from the sub- to the transcritical regime. It suggests the inviscid nature of Mode II. Note in figure 16, if compared to Mode I, Mode II has the peak of fluctuations (
$\text{d}(\unicode[STIX]{x1D70C}_{0}\text{d}u_{0}/\text{d}y)/\text{d}y$
for cases T260, T280, T320 and T340, each with four Eckert numbers. It indicates that like ideal gases, an inviscid mechanism exists in the supercritical regime, while the stability is viscous in nature in the subcritical regime. It is worth noting that a generalized inflection point suddenly appears once the base flow turns from the sub- to the transcritical regime. It suggests the inviscid nature of Mode II. Note in figure 16, if compared to Mode I, Mode II has the peak of fluctuations (
![]() $|\hat{\unicode[STIX]{x1D70C}}|$
,
$|\hat{\unicode[STIX]{x1D70C}}|$
,
![]() $|\hat{u} |$
,
$|\hat{u} |$
,
![]() $|\hat{p}|$
) around the generalized inflection point, suggesting its inviscid nature (Lees & Lin Reference Lees and Lin1946). In figure 19 we compare the generalized derivative of the transcritical base flow for pressures
$|\hat{p}|$
) around the generalized inflection point, suggesting its inviscid nature (Lees & Lin Reference Lees and Lin1946). In figure 19 we compare the generalized derivative of the transcritical base flow for pressures
![]() $p_{0}^{\ast }=$
78, 80 and 82 bar. It indicates that the closer to the critical point (
$p_{0}^{\ast }=$
78, 80 and 82 bar. It indicates that the closer to the critical point (
![]() $p_{c}^{\ast }=73.9$
bar), the more inflectional the base flow becomes, and the more unstable the flow in the transcritical regime.
$p_{c}^{\ast }=73.9$
bar), the more inflectional the base flow becomes, and the more unstable the flow in the transcritical regime.

Figure 19. Generalized derivative of the laminar base flow with
![]() $T_{\infty }^{\ast }=280~\text{K}$
, (a)
$T_{\infty }^{\ast }=280~\text{K}$
, (a)
![]() $p_{0}^{\ast }=78$
bar, (b)
$p_{0}^{\ast }=78$
bar, (b)
![]() $p_{0}^{\ast }=80$
bar and (c)
$p_{0}^{\ast }=80$
bar and (c)
![]() $p_{0}^{\ast }=82$
bar.
$p_{0}^{\ast }=82$
bar.
4.4 Oblique perturbations
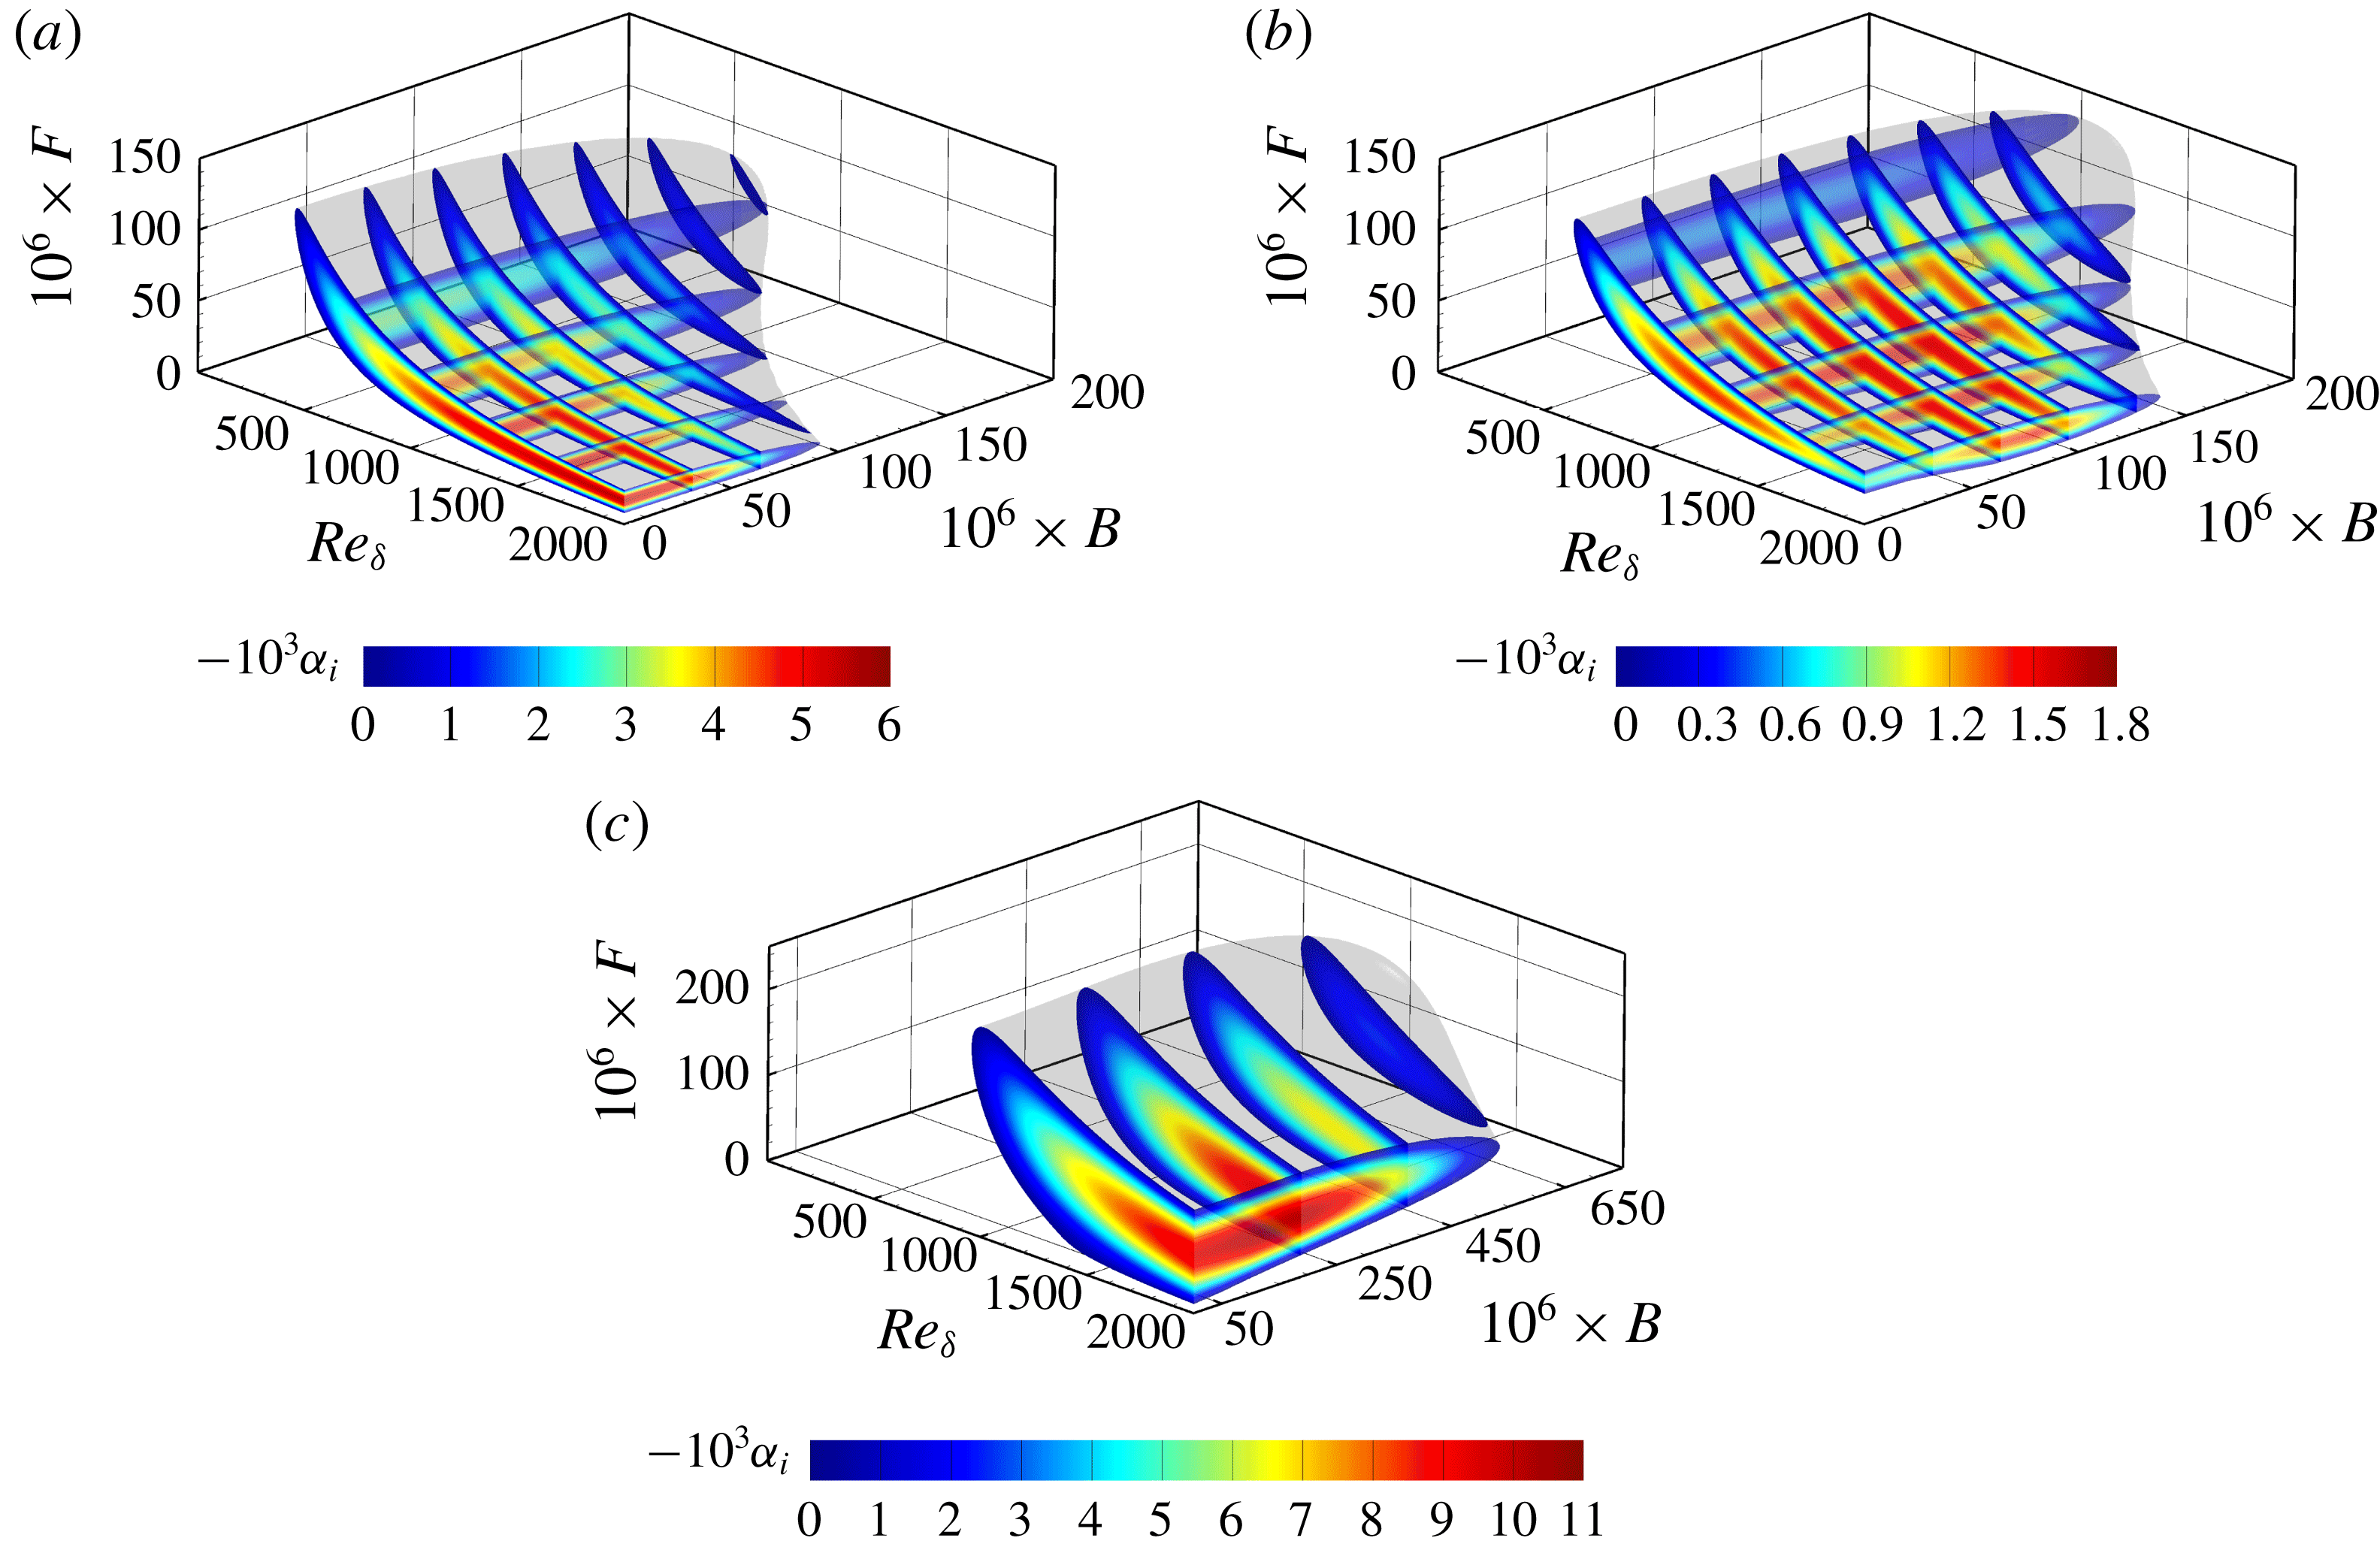
Figure 20. Neutral surface along with slices of growth rate contours.
![]() $T_{\infty }^{\ast }=280~\text{K}$
, (a)
$T_{\infty }^{\ast }=280~\text{K}$
, (a)
![]() $\mathit{Ec}_{\infty }=0.05$
; (b)
$\mathit{Ec}_{\infty }=0.05$
; (b)
![]() $\mathit{Ec}_{\infty }=0.20$
, Mode I; (c)
$\mathit{Ec}_{\infty }=0.20$
, Mode I; (c)
![]() $\mathit{Ec}_{\infty }=0.20$
, Mode II.
$\mathit{Ec}_{\infty }=0.20$
, Mode II.
The LST and DNS studies in previous sections have both focused on the 2-D perturbations where
![]() $\unicode[STIX]{x1D6FD}=0$
. Here we comment on the oblique perturbations. Examples are provided in figure 20, which shows the neutral surface as well as slices of growth rate contours in the
$\unicode[STIX]{x1D6FD}=0$
. Here we comment on the oblique perturbations. Examples are provided in figure 20, which shows the neutral surface as well as slices of growth rate contours in the
![]() $\mathit{Re}_{\unicode[STIX]{x1D6FF}}{-}F{-}B$
diagram;
$\mathit{Re}_{\unicode[STIX]{x1D6FF}}{-}F{-}B$
diagram;
![]() $B=\unicode[STIX]{x1D6FD}/\mathit{Re}_{\unicode[STIX]{x1D6FF}}$
is defined as a global spanwise wavenumber. Figure 20(a) shows that with
$B=\unicode[STIX]{x1D6FD}/\mathit{Re}_{\unicode[STIX]{x1D6FF}}$
is defined as a global spanwise wavenumber. Figure 20(a) shows that with
![]() $T_{\infty }^{\ast }=280~\text{K}$
, the single mode at
$T_{\infty }^{\ast }=280~\text{K}$
, the single mode at
![]() $\mathit{Ec}_{\infty }=0.05$
has a larger growth rate at
$\mathit{Ec}_{\infty }=0.05$
has a larger growth rate at
![]() $B=0$
. Increase in
$B=0$
. Increase in
![]() $B$
results in a diminished overall growth rate and a size-reduced neutral curve. This is however not true for Mode I at
$B$
results in a diminished overall growth rate and a size-reduced neutral curve. This is however not true for Mode I at
![]() $\mathit{Ec}_{\infty }=0.20$
. It is shown in figure 20(b) that the largest growth happens at non-zero spanwise wavenumber
$\mathit{Ec}_{\infty }=0.20$
. It is shown in figure 20(b) that the largest growth happens at non-zero spanwise wavenumber
![]() $B$
. Another example we show is Mode II in figure 20(c). This mode reaches its maximum growth rate at
$B$
. Another example we show is Mode II in figure 20(c). This mode reaches its maximum growth rate at
![]() $B=0$
.
$B=0$
.
A summary of the oblique effects is tabulated in table 2, where we show the results at
![]() $\mathit{Re}_{\unicode[STIX]{x1D6FF}}=2000$
. The optimal spanwise wavenumber at which the growth rate reaches its maximum (over all frequencies) is termed
$\mathit{Re}_{\unicode[STIX]{x1D6FF}}=2000$
. The optimal spanwise wavenumber at which the growth rate reaches its maximum (over all frequencies) is termed
![]() $\unicode[STIX]{x1D6FD}_{m}$
. The growth rate ratio shows the ratio between the maximum growth rate at
$\unicode[STIX]{x1D6FD}_{m}$
. The growth rate ratio shows the ratio between the maximum growth rate at
![]() $\unicode[STIX]{x1D6FD}=\unicode[STIX]{x1D6FD}_{m}$
and the value with
$\unicode[STIX]{x1D6FD}=\unicode[STIX]{x1D6FD}_{m}$
and the value with
![]() $\unicode[STIX]{x1D6FD}=0$
(over all frequencies). Table 2 clearly indicates that 2-D perturbations are the most unstable in the subcritical regime and in the transcritical regime for Mode II. In the supercritical regime for large
$\unicode[STIX]{x1D6FD}=0$
(over all frequencies). Table 2 clearly indicates that 2-D perturbations are the most unstable in the subcritical regime and in the transcritical regime for Mode II. In the supercritical regime for large
![]() $\mathit{Ec}_{\infty }$
and in the transcritical regime for Mode I, oblique perturbations become more unstable.
$\mathit{Ec}_{\infty }$
and in the transcritical regime for Mode I, oblique perturbations become more unstable.
Table 2. Summary of the 3-D perturbation effects at
![]() $\mathit{Re}_{\unicode[STIX]{x1D6FF}}=2000$
;
$\mathit{Re}_{\unicode[STIX]{x1D6FF}}=2000$
;
![]() $\unicode[STIX]{x1D6FD}_{m}$
indicates the optimal spanwise wavenumber at which the growth rate reaches maximum. Growth rate ratio gives the ratio of maximum growth rate at
$\unicode[STIX]{x1D6FD}_{m}$
indicates the optimal spanwise wavenumber at which the growth rate reaches maximum. Growth rate ratio gives the ratio of maximum growth rate at
![]() $\unicode[STIX]{x1D6FD}_{m}$
to the maximum value of 2-D perturbations.
$\unicode[STIX]{x1D6FD}_{m}$
to the maximum value of 2-D perturbations.
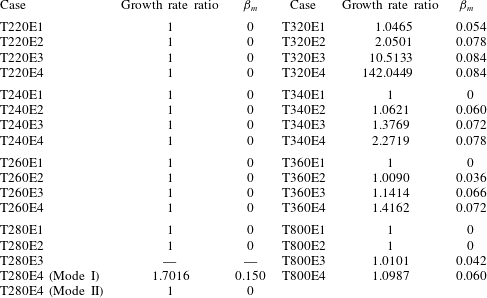

Figure 21. Comparison of the 2-D (
![]() $\unicode[STIX]{x1D6FD}=0$
) and oblique (
$\unicode[STIX]{x1D6FD}=0$
) and oblique (
![]() $\unicode[STIX]{x1D6FD}=\unicode[STIX]{x1D6FD}_{m}$
) eigenfunctions at
$\unicode[STIX]{x1D6FD}=\unicode[STIX]{x1D6FD}_{m}$
) eigenfunctions at
![]() $\mathit{Re}_{\unicode[STIX]{x1D6FF}}=2000$
. (a) Mode I in the transcritical regime,
$\mathit{Re}_{\unicode[STIX]{x1D6FF}}=2000$
. (a) Mode I in the transcritical regime,
![]() $T_{\infty }^{\ast }=280~\text{K}$
,
$T_{\infty }^{\ast }=280~\text{K}$
,
![]() $\mathit{Ec}_{\infty }=0.20$
; (b) the supercritical regime,
$\mathit{Ec}_{\infty }=0.20$
; (b) the supercritical regime,
![]() $T_{\infty }^{\ast }=320~\text{K}$
,
$T_{\infty }^{\ast }=320~\text{K}$
,
![]() $\mathit{Ec}_{\infty }=0.15$
.
$\mathit{Ec}_{\infty }=0.15$
.
![]() $\unicode[STIX]{x1D714}$
is chosen such that each mode reaches its maximum growth rate.
$\unicode[STIX]{x1D714}$
is chosen such that each mode reaches its maximum growth rate.
In terms of eigenfunctions, figure 21 compares profiles of the oblique waves with their 2-D counterpart. Following table 2, we show case T280E4 (Mode I) and T320E3. Both reach maximum growth rate at a non-zero spanwise wavenumber. With
![]() $\unicode[STIX]{x1D6FD}=\unicode[STIX]{x1D6FD}_{m}$
, the growth rate is considerably increased, and eigenfunctions are more mature and confined in the boundary layer. When the perturbation is oblique, the spanwise velocity perturbation
$\unicode[STIX]{x1D6FD}=\unicode[STIX]{x1D6FD}_{m}$
, the growth rate is considerably increased, and eigenfunctions are more mature and confined in the boundary layer. When the perturbation is oblique, the spanwise velocity perturbation
![]() $|{\hat{w}}|$
is present, while the density component
$|{\hat{w}}|$
is present, while the density component
![]() $|\hat{\unicode[STIX]{x1D70C}}|$
becomes relatively smaller. Note that the density profile has been scaled by a factor of 4 in panel (a) for a better display of the results.
$|\hat{\unicode[STIX]{x1D70C}}|$
becomes relatively smaller. Note that the density profile has been scaled by a factor of 4 in panel (a) for a better display of the results.
5 Conclusion
Instabilities of compressible boundary-layer flows with non-ideal fluids are studied. As a typical example of a fluid in its highly non-ideal thermo-physical region, we consider carbon dioxide (
![]() $\text{CO}_{2}$
) at a supercritical pressure of 80 bar. The investigation is accomplished using linear stability theory (LST), direct numerical simulation (DNS) and the inviscid analysis, which are based on the compressible Navier–Stokes equations expressed for a generic fluid. To account for non-ideal-gas effects, the thermodynamic and transport properties as well as the equation of state are obtained from the NIST database and tabulated for computational efficiency. In terms of the Widom line (
$\text{CO}_{2}$
) at a supercritical pressure of 80 bar. The investigation is accomplished using linear stability theory (LST), direct numerical simulation (DNS) and the inviscid analysis, which are based on the compressible Navier–Stokes equations expressed for a generic fluid. To account for non-ideal-gas effects, the thermodynamic and transport properties as well as the equation of state are obtained from the NIST database and tabulated for computational efficiency. In terms of the Widom line (
![]() $T_{pc}^{\ast }=307.7~\text{K}$
at 80 bar), the study has covered the sub-, trans- and supercritical temperature regimes, which are determined by the specified free-stream temperature (
$T_{pc}^{\ast }=307.7~\text{K}$
at 80 bar), the study has covered the sub-, trans- and supercritical temperature regimes, which are determined by the specified free-stream temperature (
![]() $T_{\infty }^{\ast }=220$
, 240, 260, 280, 320, 340, 360 and 800 K), adiabatic wall boundary conditions and the Eckert number
$T_{\infty }^{\ast }=220$
, 240, 260, 280, 320, 340, 360 and 800 K), adiabatic wall boundary conditions and the Eckert number
![]() $\mathit{Ec}_{\infty }$
that controls the viscous heating. The laminar base flows are given by the self-similar solutions of the boundary-layer equation and validated by DNS.
$\mathit{Ec}_{\infty }$
that controls the viscous heating. The laminar base flows are given by the self-similar solutions of the boundary-layer equation and validated by DNS.
Besides stabilization of compressibility effects (increase
![]() $\mathit{Ec}_{\infty }$
), the boundary-layer flow is further stabilized by non-ideal-gas effects in the subcritical or supercritical regime. In either regime, the temperature profile remains below or above
$\mathit{Ec}_{\infty }$
), the boundary-layer flow is further stabilized by non-ideal-gas effects in the subcritical or supercritical regime. In either regime, the temperature profile remains below or above
![]() $T_{pc}^{\ast }$
, the stabilization is more prominent when
$T_{pc}^{\ast }$
, the stabilization is more prominent when
![]() $T_{\infty }^{\ast }$
is closer to
$T_{\infty }^{\ast }$
is closer to
![]() $T_{pc}^{\ast }$
and/or
$T_{pc}^{\ast }$
and/or
![]() $\mathit{Ec}_{\infty }$
is increased. However, the flow is considerably destabilized in the transcritical regime through a new unstable mode (Mode II) found in addition to the conventional mode (Mode I). In this regime, the dual modes co-exist, and their neutral curves partly overlap with each other. The growth rate of Mode II increases vigorously with
$\mathit{Ec}_{\infty }$
is increased. However, the flow is considerably destabilized in the transcritical regime through a new unstable mode (Mode II) found in addition to the conventional mode (Mode I). In this regime, the dual modes co-exist, and their neutral curves partly overlap with each other. The growth rate of Mode II increases vigorously with
![]() $\mathit{Ec}_{\infty }$
and can become an order of magnitude larger than Mode I. The unstable band of frequency and Reynolds number
$\mathit{Ec}_{\infty }$
and can become an order of magnitude larger than Mode I. The unstable band of frequency and Reynolds number
![]() $\mathit{Re}_{\unicode[STIX]{x1D6FF}}$
for Mode II are much larger. DNS has witnessed quantitatively agreements with LST and the co-existence of the dual modes.
$\mathit{Re}_{\unicode[STIX]{x1D6FF}}$
for Mode II are much larger. DNS has witnessed quantitatively agreements with LST and the co-existence of the dual modes.

Figure 22. Summary of the non-ideal-gas effects on boundary-layer instability. Horizontal line segments stand for the temperature range of the base flow for each case. The red vertical line shows the pseudo-critical temperature
![]() $T_{pc}^{\ast }=307.7~\text{K}$
.
$T_{pc}^{\ast }=307.7~\text{K}$
.
A summary of result is given in figure 22. For each case, the temperature ranges of the base flows (from free stream to the wall) are denoted with line segments. In all three regimes, density perturbation becomes the dominating components (absolute value of the perturbations) when compressibility and non-ideal-gas effects are strong (when
![]() $T_{\infty }^{\ast }$
is closer to
$T_{\infty }^{\ast }$
is closer to
![]() $T_{pc}^{\ast }$
and
$T_{pc}^{\ast }$
and
![]() $\mathit{Ec}_{\infty }$
is large). The reason lies in massive density gradient
$\mathit{Ec}_{\infty }$
is large). The reason lies in massive density gradient
![]() $\unicode[STIX]{x2202}\unicode[STIX]{x1D70C}_{0}/\unicode[STIX]{x2202}y$
of the laminar flow and the balancing mechanism of the linearized continuity equation. The other cases are dominated by the streamwise velocity component. The two arrows indicate the stabilization in the sub- and supercritical regimes. Note that the current study is up to
$\unicode[STIX]{x2202}\unicode[STIX]{x1D70C}_{0}/\unicode[STIX]{x2202}y$
of the laminar flow and the balancing mechanism of the linearized continuity equation. The other cases are dominated by the streamwise velocity component. The two arrows indicate the stabilization in the sub- and supercritical regimes. Note that the current study is up to
![]() $\mathit{Ec}_{\infty }=0.20$
(
$\mathit{Ec}_{\infty }=0.20$
(
![]() $\mathit{Ma}\leqslant 2$
) and therefore not influenced by hypersonic effects. In hypersonic flows, temperature perturbation can become the most prominent for ideal-gas flows (for example Görtler instability at
$\mathit{Ma}\leqslant 2$
) and therefore not influenced by hypersonic effects. In hypersonic flows, temperature perturbation can become the most prominent for ideal-gas flows (for example Görtler instability at
![]() $\mathit{Ma}=6$
reported in Ren & Fu Reference Ren and Fu2015).
$\mathit{Ma}=6$
reported in Ren & Fu Reference Ren and Fu2015).
The oblique perturbations are also commented on in this study. In the subcritical regime, 2-D perturbations are more unstable. While in the supercritical regime, oblique perturbations are more important unless the free-stream temperature is large or/and the Eckert is small so that the flow is close to isothermal. In the transcritical regime, Mode I and Mode II are more important in three and two dimensions, respectively.
The inviscid analysis shows that in the transcritical regime, Mode II is not caused by the trapped acoustic waves which is deemed to give rise to higher modes in hypersonic flows. We show that the generalized inflection point criterion expressed in density
![]() $D(\unicode[STIX]{x1D70C}_{0}DU_{0})$
is valid for non-ideal gases. As result, an inviscid mechanism is present in the trans- and supercritical regimes in contrast to the subcritical regime which contains the viscous instability only.
$D(\unicode[STIX]{x1D70C}_{0}DU_{0})$
is valid for non-ideal gases. As result, an inviscid mechanism is present in the trans- and supercritical regimes in contrast to the subcritical regime which contains the viscous instability only.
Acknowledgements
J.R. and R.P. thank the Netherlands Organization for Scientific Research (NWO) for funding this research through the grant with project number 14711 and for the access to large-scale computing facilities through the grant with the dossier number SSH-223-13.
Supplementary movie
Supplementary movie is available at https://doi.org/10.1017/jfm.2019.348.
Appendix A. Fluid property tables
This study employs the look-up table method to obtain the fluid properties needed for the laminar base flow, linear stability analysis as well as the direct numerical simulation. The NIST REFPROP library (Lemmon, Huber & McLinden Reference Lemmon, Huber and McLinden2013; Span & Wagner Reference Span and Wagner2003) is adopted to generate the tables. The one-dimensional table is obtained by keeping pressure constant and is used for the self-similar solution and linear stability analysis. Figure 23 shows part of the table (
![]() $\unicode[STIX]{x1D70C}^{\ast }$
,
$\unicode[STIX]{x1D70C}^{\ast }$
,
![]() $\mathit{Pr}$
,
$\mathit{Pr}$
,
![]() $\unicode[STIX]{x1D707}^{\ast }$
and
$\unicode[STIX]{x1D707}^{\ast }$
and
![]() $\unicode[STIX]{x1D705}^{\ast }$
). Dashed lines show the value under the ideal-gas assumption. It is obvious that the non-ideal-gas effects are most prominent near the critical point, and the fluid approaches the ideal gas regime only when the temperature is sufficiently large. The derivatives of the properties, such as
$\unicode[STIX]{x1D705}^{\ast }$
). Dashed lines show the value under the ideal-gas assumption. It is obvious that the non-ideal-gas effects are most prominent near the critical point, and the fluid approaches the ideal gas regime only when the temperature is sufficiently large. The derivatives of the properties, such as
![]() $\unicode[STIX]{x2202}\unicode[STIX]{x1D707}/\unicode[STIX]{x2202}\unicode[STIX]{x1D70C}$
,
$\unicode[STIX]{x2202}\unicode[STIX]{x1D707}/\unicode[STIX]{x2202}\unicode[STIX]{x1D70C}$
,
![]() $\unicode[STIX]{x2202}^{2}p/\unicode[STIX]{x2202}T^{2}$
are also important in building the stability operator. The gradients are determined using a second-order finite differences method (numerical details can be found in Ren et al.
Reference Ren, Fu and Pecnik2019).
$\unicode[STIX]{x2202}^{2}p/\unicode[STIX]{x2202}T^{2}$
are also important in building the stability operator. The gradients are determined using a second-order finite differences method (numerical details can be found in Ren et al.
Reference Ren, Fu and Pecnik2019).
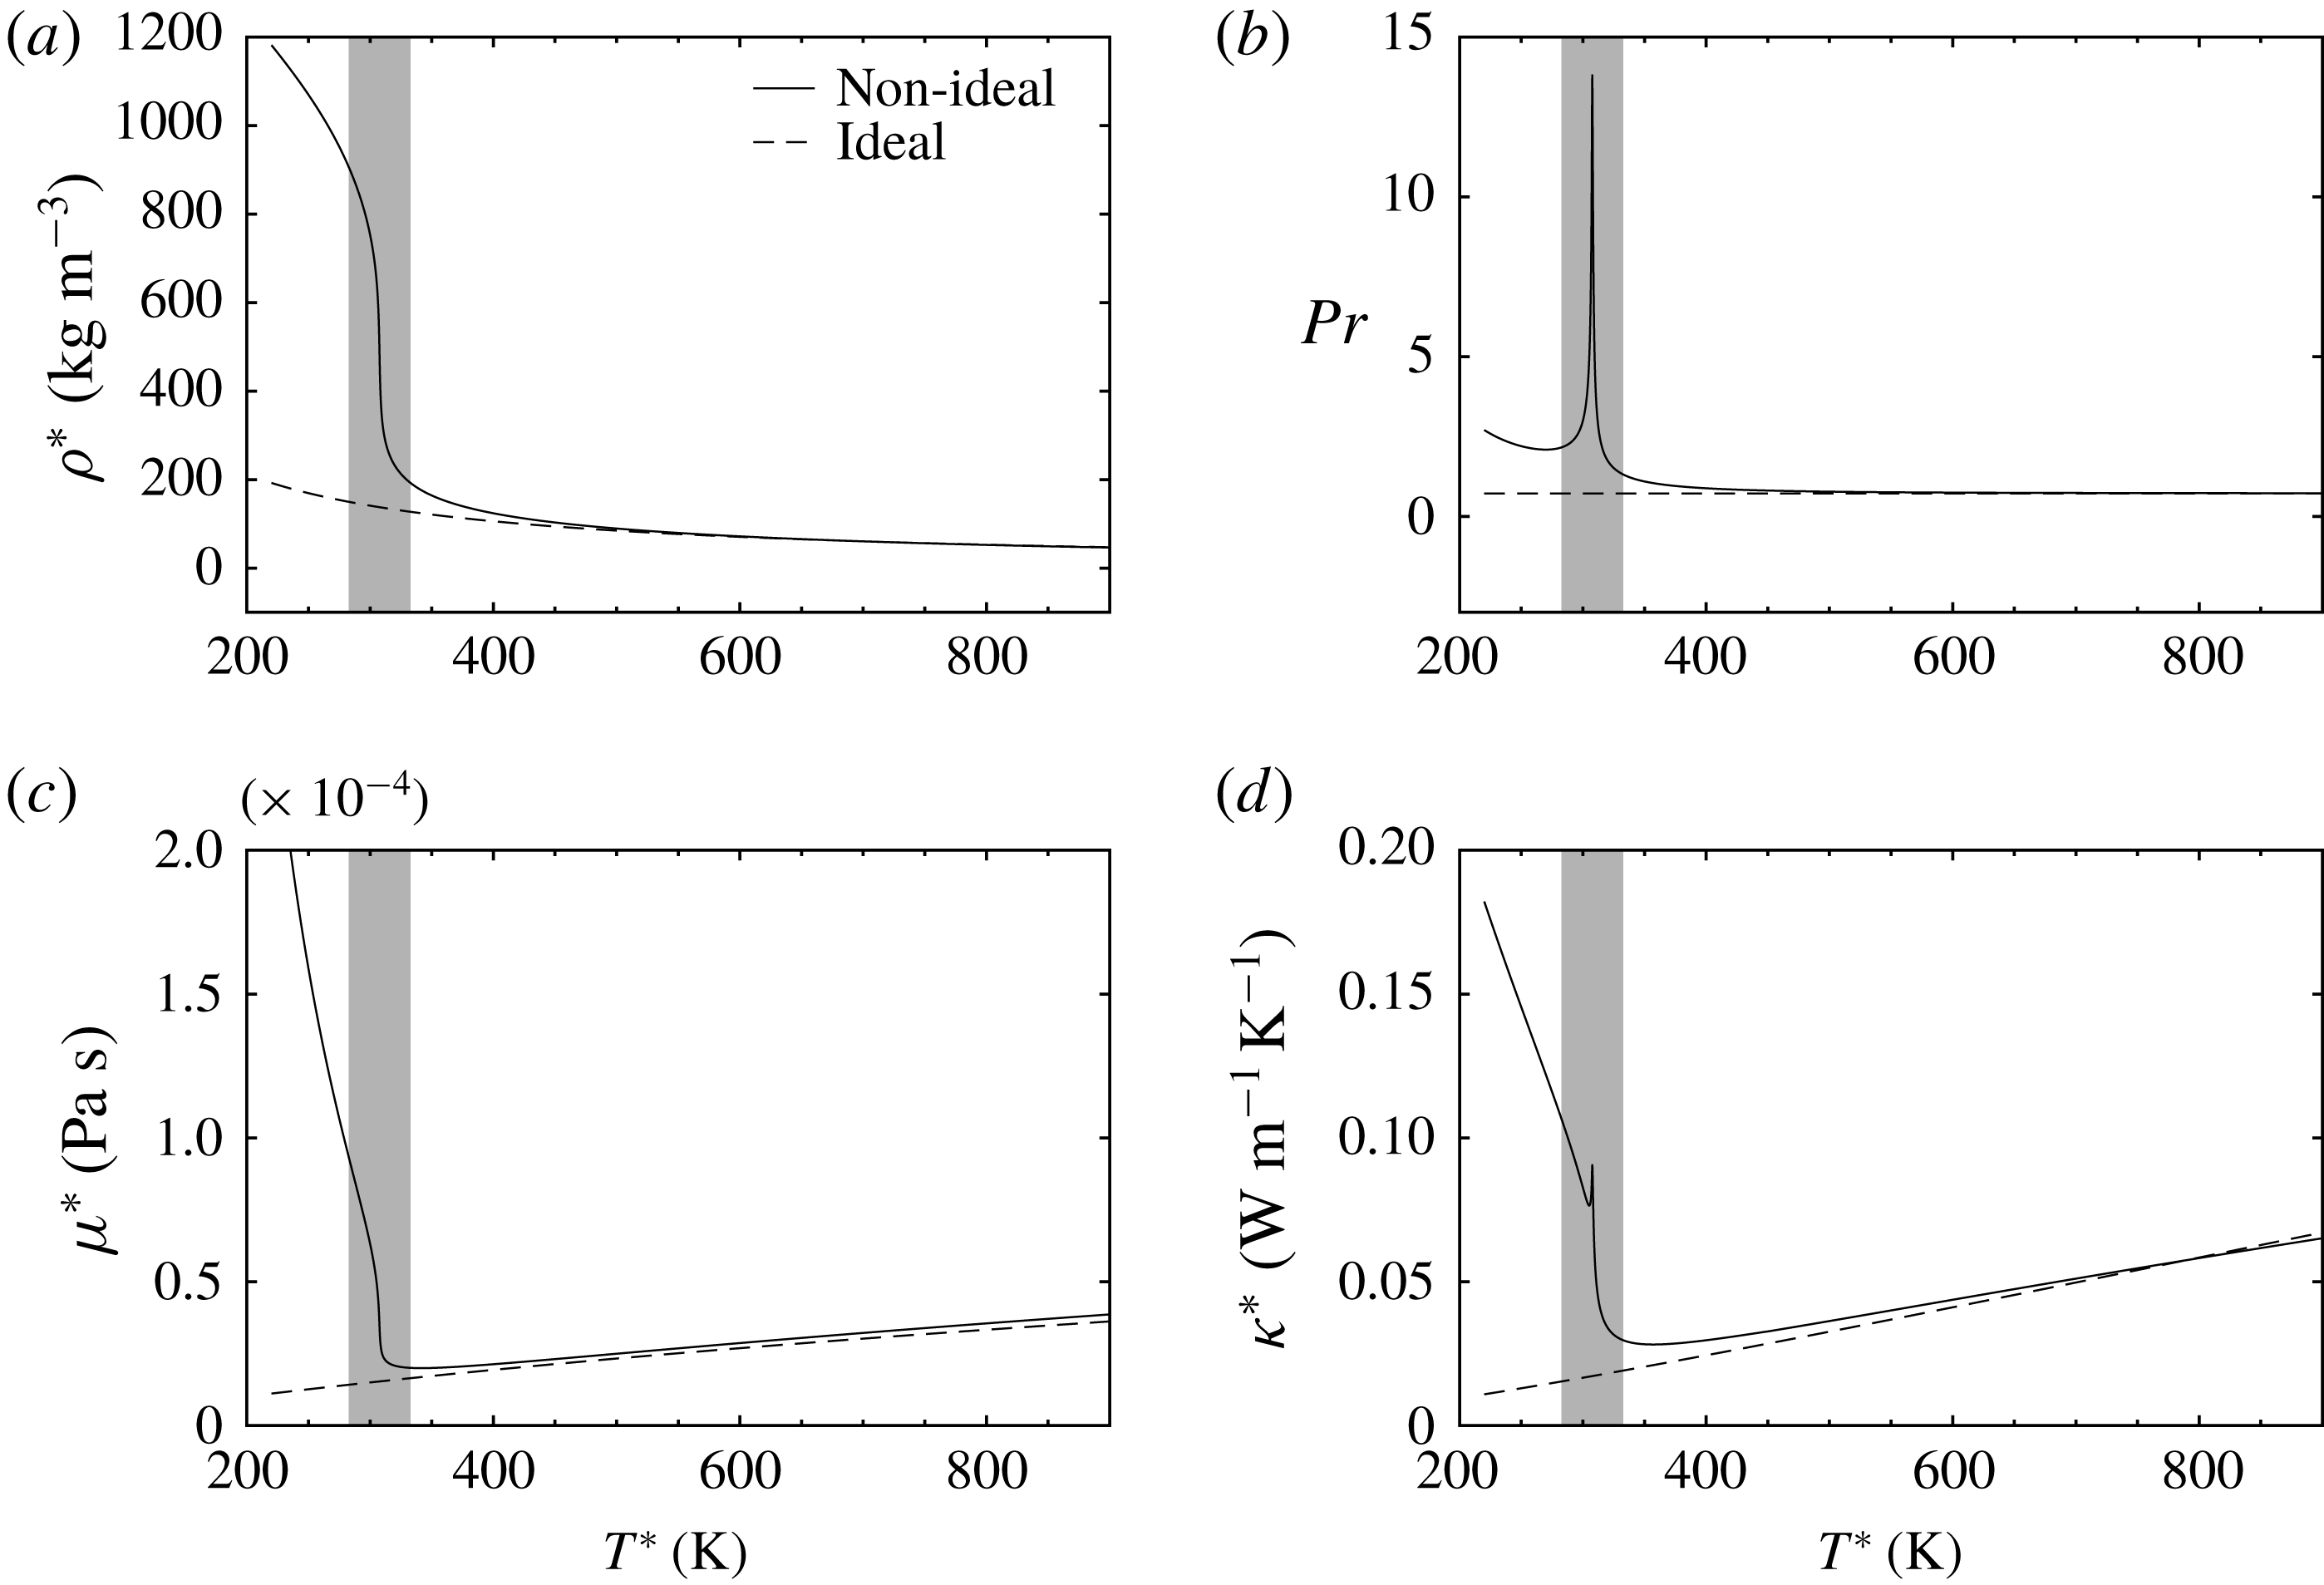
Figure 23. Visualization of the one-dimensional property table for
![]() $\text{CO}_{2}$
at
$\text{CO}_{2}$
at
![]() $p^{\ast }=80$
bar. Panels show density (a), Prandtl number (b), viscosity (c) and thermal conductivity (d) as functions of temperature. The shaded area indicates the region close to the pseudo-critical point where non-ideal-gas effects are prominent.
$p^{\ast }=80$
bar. Panels show density (a), Prandtl number (b), viscosity (c) and thermal conductivity (d) as functions of temperature. The shaded area indicates the region close to the pseudo-critical point where non-ideal-gas effects are prominent.
In DNS, two-dimensional tables are required to obtain the properties. The 2-D tables are generated in the
![]() $\unicode[STIX]{x1D70C}^{\ast }{-}e^{\ast }$
diagram. Figure 24 shows the 2-D table for pressure, temperature, viscosity and thermal conductivity as functions of
$\unicode[STIX]{x1D70C}^{\ast }{-}e^{\ast }$
diagram. Figure 24 shows the 2-D table for pressure, temperature, viscosity and thermal conductivity as functions of
![]() $\unicode[STIX]{x1D70C}^{\ast }$
and
$\unicode[STIX]{x1D70C}^{\ast }$
and
![]() $e^{\ast }$
. Note that in the DNS for different free-stream temperatures, the range of
$e^{\ast }$
. Note that in the DNS for different free-stream temperatures, the range of
![]() $\unicode[STIX]{x1D70C}^{\ast }$
and
$\unicode[STIX]{x1D70C}^{\ast }$
and
![]() $e^{\ast }$
have been adjusted so that the table maintains high accuracy and proper size. During the integration of the N–S equations, only the data very close to the isobar are actually used. The data in the two-phase region are not determinant and have been assigned a value of
$e^{\ast }$
have been adjusted so that the table maintains high accuracy and proper size. During the integration of the N–S equations, only the data very close to the isobar are actually used. The data in the two-phase region are not determinant and have been assigned a value of
![]() $-1$
for all the properties. It has been checked that the data in the two-phase region are not used.
$-1$
for all the properties. It has been checked that the data in the two-phase region are not used.
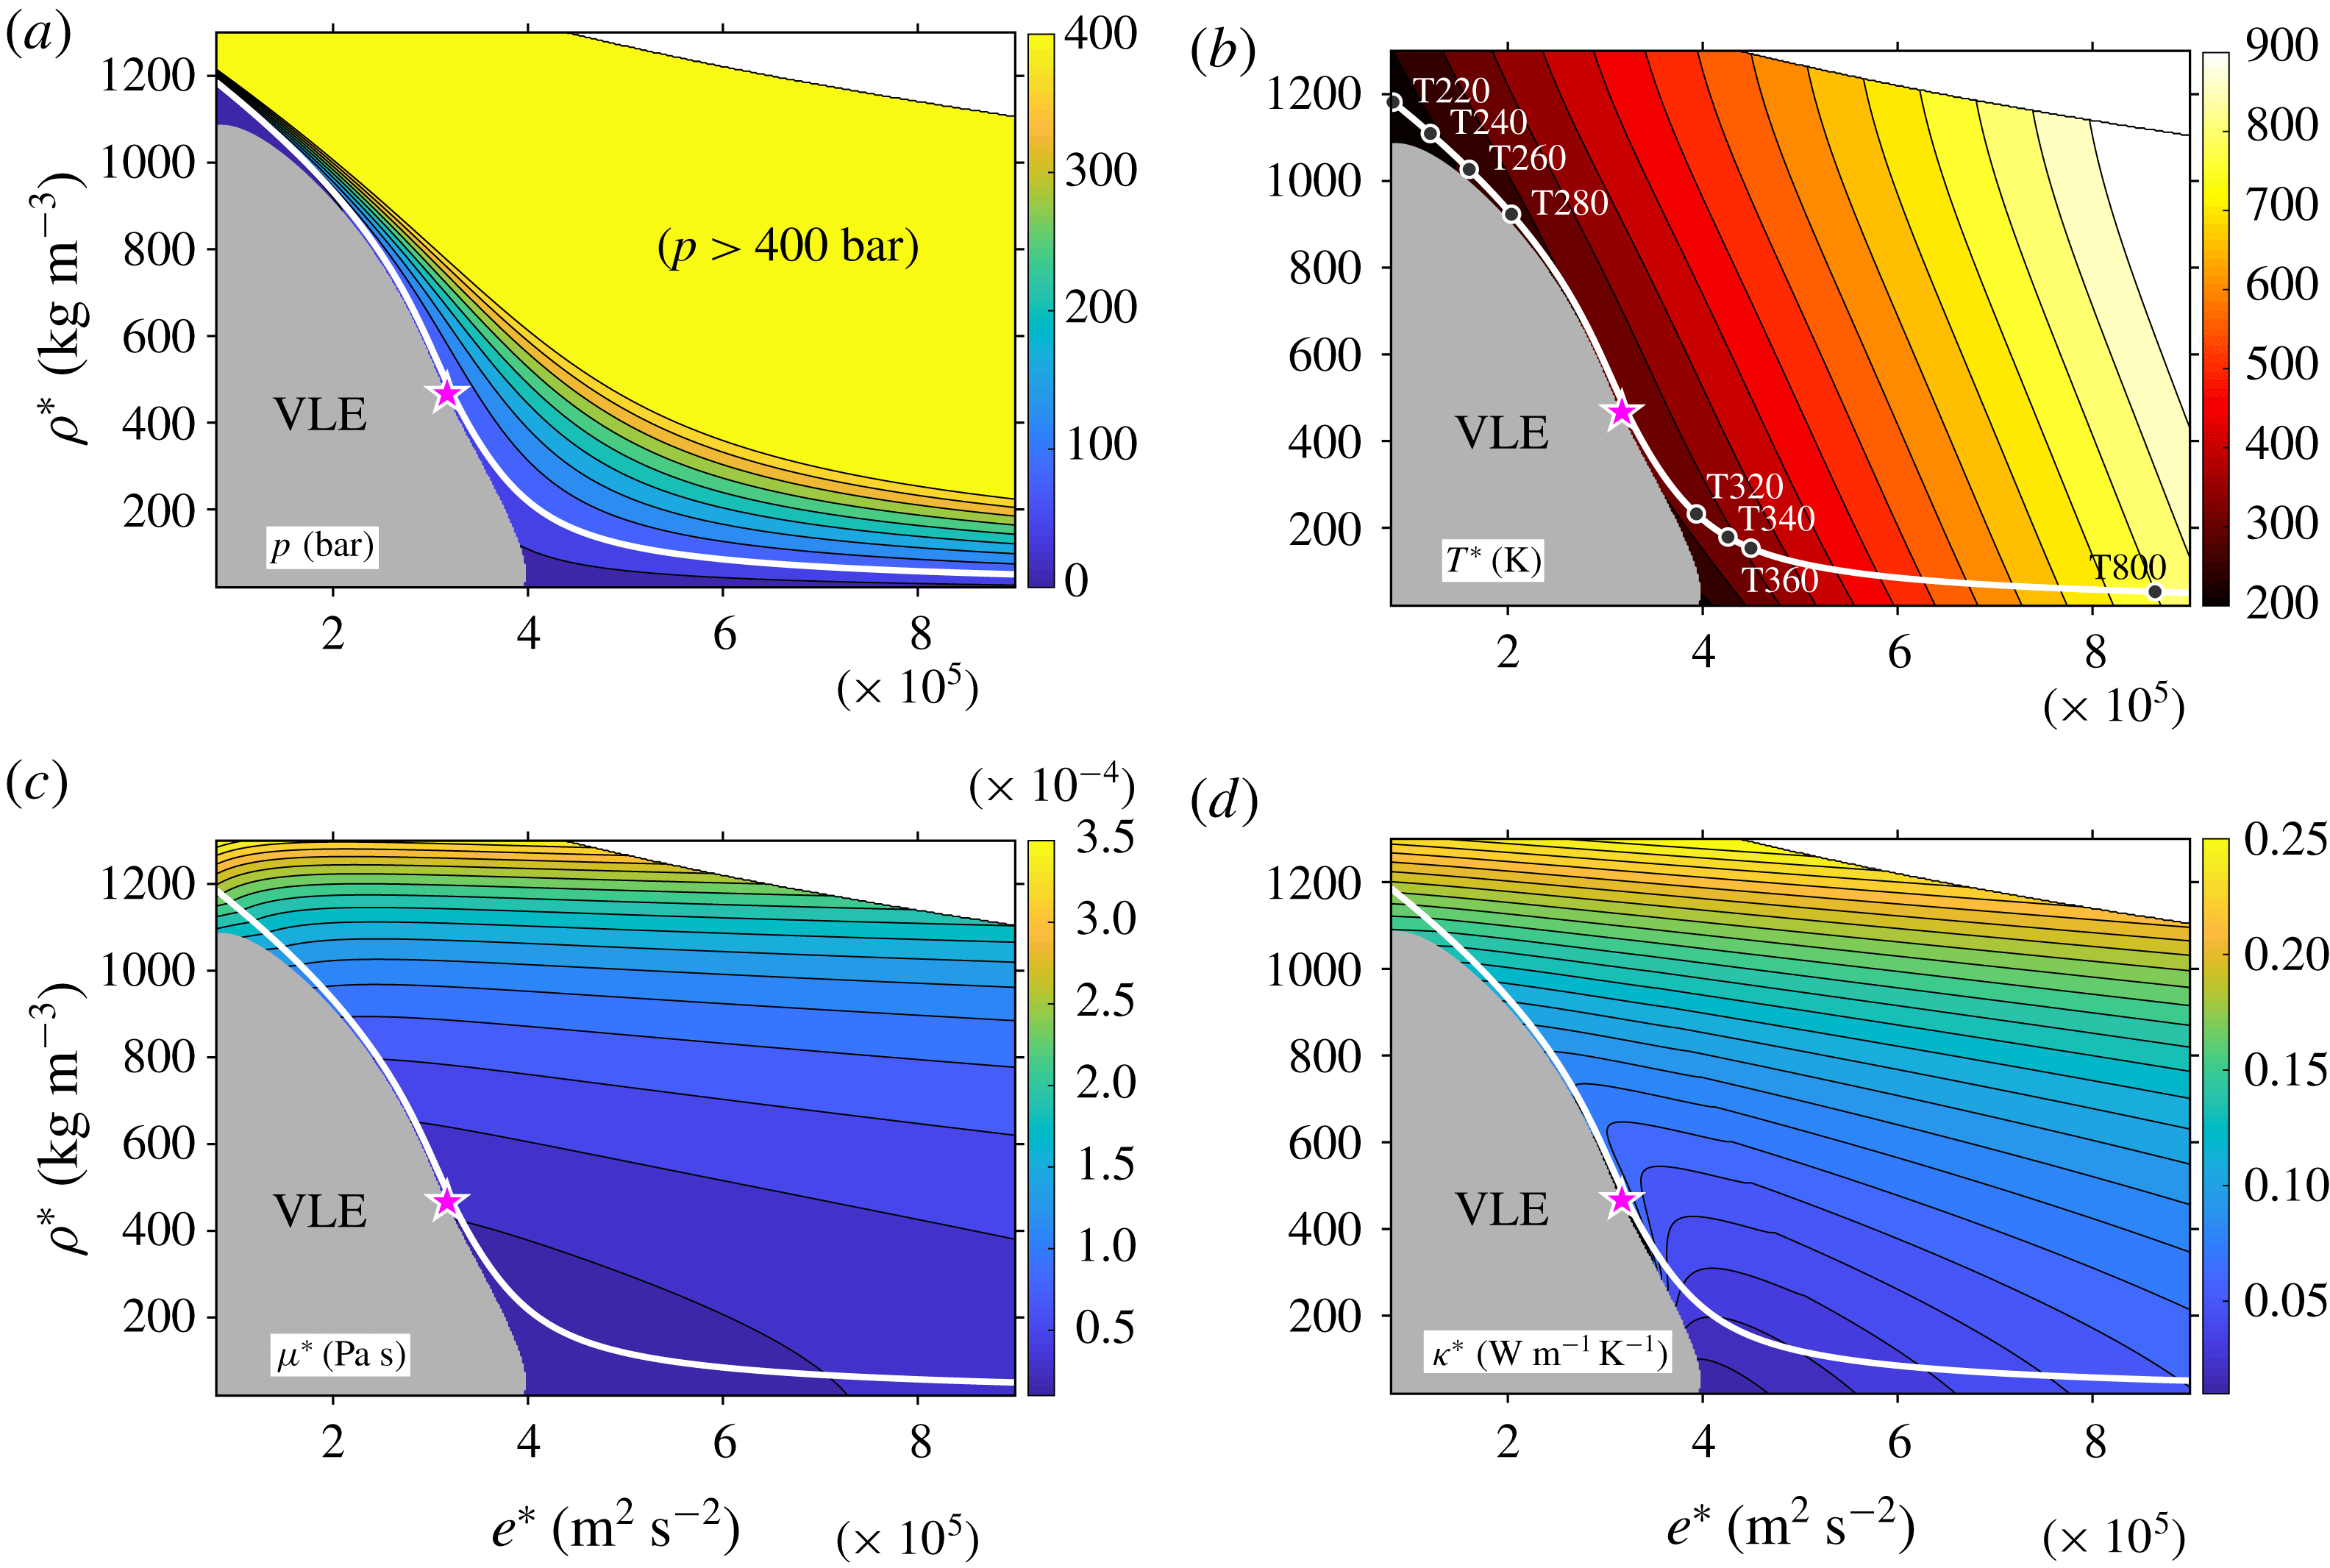
Figure 24. Visualization of the two-dimensional property table for
![]() $\text{CO}_{2}$
. Panels show pressure (a), temperature (b), viscosity (c) and thermal conductivity (d) as functions of internal energy
$\text{CO}_{2}$
. Panels show pressure (a), temperature (b), viscosity (c) and thermal conductivity (d) as functions of internal energy
![]() $e^{\ast }$
and density
$e^{\ast }$
and density
![]() $\unicode[STIX]{x1D70C}^{\ast }$
. The white line in each panel shows the isobar of 80. The star indicates the critical point. VLE stands for the region of vapour–liquid equilibrium.
$\unicode[STIX]{x1D70C}^{\ast }$
. The white line in each panel shows the isobar of 80. The star indicates the critical point. VLE stands for the region of vapour–liquid equilibrium.
Appendix B. Validation of the self-similar solution
The self-similar solution to the boundary-layer equation with highly non-ideal gas is validated by comparing with the DNS. Figure 25 shows an example in the transcritical regime (
![]() $T_{\infty }^{\ast }=280~\text{K}$
,
$T_{\infty }^{\ast }=280~\text{K}$
,
![]() $\mathit{Ec}_{\infty }=0.20$
), of which non-ideal-gas effects are the most intense. The DNS is performed by integrating the N–S equations from the self-similar solution as initial fields until the flow is steady and fully developed. Figure 25 shows a perfect match with DNS which justifies the self-similar solution.
$\mathit{Ec}_{\infty }=0.20$
), of which non-ideal-gas effects are the most intense. The DNS is performed by integrating the N–S equations from the self-similar solution as initial fields until the flow is steady and fully developed. Figure 25 shows a perfect match with DNS which justifies the self-similar solution.

Figure 25. Validation of the self-similar solution by DNS. The flow parameters are
![]() $T_{\infty }^{\ast }=280~\text{K}$
,
$T_{\infty }^{\ast }=280~\text{K}$
,
![]() $\mathit{Ec}_{\infty }=0.20$
.
$\mathit{Ec}_{\infty }=0.20$
.
Appendix C. DNS validation in the subcritical regime

Figure 26. DNS validation in the subcritical regime with
![]() $T_{\infty }^{\ast }=240~\text{K}$
(a1–a3) and
$T_{\infty }^{\ast }=240~\text{K}$
(a1–a3) and
![]() $T_{\infty }^{\ast }=280~\text{K}$
(b1–b3). Panels (a1,b1) show the neutral curve in the
$T_{\infty }^{\ast }=280~\text{K}$
(b1–b3). Panels (a1,b1) show the neutral curve in the
![]() $F{-}x$
diagram. The blue solid line indicates the frequency of wall blowing/suction introduced to excite the T–S wave. Panels (a2,b2,a3,b3) provide comparisons of the growth rate and phase velocity between DNS and LST. The arrows in (a2,b2) indicate the position where wall blowing/suction is introduced.
$F{-}x$
diagram. The blue solid line indicates the frequency of wall blowing/suction introduced to excite the T–S wave. Panels (a2,b2,a3,b3) provide comparisons of the growth rate and phase velocity between DNS and LST. The arrows in (a2,b2) indicate the position where wall blowing/suction is introduced.
The results reported in this appendix serve as DNS validations of the LST prediction in the subcritical regime (T240 and T280), except for the case with
![]() $T_{\infty }^{\ast }=280~\text{K}$
and
$T_{\infty }^{\ast }=280~\text{K}$
and
![]() $\mathit{Ec}_{\infty }=0.18$
, which has just entered the transcritical regime. Figure 26(a1,b1) shows the neutral curves in
$\mathit{Ec}_{\infty }=0.18$
, which has just entered the transcritical regime. Figure 26(a1,b1) shows the neutral curves in
![]() $F{-}x$
diagram. The frequency
$F{-}x$
diagram. The frequency
![]() $F=31\times 10^{-6}/F=15\times 10^{-6}$
cuts through the corresponding neutral curves and is introduced into the laminar flow via wall blowing/suction at the streamwise location indicated with an arrow in figure 26(a2,b2). Since a larger
$F=31\times 10^{-6}/F=15\times 10^{-6}$
cuts through the corresponding neutral curves and is introduced into the laminar flow via wall blowing/suction at the streamwise location indicated with an arrow in figure 26(a2,b2). Since a larger
![]() $\mathit{Re}_{\unicode[STIX]{x1D6FF}}$
is needed for the
$\mathit{Re}_{\unicode[STIX]{x1D6FF}}$
is needed for the
![]() $\mathit{Ec}_{\infty }=0.16$
and 0.18 cases of T280, and to better resolve these two cases, a smaller domain is used. The results have been verified to be mesh independent for all cases. Comparing the results, DNS and LST give rather satisfactory matches, verifying the stabilization of the non-ideal-gas effects in the subcritical regime, as well as the destabilization of Mode I when the flow enters transcritical regime (
$\mathit{Ec}_{\infty }=0.16$
and 0.18 cases of T280, and to better resolve these two cases, a smaller domain is used. The results have been verified to be mesh independent for all cases. Comparing the results, DNS and LST give rather satisfactory matches, verifying the stabilization of the non-ideal-gas effects in the subcritical regime, as well as the destabilization of Mode I when the flow enters transcritical regime (
![]() $T_{\infty }^{\ast }=280~\text{K}$
,
$T_{\infty }^{\ast }=280~\text{K}$
,
![]() $\mathit{Ec}_{\infty }=0.18$
). It is worth noting, in the subcritical regime, when
$\mathit{Ec}_{\infty }=0.18$
). It is worth noting, in the subcritical regime, when
![]() $T_{\infty }^{\ast }\ll T_{pc}^{\ast }$
, the phase velocity becomes much less sensitive to
$T_{\infty }^{\ast }\ll T_{pc}^{\ast }$
, the phase velocity becomes much less sensitive to
![]() $\mathit{Ec}_{\infty }$
.
$\mathit{Ec}_{\infty }$
.
Appendix D. Mathematical proof of (4.7)
To derive the relative Mach number, the following rules (see Thorade & Saadat Reference Thorade and Saadat2013) for the partial derivatives have been used,
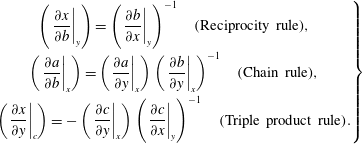 $$\begin{eqnarray}\left.\begin{array}{@{}c@{}}\displaystyle \left(\left.{\displaystyle \frac{\unicode[STIX]{x2202}x}{\unicode[STIX]{x2202}b}}\right|_{y}\right)=\left(\left.{\displaystyle \frac{\unicode[STIX]{x2202}b}{\unicode[STIX]{x2202}x}}\right|_{y}\right)^{-1}\quad \text{(Reciprocity rule)},\\ \left(\left.{\displaystyle \frac{\unicode[STIX]{x2202}a}{\unicode[STIX]{x2202}b}}\right|_{x}\right)=\left(\left.{\displaystyle \frac{\unicode[STIX]{x2202}a}{\unicode[STIX]{x2202}y}}\right|_{x}\right)\left(\left.{\displaystyle \frac{\unicode[STIX]{x2202}b}{\unicode[STIX]{x2202}y}}\right|_{x}\right)^{-1}\quad \text{(Chain rule)},\\ \left(\left.{\displaystyle \frac{\unicode[STIX]{x2202}x}{\unicode[STIX]{x2202}y}}\right|_{c}\right)=-\left(\left.{\displaystyle \frac{\unicode[STIX]{x2202}c}{\unicode[STIX]{x2202}y}}\right|_{x}\right)\left(\left.{\displaystyle \frac{\unicode[STIX]{x2202}c}{\unicode[STIX]{x2202}x}}\right|_{y}\right)^{-1}\quad \text{(Triple product rule)}.\end{array}\right\}\end{eqnarray}$$
We omit the subscript ‘0’ for base flow below. Using these rules, the speed of sound squared can be written as
 $$\begin{eqnarray}\displaystyle \left(\left.{\displaystyle \frac{\unicode[STIX]{x2202}p}{\unicode[STIX]{x2202}\unicode[STIX]{x1D70C}}}\right|_{s}\right) & = & \displaystyle \left(\left.{\displaystyle \frac{\unicode[STIX]{x2202}p}{\unicode[STIX]{x2202}\unicode[STIX]{x1D70C}}}\right|_{e}\right)-\left(\left.{\displaystyle \frac{\unicode[STIX]{x2202}p}{\unicode[STIX]{x2202}e}}\right|_{\unicode[STIX]{x1D70C}}\right)\left(\left.{\displaystyle \frac{\unicode[STIX]{x2202}s}{\unicode[STIX]{x2202}\unicode[STIX]{x1D70C}}}\right|_{e}\right)\left(\left.{\displaystyle \frac{\unicode[STIX]{x2202}s}{\unicode[STIX]{x2202}e}}\right|_{\unicode[STIX]{x1D70C}}\right)^{-1}\nonumber\\ \displaystyle & = & \displaystyle \left(\left.{\displaystyle \frac{\unicode[STIX]{x2202}p}{\unicode[STIX]{x2202}\unicode[STIX]{x1D70C}}}\right|_{e}\right)+\left(\left.{\displaystyle \frac{\unicode[STIX]{x2202}p}{\unicode[STIX]{x2202}e}}\right|_{\unicode[STIX]{x1D70C}}\right)\left(\left.{\displaystyle \frac{\unicode[STIX]{x2202}e}{\unicode[STIX]{x2202}\unicode[STIX]{x1D70C}}}\right|_{s}\right)\nonumber\\ \displaystyle & = & \displaystyle \left(\left.{\displaystyle \frac{\unicode[STIX]{x2202}p}{\unicode[STIX]{x2202}\unicode[STIX]{x1D70C}}}\right|_{e}\right)-\left(\left.{\displaystyle \frac{\unicode[STIX]{x2202}e}{\unicode[STIX]{x2202}\unicode[STIX]{x1D70C}}}\right|_{s}\right)\left(\left.{\displaystyle \frac{\unicode[STIX]{x2202}\unicode[STIX]{x1D70C}}{\unicode[STIX]{x2202}e}}\right|_{p}\right)\left(\left.{\displaystyle \frac{\unicode[STIX]{x2202}p}{\unicode[STIX]{x2202}\unicode[STIX]{x1D70C}}}\right|_{e}\right)\nonumber\\ \displaystyle & = & \displaystyle \left(\left.{\displaystyle \frac{\unicode[STIX]{x2202}p}{\unicode[STIX]{x2202}\unicode[STIX]{x1D70C}}}\right|_{e}\right)-\left(\left.{\displaystyle \frac{\unicode[STIX]{x2202}e}{\unicode[STIX]{x2202}\unicode[STIX]{x1D717}}}\right|_{s}\right)\left(\left.{\displaystyle \frac{\unicode[STIX]{x2202}\unicode[STIX]{x1D717}}{\unicode[STIX]{x2202}e}}\right|_{p}\right)\left(\left.{\displaystyle \frac{\unicode[STIX]{x2202}p}{\unicode[STIX]{x2202}\unicode[STIX]{x1D70C}}}\right|_{e}\right)\nonumber\\ \displaystyle & = & \displaystyle \left(\left.{\displaystyle \frac{\unicode[STIX]{x2202}\unicode[STIX]{x1D70C}}{\unicode[STIX]{x2202}p}}\right|_{e}\right)^{-1}\left[1-\left(\left.{\displaystyle \frac{\unicode[STIX]{x2202}e}{\unicode[STIX]{x2202}\unicode[STIX]{x1D717}}}\right|_{s}\right)\left(\left.{\displaystyle \frac{\unicode[STIX]{x2202}\unicode[STIX]{x1D717}}{\unicode[STIX]{x2202}e}}\right|_{p}\right)\right]\nonumber\\ \displaystyle & = & \displaystyle \left(\left.{\displaystyle \frac{\unicode[STIX]{x2202}\unicode[STIX]{x1D70C}}{\unicode[STIX]{x2202}p}}\right|_{e}\right)^{-1}\left[1-{\displaystyle \frac{p}{\unicode[STIX]{x1D70C}^{2}}}\left(\left.{\displaystyle \frac{\unicode[STIX]{x2202}\unicode[STIX]{x1D70C}}{\unicode[STIX]{x2202}e}}\right|_{p}\right)\right].\end{eqnarray}$$
Note that according to the first law of thermodynamics,
![]() $p=-(\unicode[STIX]{x2202}e/\unicode[STIX]{x2202}\unicode[STIX]{x1D717}|_{s})$
. The relative Mach number in (4.7) can thus be derived from (4.6).
$p=-(\unicode[STIX]{x2202}e/\unicode[STIX]{x2202}\unicode[STIX]{x1D717}|_{s})$
. The relative Mach number in (4.7) can thus be derived from (4.6).


