Beetroot (Beta vulgaris ssp. vulgaris var. rubra, Chenopodiaceae) is a common ingredient of Eastern and Central European diets(Reference Kapadia, Rao and Bhagyalakshmi1, Reference Moreno, Garcia-Viguera and Gil2). Beetroot juice is also used as a popular folk remedy for the treatment of liver and kidney diseases as well as for the stimulation of immune and haematopoietic systems. Recently, there has been considerable interest in the anticancer properties of red beet and the use of the products of beetroot or its constituents as dietary supplements for the prevention of cancer. Chemoprevention is described as the application of natural or synthetic compounds to prevent, suppress, delay or reverse the process of carcinogenesis(Reference Suhr3). In this regard, beetroot extract has been identified as a potent chemopreventive agent inhibiting N-nitrosodimethylamine (NDEA)-induced hepatocarcinogenesis in mice(Reference Kapadia, Azuine and Sridhar4). The most interesting observation made in this study was that the cancer chemopreventive effect was exhibited at a very low dose, indicating that beetroot warrants more attention for possible human applications in the control of malignancy. Our recent study has shown that beetroot juice can also protect against NDEA-induced liver injury in rats and that this effect might be related to the induction of expression of phase II enzymes such as NAD(P)H:quinone oxidoreductase 1 (NQO1) and glutathione S-transferases (GST)(Reference Krajka-Kuźniak, Szaefer and Ignatowicz5).
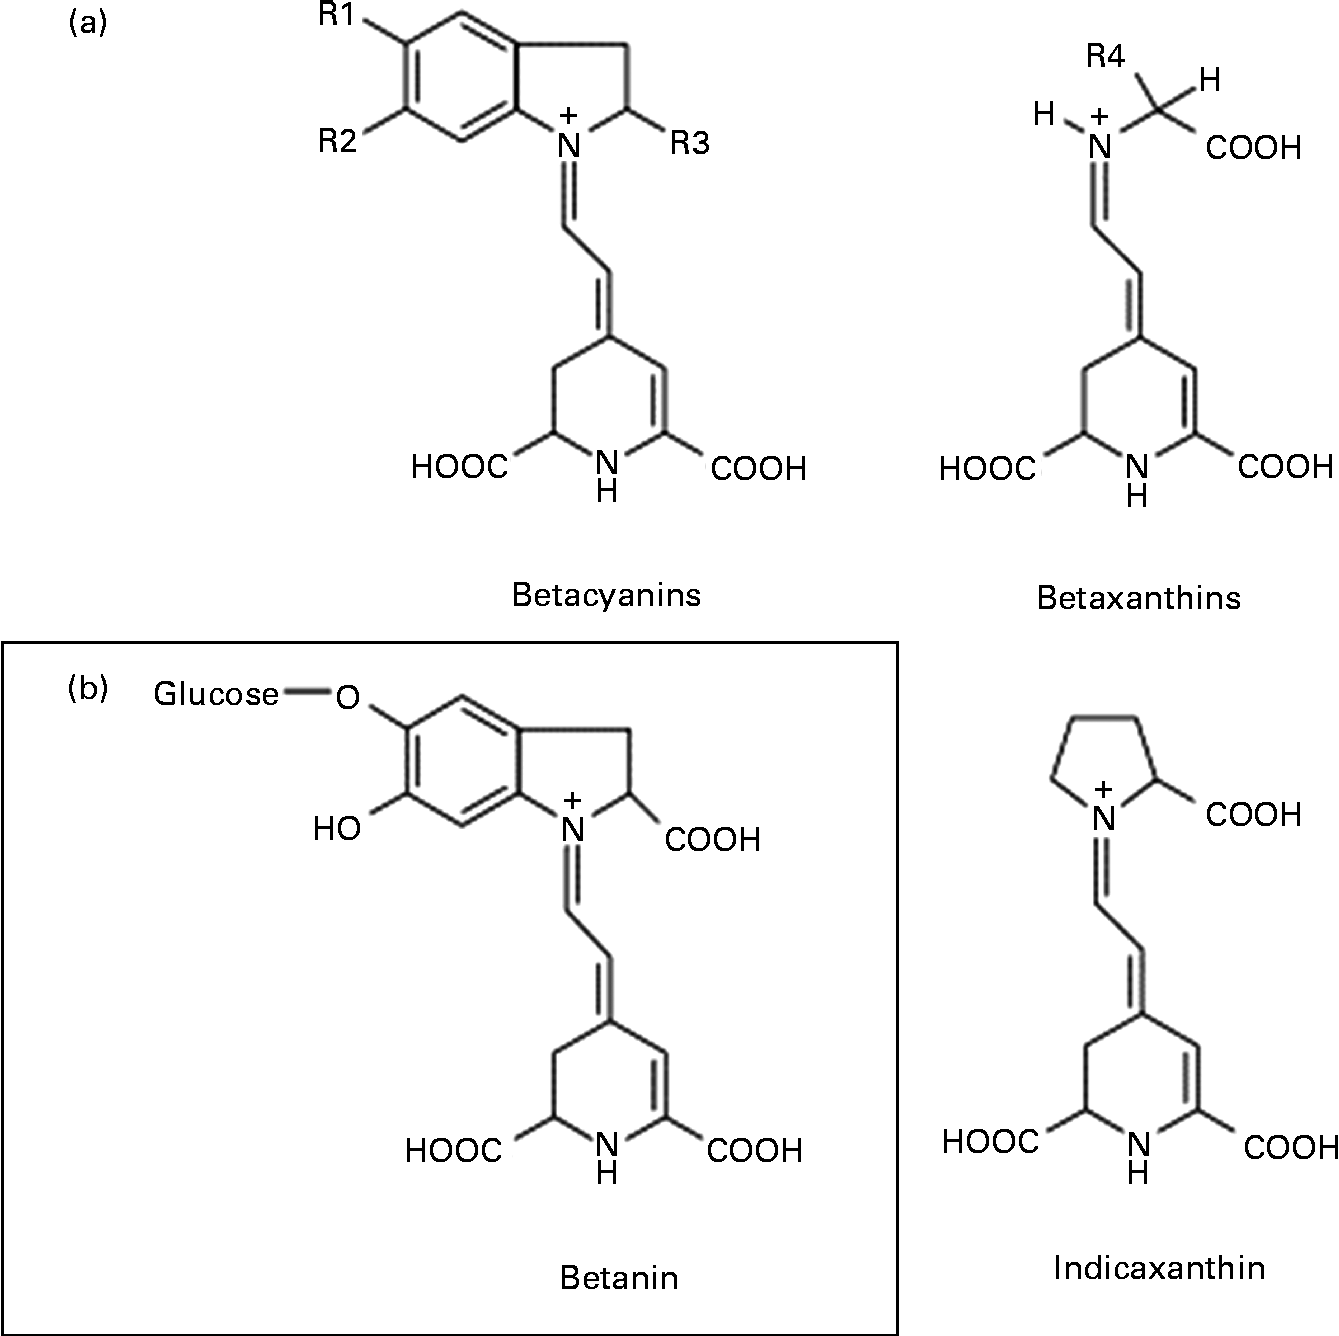
Among the various mechanisms that may be involved in the anticancer activity of beetroot at the cellular level, antioxidant, free radical-scavenging, anti-proliferative, anti-inflammatory, pro-apoptotic and crucial enzyme inhibitory effects have been considered(Reference Kapadia, Rao and Bhagyalakshmi1). Beetroot is one of the vegetables with the highest antioxidant potential, owing to the presence of red pigments (betacyanins) and yellow pigments (betaxanthins), known collectively as betalains (Fig. 1)(Reference Moreno, Garcia-Viguera and Gil2, Reference Allegra, Furtmüller and Jantschko6). Of the betacyanins present, 75–95 % is betanin (BET), considered to be the principal pigment and active phytochemical of beetroot(Reference Gliszczyńska-Świgło, Szymusiak and Malinowska7). Thus, it can be assumed that BET may be mainly responsible for the beneficial effects of beetroot extract or juice.

Fig. 1 General chemical structure of betalains: betacyanins and betaxanthins, and their major representatives – betanin (betanidin-5-O-β-glycoside) and indicaxanthin, respectively.
The key role in the regulation of the cellular defence systems against oxidative and electrophilic stress by inducing enzymes that are involved in the detoxification and elimination of reactive oxygen species (ROS), reactive nitrogen species and electrophiles through their conjugation and excretion is played by the nuclear factor erythroid-2-related factor 2 (Nrf2)–antioxidant response element (ARE) pathway. Many chemopreventive agents, e.g. isothiocyanates and curcumin, can activate this pathway(Reference Keum, Owuor and Kim8, Reference Balogun, Hogue and Gong9). It is well established that the activity of Nrf2 is controlled in part by the cytosolic protein Kelch-like ECH-associated protein 1 (Keap1). Under basal levels, newly synthesised Nrf2 is constitutively bound to Keap1, forming a dimer. Oxidants such as ROS, reactive nitrogen species and chemopreventive compounds react with redox-reactive cysteines in Keap1, disrupting the interaction between Nrf2 and Keap1 and hence allowing the translocation of Nrf2 into the nucleus. In the nucleus, Nrf2 forms dimers with the musculoaponeurotic fibrosarcoma (MAF) family of proteins, which bind to ARE sequences, which are the critical regulatory elements present in the promoter sequences of many genes encoding cellular phase II detoxification and antioxidant/cytoprotective enzymes including NQO1, GST and haem oxygenase-1 (HO-1), which results in their increased transcription(Reference Saw and Kong10).
Many cellular signalling pathways can coordinately regulate Nrf2 signalling, including a wide array of kinase signalling pathways such as the mitogen-activated protein kinase pathway(Reference Shen, Jeong and Hu11). It appears that these kinase signalling pathways are also activated by chemopreventive compounds, which in turn would enhance the transcriptional activity of Nrf2. There is also a possible crosstalk between the Nrf2 pathway and p53 function. It has recently been shown that NQO1, one of the Nrf2 target enzymes, besides catalysing the detoxification reactions, particularly the reduction of quinones, may stabilise p53 protein by blocking its proteasomal degradation. Thus, the stabilisation of p53 by NQO1 could serve as another cellular defensive mechanism against the detrimental effects of carcinogens(Reference Asher, Lotem and Cohen12).
The expression of genes encoding phase II enzymes as well as other genes responsible for inflammatory/stress response(Reference Kim, Cha and Suhr13) may also be affected by epigenetic mechanisms(Reference Esteller14). In this regard, the aberrant down-regulation of the expression of GSTP is often found in cancer cells, including hepatoma cells, as a result of the methylation of its promoter region(Reference Zhong, Tang and Yeo15). Our recent investigations have shown that BET may moderately inhibit the activity of DNA methyltransferases (DNMT); however, its modulatory effects on the level of methylation of gene promoters have not been evaluated extensively(Reference Paluszczak, Krajka-Kuźniak and Baer-Dubowska16).
Thus, several mechanisms might be involved in the hepatoprotective and anticarcinogenic activities of beetroot or BET. The aim of the present study was to further explore some of these mechanisms by evaluating the influence of BET on the activation of Nrf2 and the expression of GSTA, GSTP, GSTM, GSTT, NQO1 and HO-1 in two cells lines: non-tumour human hepatocytes THLE-2 and hepatocellular carcinoma cells HepG2. Moreover, we also evaluated the level of the tumour suppressor p53 in both cell lines and the methylation of GSTP in HepG2 cells.
Materials and methods
Chemicals and antibodies
BET, decitabine, antibiotic solutions (104U (6·3 mg) penicillin, 10 mg streptomycin and 25 μg amphotericin B), dimethyl sulfoxide (DMSO), fetal bovine serum (FBS), Dulbecco's modified Eagle's medium, epidermal growth factor, radioimmunoprecipitation assay buffer, Tris, glutathione, 1-chloro-2,4-dinitrobenzene, 2,6-dichlorophenolindophenol, dicoumarol, NADPH and phosphoethanolamine were obtained from Sigma-Aldrich. HepG2 (ATCC HB 8065) cells were provided by Professor Zofia Mazerska from the Department of Pharmaceutical Technology and Biochemistry, Gdańsk University of Technology, Poland. The THLE-2 cell line (ATCC-CRL-2706) was purchased from the American Type Culture Collection (ATCC). BET was dissolved in DMSO (100 mm stock solution) and stored at − 20°C. β-Naphtoflavone was dissolved in DMSO and used as a positive control of the induction of expression of phase II enzymes. Decitabine was dissolved in PBS buffer and stored as a 1 mm solution. TrueStart Hot Start Taq DNA Polymerase obtained from Fermentas was used in a methylation-specific PCR (MSP). All primers used in the PCR were obtained from oligo.pl. Protease inhibitor cocktail was obtained from Roche Diagnostics GmbH. Primary and secondary antibodies against GSTA, GSTM, GSTP, GSTT, NQO1, HO-1, p53, Nrf2, Keap1, extracellular signal-regulated kinase (ERK), p-ERK, c-Jun N-terminal kinase (JNK), p-JNK, serine/threonine kinase (AKT), p-AKT and β-actin were supplied by Santa Cruz Biotechnology. Rainbow-coloured protein molecular weight marker was purchased from Amersham Pharmacia Biotechnology. All the other chemicals were commercial products of the highest purity available.
Cell culture and treatment
THLE-2 cells were cultured in the bronchial epithelial growth medium (BEGM) supplemented with the Bullet Kit (ATCC) and additionally in 10 % FBS, 5 ng/ml epidermal growth factor and 70 ng/ml phosphoethanolamine, while HepG2 cells were maintained in Dulbecco's modified Eagle's medium containing 10 % FBS and antibiotics. The cells were grown in a humidified incubator at 37°C in an atmosphere of 5 % CO2. To assess the effect of BET on the measured parameters, 5 × 10⁵ cells were seeded per 100 mm culture dish. After 24 h of initial incubation, the cells were treated with 2, 10 and 20 μm of BET in 0·1 % DMSO or with 0·1 % DMSO alone (control) and incubated for 72 h.
Viability assay
The effect of BET on cell viability was assessed with the MTT assay, according to standard protocols. Briefly, 104 HepG2 or THLE-2 cells were seeded per well in a ninety-six-well plate. After 24 h of preincubation in Dulbecco's modified Eagle's medium containing 5 % FBS or BEGM supplemented with the Bullet Kit (ATCC) and additionally in 10 % FBS, 5 ng/ml epidermal growth factor and 70 ng/ml phosphoethanolamine, BET was added to the culture medium in various concentrations and the cells were incubated for subsequent 72 h. The concentration of DMSO did not exceed 0·1 %. After 72 h, the cells were washed twice with PBS buffer and fresh medium containing the MTT salt (0·5 mg/ml) was added. After 4 h of incubation, formazan crystals were dissolved in acidic isopropanol and absorbance was measured at 540 and 690 nm. All the experiments were repeated three times, with at least three measurements per experiment.
In all the subsequent experiments, non-toxic concentrations of BET (viability above 80 % based on the MTT assay) were used, ranging from 2 to 20 μm.
Preparation of cell lysates
After treatment with BET, the cells were collected by centrifugation at 600 g for 5 min at 4°C and lysed in 0·5 ml radioimmunoprecipitation assay buffer supplemented with proteinase inhibitors and incubated on ice for 60 min. Cell lysates were centrifuged at 16 000 g for 15 min at 4°C. The supernatants were collected, assayed for protein concentration using the Lowry method, aliquoted and stored at − 70 °C until used for Western blot analysis.
Preparation of nuclear and cytosolic extracts
Nuclear and cytosolic extracts were prepared using the Nuclear/Cytosol Fractionation Kit (BioVision Research) according to the manufacturer's instructions. Briefly, HepG2 and THLE-2 cells were collected by centrifugation at 600 g for 5 min at 4°C. Pellets were resuspended in an ice-cold cytosol extraction buffer containing dithiothreitol (DTT) and protease inhibitors. After incubation in an ice bath for 10 min, the samples were centrifuged at 16 000 g for 5 min 4°C to collect the cytosolic fractions. The supernatants (cytosolic fractions) were transferred into clean tubes. The pellets were resuspended in an ice-cold nuclear extraction buffer containing DTT and protease inhibitors and incubated on ice for 40 min with vortex mixing for 15 s every 10 min The lysed suspension of nuclei was then centrifuged at 16 000 g at 4°C for 10 min, and the collected nuclear extract was stored at − 70°C. The protein concentration of the cytosolic and nuclear fractions was determined by the Lowry method(Reference Lowry, Rosenbrough and Farr17).
DNA and RNA isolation
Extraction of DNA and total RNA from the cells was done using the GeneMatrix Universal DNA/RNA/Protein Purification Kit (EurX) according to the manufacturer's instructions.
Quantitative PCR
Total RNA (1 μg) was subjected to reverse transcription in the presence of random hexamer primers using the RevertAid Kit (Fermentas) followed by quantitative real-time PCR. For real-time analyses, the Maxima SYBR Green Kit (Fermentas) and a BioRad Chromo4 thermal cycler (Bio-Rad Laboratories) were used. The protocol was started with 5 min of enzyme activation at 95°C, followed by forty cycles of 95°C for 15 s, 54°C for 20 s and 72°C for 40 s and final elongation at 72°C for 5 min. Melting curve analysis was used for the verification of the lack of non-specific products. The estimation of the expression of TATA box-binding protein (TBP) and porphobilinogen deaminase (PBGD) was done for the normalisation of data. The Pfaffl(Reference Pfaffl18) relative method was used for fold-change quantification using the following equation:
Primer sequences are listed in Table 1.
Table 1 The sequence of primers used in real-time PCR

GST, glutathione S-transferase; HO-1, haem oxygenase-1; KEAP1, Kelch-like ECH-associated protein 1; NRF2, nuclear factor erythroid-2-related factor 2; NQO1, NAD(P)H:quinone oxidoreductase 1; PBGD, porphobilinogen deaminase; TBP, TATA box-binding protein.
Nuclear factor erythroid-2-related factor 2 binding assay
The activation of Nrf2 was assessed by an enzymatic immunoassay using the Nrf2 Transcription Factor ELISA Assay Kit (Active Motif) according to the manufacturer's instructions. Nuclear extracts were incubated in the oligonucleotide-coated wells where the oligonucleotide sequence contains the ARE consensus-binding site (5′-GTCACAGTGACTCAGCAGAATCTG-3′). After washing, the samples were incubated with the antibody against Nrf2. Subsequent addition of a horseradish peroxidase (HRP)-conjugated secondary antibody provided a sensitive colorimetric readout at 450 nm. Nuclear extracts from COS-7 cells transfected with Nrf2 were included as the positive control.
Western blot analysis
For the determination of the levels of GSTA, GSTP, GSTM, GSTT, NQO1, HO-1, p53, Nrf2 and Keap1 proteins, an immunoblot assay was used. All the experiments were repeated three times. Whole lysates containing 100 μg of protein were used for the determination of HO-1, p53, AKT, JNK and ERK, nuclear extracts containing 100 μg of protein for the detection of Nrf2 or cytosolic extracts containing 50–100 μg of protein for GSTA, GSTP, GSTM, GSTT, Keap1, Nrf2 or NQO1 were separated on 12–10 % SDS–PAGE slab gels, and the proteins were transferred onto nitrocellulose membranes(Reference Laemmli19, Reference Towbin, Staehelin and Gordon20). After blocking with 10 % skimmed milk, the proteins were probed with rabbit anti-human GSTA, goat anti-rat GSTM, rabbit anti-human GSTP, human anti-mouse GSTT, goat anti-human NQO1, goat anti-mouse HO-1, mouse anti-human p53, goat anti-rat Keap1, rabbit anti-mouse Nrf2, rabbit anti-human β-actin, mouse monoclonal anti-ERK, goat polyclonal anti-p-ERK, goat polyclonal anti-JNK, goat polyclonal anti-p-JNK, goat polyclonal anti-AKT and rabbit polyclonal anti-p-AKT antibodies. The β-actin protein was used as an internal control. As the secondary antibodies in the staining reaction, the alkaline phosphatase-labelled anti-goat IgG, anti-mouse IgG or anti-rabbit IgG antibodies were used. Bands were visualised using the BioRad AP Conjugate Substrate Kit NBT/BCIP (Bio-Rad Laboratories). The amount of the immunoreactive product in each lane was determined using the Quantity One software (BioRad Laboratories). Values were calculated as relative absorbance units (RQ) per mg protein and expressed as fold of the control.
NAD(P)H:quinone oxidoreductase 1 and glutathione S-transferase activity assays
The activity of NQO1 in cytosolic fractions containing 0·2 mg protein was assessed as described by Ernster(Reference Ernster21) and modified by Benson et al. (Reference Benson, Barretto and Stanley22) with NADPH as the electron donor and 2,6-dichlorophenolindophenol as the electron acceptor. The activity of GST in cytosolic fractions containing 0·1 mg protein was measured by the method of Habig et al. (Reference Habig, Pabs and Jacoby23), using 1-chloro-2,4-dinitrobenzene as the substrate.
DNA methylation analysis
The methylation status of GSTP1 was evaluated using a MSP(Reference Hermann, Graff and Myohanen24). The EZ DNA Methylation Kit obtained from ZymoResearch was used for the bisulphite conversion of DNA samples (1 μg). Primers and reaction conditions for the MSP were chosen based on previously published data(Reference King-Batoon, Leszczynska and Klein25). DNA isolated from lymphocytes of healthy blood donors was used as the negative control and a completely methylated human DNA obtained from New England Biolabs as the positive control in the MSP. Amplification products were resolved on 2·5 % agarose gels and visualised in UV after ethidium bromide staining.
Statistical analysis
The statistical analysis was performed using one-way ANOVA. The statistical significance between the experimental groups and their respective controls was assessed by Tukey's post hoc test, with P< 0·05.
Results
Effect of betanin on cell viability
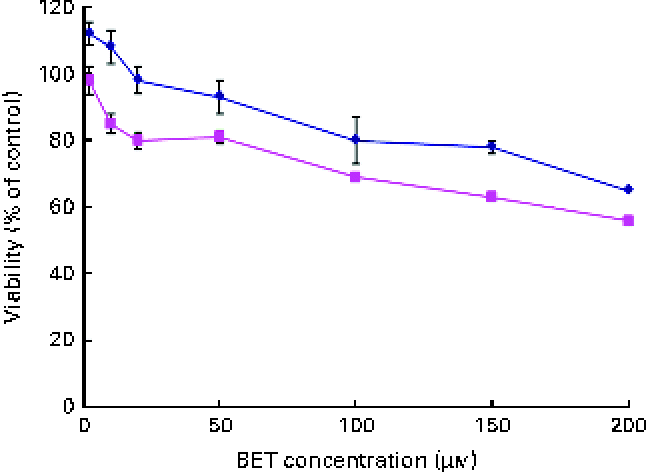
The effect of BET on the viability of the HepG2 and THLE-2 cells was evaluated using the MTT assay. A dose-dependent decrease in the growth of the HepG2 and THLE-2 cells after BET treatment (Fig. 2) was observed, with a 50 % decrease in cell proliferation in the HepG2 cells when using 200 μm of BET. The non-tumour THLE-2 hepatocytes were less prone to the cytotoxic effects induced by BET than the HepG2 hepatoma cells. Based on these findings, all the subsequent studies were conducted at concentrations of BET ranging from 2 to 20 μm.

Fig. 2 Effect of betanin (BET) on the viability of hepatic cell lines. Cell viability was expressed as the percentage of optical density of the BET-treated cells in comparison with that of the untreated controls (100 % viability). Values are means of three independent experiments, with their standard errors represented by vertical bars. ![]() , THLE-2;
, THLE-2; ![]() , HepG2. (A colour version of this figure can be found online at http://www.journals.cambridge.org/bjn).
, HepG2. (A colour version of this figure can be found online at http://www.journals.cambridge.org/bjn).
Effect of betanin on the expression and activation of nuclear factor erythroid-2-related factor 2
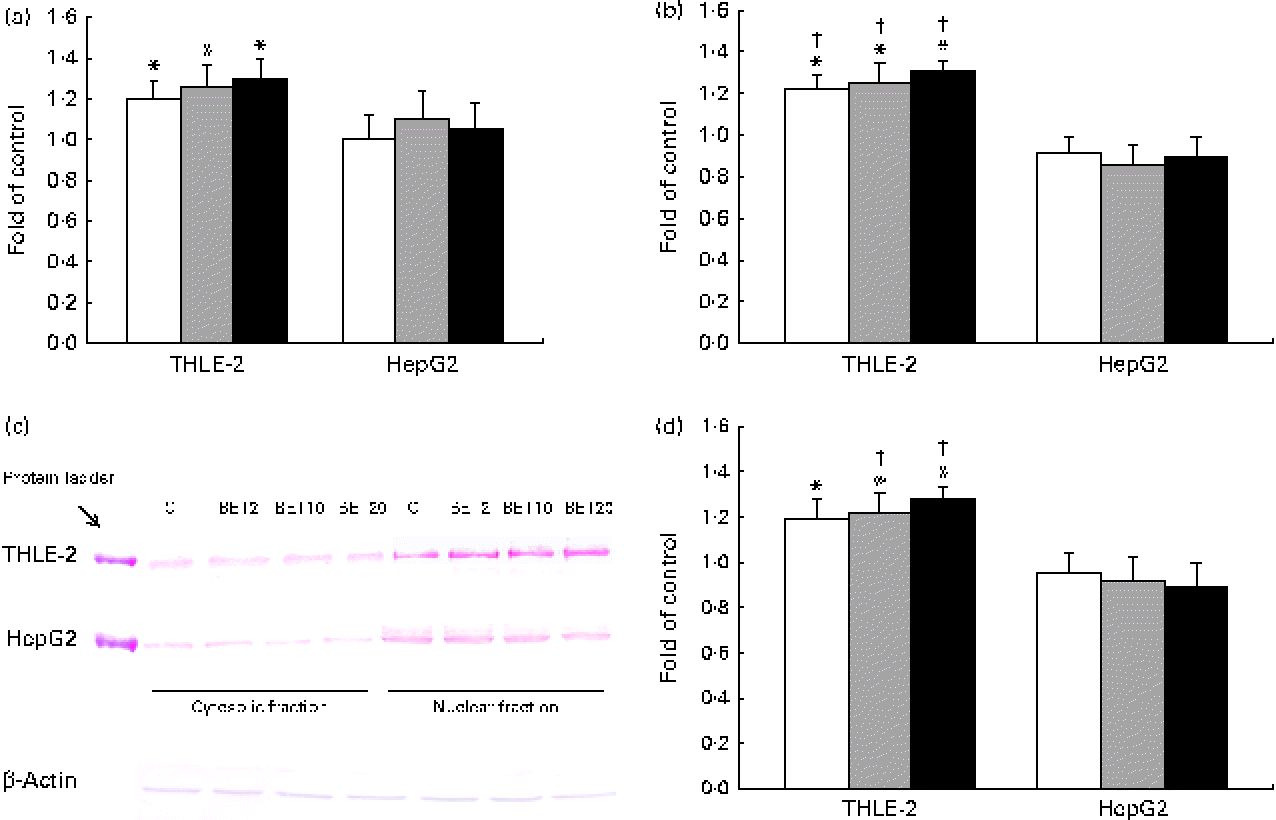
Quantitative analysis revealed a significant increase in the amount of Nrf2 transcripts in the THLE-2 cells as a result of BET treatment at the doses of 2, 10 and 20 μm (Fig. 3(a)). BET led to a 21–30 % increase in the Nrf2 mRNA level (Fig. 3(a)) and to a lesser extent to an increase in its protein level in the THLE-2 cells (Fig. 3(c) and (d)). Nrf2 may induce gene expression only after its translocation into the nucleus. To investigate the translocation of Nrf2 upon BET treatment, the levels of Nrf2 in the cytosolic and nuclear fractions of the HepG2 and THLE-2 cells were evaluated by Western blot analysis. As shown in Fig. 3(c) and (d), the protein level of Nrf2 in the nucleus was significantly increased after exposure to all the doses of BET when compared with that in the untreated cells. In contrast to that observed in the non-tumour THLE-2 cells, the extent of translocation of Nrf2 into the nucleus was not statistically significant in the HepG2 cells. However, statistically significant differences between the effects of BET on the nuclear protein levels of Nrf2 in these two cell lines were found only for the 10 and 20 μm doses of this compound (P< 0·05).

Fig. 3 Effect of betanin (BET) on the activation of nuclear factor erythroid-2-related factor 2 (Nrf2) in HepG2 and THLE-2 cells. (a) Nrf2 transcript levels. (b) Binding of Nrf2 to the antioxidant response element-containing oligonucleotides. (c) Representative immunoblots for the analysis of the levels of Nrf2 protein in the cytosolic and nuclear fractions. (d) Results of Western blot analysis of the content of Nrf2 protein in the nuclear fractions. The values were calculated as protein level in comparison with that of the control cells (expression equals 1). Values are means from three separate experiments, with their standard errors represented by vertical bars. * Mean values were significantly different from those of the control group (P< 0·05). † Mean values were significantly different for the effects of BET between the non-tumour and tumour cells (P< 0·05). The expression of β-actin was used as a normalisation control in the Western blot analysis. C, vehicle control. □, BET 2 μm; ![]() , BET 10 μm; ■, BET 20 μm. (A colour version of this figure can be found online at http://www.journals.cambridge.org/bjn).
, BET 10 μm; ■, BET 20 μm. (A colour version of this figure can be found online at http://www.journals.cambridge.org/bjn).
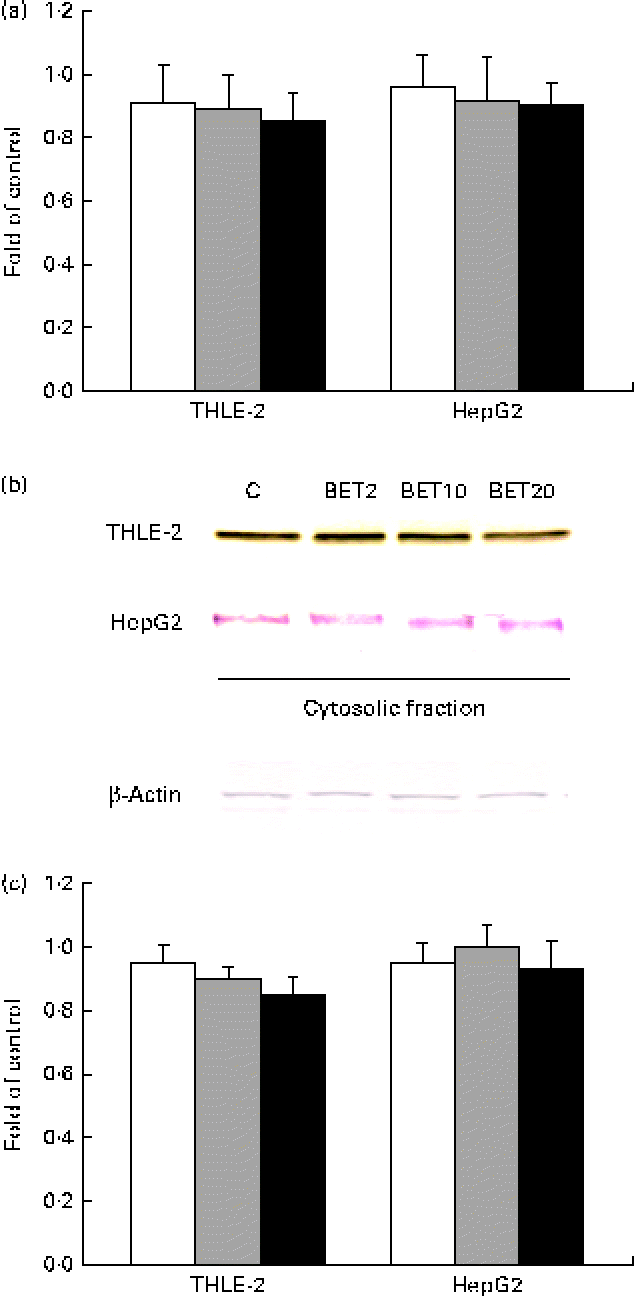
Since the activation of Nrf2 is generally accompanied by the degradation of Keap1, the amounts of Keap1 mRNA and cytosolic protein were also measured. The amount of Keap1 mRNA was slightly decreased by BET in the tested cell lines (Fig. 4); however, the changes were not statistically significant.

Fig. 4 Effect of betanin (BET) on the expression of Kelch-like ECH-associated protein 1 (Keap1) in HepG2 and THLE-2 cells. (a) Keap1 transcript levels. (b) Representative immunoblots for the analysis of the protein level of Keap1 in the cytosolic fractions. (c) Results of Western blot analysis of the protein content of Keap1 in the cytosolic fractions. Values are means from three separate experiments, with their standard errors represented by vertical bars. The expression of β-actin was used as a normalisation control in the Western blot analysis. C, vehicle control. □, BET 2 μm; ![]() , BET 10 μm; ■, BET 20 μm. (A colour version of this figure can be found online at http://www.journals.cambridge.org/bjn).
, BET 10 μm; ■, BET 20 μm. (A colour version of this figure can be found online at http://www.journals.cambridge.org/bjn).
The activation of Nrf2 was assessed by the measurement of its binding to a known ARE oligonucleotide sequence. The results show that BET increased the binding of Nrf2 to ARE in the THLE-2 cells (Fig. 3(b)), whereas no significant increase was observed in the HepG2 cells.
Statistically significant differences in Nrf2 binding in these two cell lines as a result of BET treatment were observed for all the doses (P< 0·05).
Effect of betanin on the expression of nuclear factor erythroid-2-related factor 2 target genes
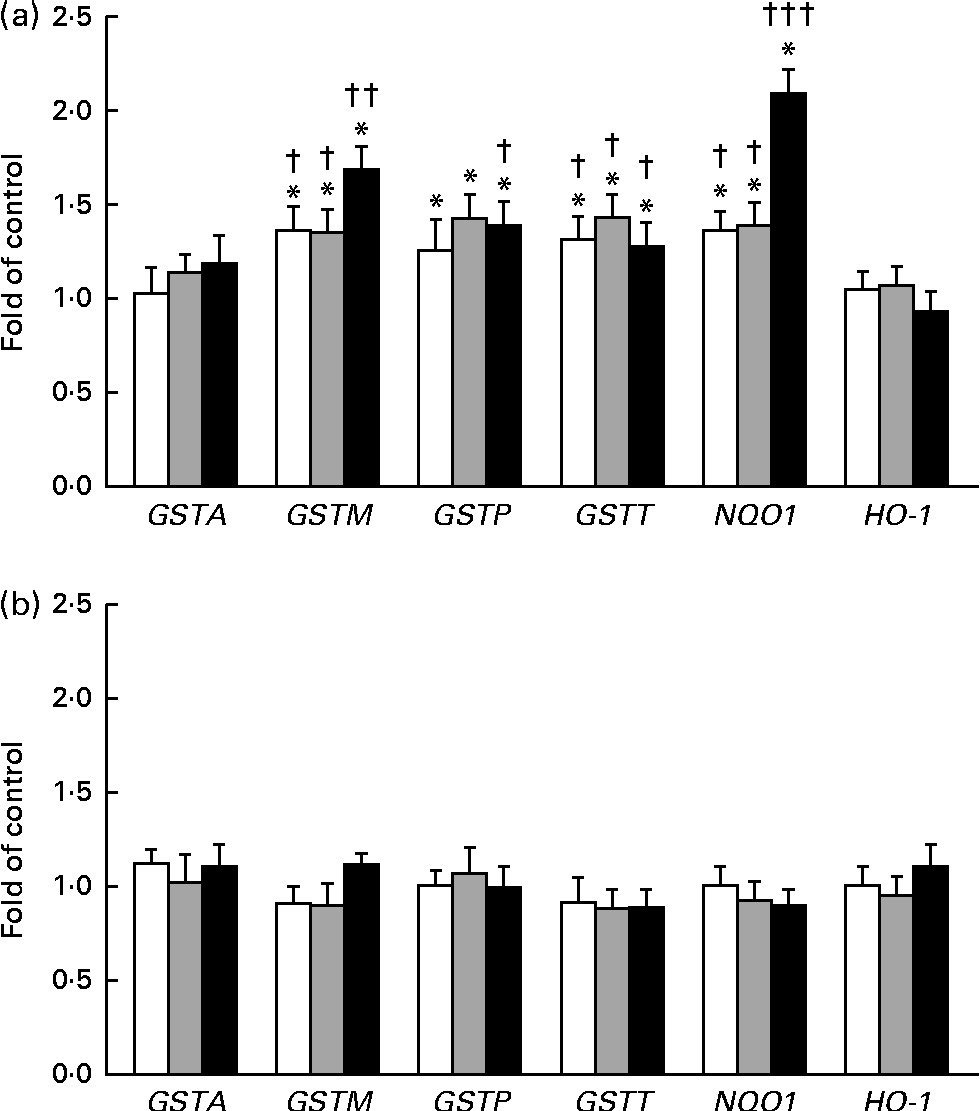
The expression of GSTA, GSTP, GSTM, GSTT, NQO1 and HO-1 was measured by quantitative PCR (Fig. 5(a) and (b)). In this reaction, β-naphtoflavone was used as a reference inducer (positive control). This compound induced the expression of all the tested enzymes at a level comparable to that reported by other authors (0·38–16 fold in comparison with that observed in the untreated control) in both cell lines(Reference Gerets, Tilmant and Gerin26). The expression of GSTP, GSTM and GSTT mRNA increased after the treatment of the THLE-2 cells with all the tested doses of BET. The levels of NQO1 mRNA also increased in a dose-dependent manner after the treatment of the THLE-2 cells with 2, 10 and 20 μm of BET. In contrast to those observed in the THLE-2 cells, the levels of GST, NQO1 and HO-1 mRNA in the HepG2 cells were not affected after treatment with any of the doses of BET. Significant differences in the induction of GSTM, GSTT and NQO1 expression between the THLE-2 and HepG2 cells were found for all the doses of BET, while in the case of GSTP, such a difference was noted only for the dose of 20 μm (P< 0·05–P< 0·001).

Fig. 5 Effect of betanin (BET) on the expression of nuclear factor erythroid-2-related factor 2 target genes at the mRNA level in THLE-2 and HepG2 cells. (a) Expression of glutathione S-transferase A (GSTA), GSTP, GSTM, GSTT, NAD(P)H:quinone oxidoreductase 1 (NQO1) and haem oxygenase-1 (HO-1) mRNA in THLE-2 cells; (b) expression of GSTA, GSTP, GSTM, GSTT, NQO1 and HO-1 mRNA in HepG2 cells. Values are means from three separate experiments, with their standard errors represented by vertical bars. * Mean values were significantly different from those of the control group (P< 0·05). Mean values were significantly different for the effects of BET between the non-tumour and tumour cells: † P< 0·05, †† P< 0·01 and ††† P< 0·001. □, BET 2 μm; ![]() , BET 10 μm; ■, BET 20 μm.
, BET 10 μm; ■, BET 20 μm.
Effect of betanin on the protein levels of glutathione S-transferase, NAD(P)H:quinone oxidoreductase 1 and haem oxygenase-1
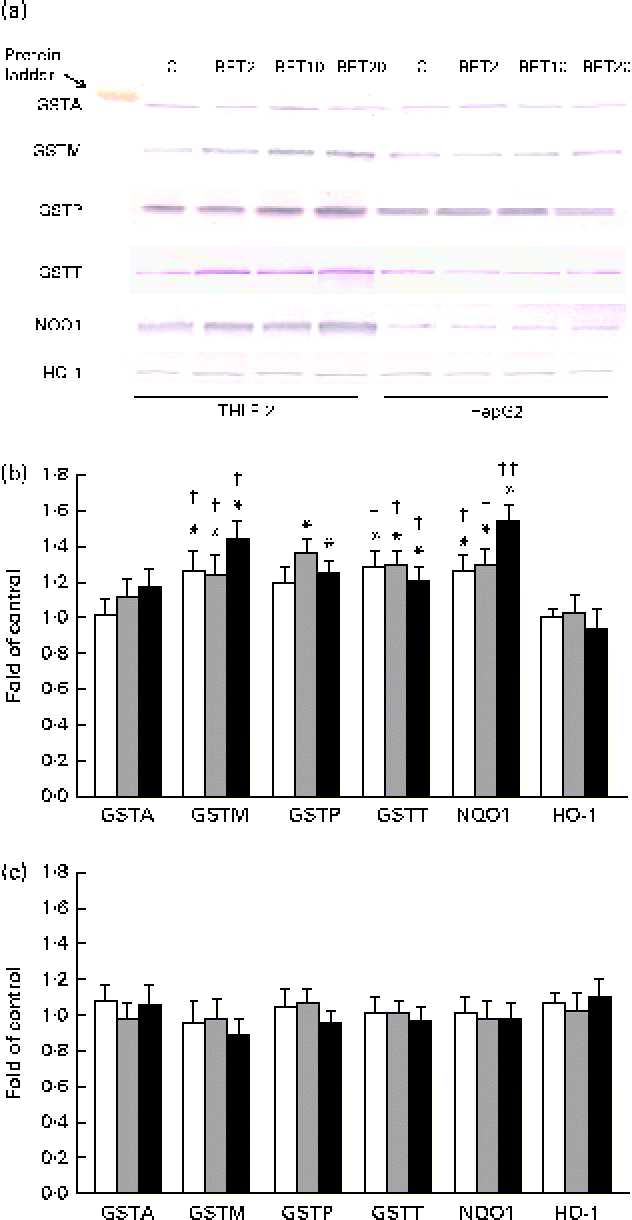
The levels of GSTA, GSTP, GSTM, GSTT, NQO1 and HO-1 proteins in the HepG2 cells in comparison with those in the THLE-2 cells were investigated using Western blot analysis with specific antibodies against the enzymes (Fig. 6). The levels of GSTP, GSTM and GSTT in the cytosolic fractions of the THLE-2 cells (Fig. 6(b)) increased about 20–45 % after BET treatment, whereas they were not affected in the HepG2 cells (Fig. 6(c)). The levels of NQO1 were also increased by 27–55 % in the THLE-2 cells (Fig. 6(b)), but not in the HepG2 cells as a result of BET treatment (Fig. 6(c)). No significant effect was observed in the case of HO-1 in either of the cell lines. Although the levels of induction of GSTP, GSTM, GSTT and NQO1 expression were higher in the non-tumour THLE-2 cells than in the HepG2 cells after BET treatment, statistically significant (P< 0·05–P< 0·01) differences in changes in protein levels between these cell lines were found only in the case of GSTM, GSTT and NQO1.

Fig. 6 Effect of betanin (BET) on the expression of nuclear factor erythroid-2-related factor 2 target genes at the protein level in THLE-2 and HepG2 cells. (a) Representative immunoblots for the analysis of glutathione S-transferase A (GSTA), GSTP, GSTM, GSTT, NAD(P)H:quinone oxidoreductase 1 (NQO1) and haem oxygenase-1 (HO-1) levels in THLE-2 and HepG2 cells. (b) Results of Western blot analysis of the contents of GSTA, GSTP, GSTM, GSTT, NQO1 and HO-1 proteins in THLE-2 cells. (c) Results of Western blot analysis of the cellular contents of GSTA, GSTP, GSTM, GSTT, NQO1 and HO-1 proteins in HepG2 cells. Values are means from three separate experiments, with their standard errors represented by vertical bars. * Mean values were significantly different from those of the control group (P< 0·05). Mean values were significantly different for the effects of BET between the non-tumour and tumour cells: † P< 0·05 and †† P< 0·01. C, vehicle control. □, BET 2 μm; ![]() , BET 10 μm; ■, BET 20 μm. (A colour version of this figure can be found online at http://www.journals.cambridge.org/bjn).
, BET 10 μm; ■, BET 20 μm. (A colour version of this figure can be found online at http://www.journals.cambridge.org/bjn).
Effect of betanin on the activities of glutathione S-transferase and NAD(P)H:quinone oxidoreductase 1
The effects of BET on the activities of GST and NQO1 are presented in Table 2. The treatment of cells with all the doses of BET increased the activities of GST and NQO1 by 18–32 and 22–44 %, respectively; however, this effect was observed only in the THLE-2 cells. The activity of these enzymes was not affected in the HepG2 cells. The constitutive activity of these enzymes in the hepatoma HepG2 cells was also significantly lower than that in the non-tumour THLE-2 cells. Statistical analysis indicated significant differences in changes in the activity of GST between the non-tumour THLE-2 and tumour cells after treatment with 10 and 20 μm of BET. A similar effect was also observed for the activity of NQO1 when the changes in enzyme activity induced by BET were compared between the non-tumour and tumour cells (P< 0·05).
Table 2 Enzymatic activities of glutathione S-transferases (GST) and NAD(P)H:quinone oxidoreductase 1 (NQO1) in the THLE-2 and HepG2 cells treated with 2, 10 and 20 μm of betanin (BET) or dimethyl sulfoxide (vehicle control)‡ (Mean values with their standard errors)

* Mean values were significantly different from those of the control group (P< 0·05).
† There were significantly different changes in the effect of 2, 10 and 20 μm of BET on GST and NQO1 activities between the non-tumour THLE-2 and tumour HepG2 cells. Changes in enzyme activities induced by each dose of BET were compared between the THLE-2 and HepG2 cells. Additionally, the base levels of enzyme activities were compared (comparison between the control groups). P values were calculated using Tukey's test.
‡ The THLE-2 and HepG2 cells were incubated with varying concentrations of BET (2, 10 and 20 μm) for 72 h and harvested for the determination of enzymatic activity. The details are described in the Materials and methods section.
§ Values represent the percentage of control group values from three separate experiments run in triplicate.
∥ 1-Chloro-2,4-dinitrobenzene conjugate formed/min per mg.
¶ 2,6-Dichlorophenolindophenol reduced/min per mg.
Effect of betanin on the phosphorylation of serine/threonine kinase, c-Jun N-terminal kinase and extracellular signal-regulated kinase
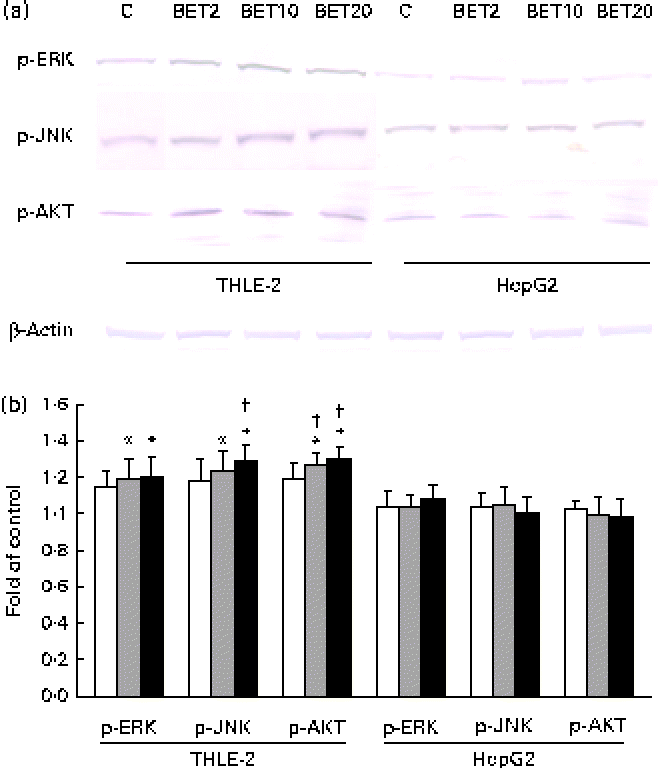
To elucidate the signalling events that lead to the activation of Nrf2, BET-induced phosphorylation of representative signal-transducing kinases was examined using Western blot analysis. The phosphorylation of AKT, JNK and ERK was increased about 20–36 % after BET treatment (Fig. 7(a) and (b)), but only in the non-tumour hepatic cells. In contrast to that observed in the THLE-2 cells, we did not observe significantly increased phosphorylation of the investigated kinases in the HepG2 cells. However, statistically significant differences between these two cell lines as a result of BET treatment were found only in the levels of phosphorylation of JNK and AKT (P< 0·05).

Fig. 7 Effect of betanin (BET) on the phosphorylation (p) of upstream kinases in THLE-2 and HepG2 cells. (a) Representative immunoblots for the analysis of extracellular signal-regulated kinase (ERK), c-Jun N-terminal kinase (JNK) and serine/threonine kinase (AKT) in THLE-2 and HepG2 cells. (b) Results of Western blot analysis of the cellular content of p-ERK, p-JNK and p-AKT proteins in THLE-2 cells. Values are means from three separate experiments, with their standard errors represented by vertical bars. * Mean values were significantly different from those of the control group (P< 0·05). † Mean values were significantly different for the effects of BET between the non-tumour and tumour cells (P< 0·05). The expression of β-actin was used as a normalisation control in the Western blot analysis. C, vehicle control. □, BET 2 μm; ![]() , BET 10 μm; ■, BET 20 μm. (A colour version of this figure can be found online at http://www.journals.cambridge.org/bjn).
, BET 10 μm; ■, BET 20 μm. (A colour version of this figure can be found online at http://www.journals.cambridge.org/bjn).
Modulation of P53 expression
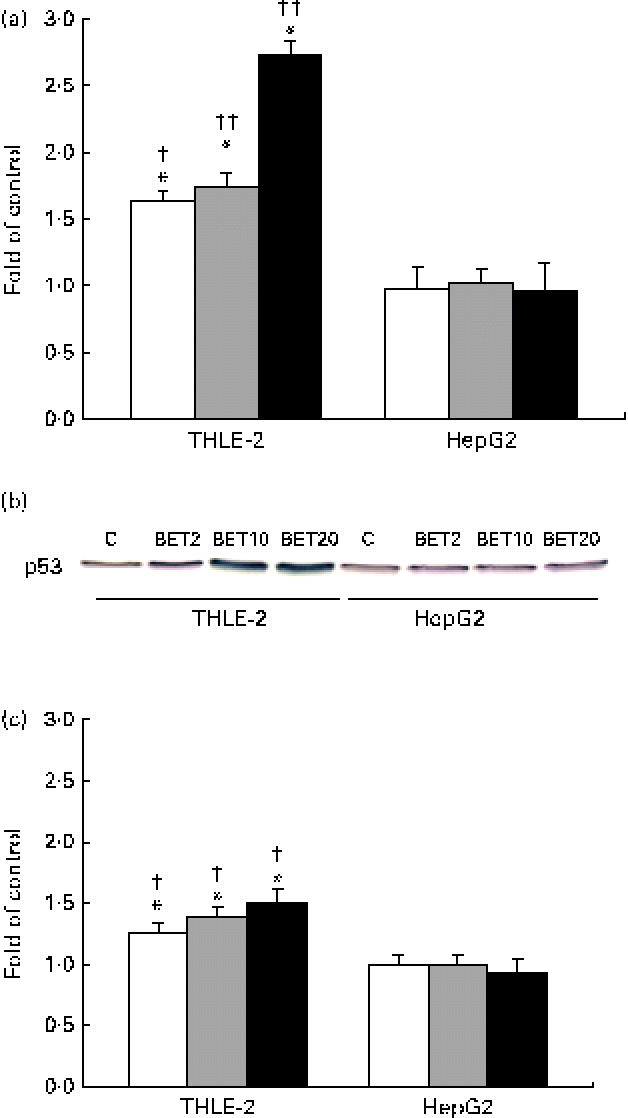
In order to explore the possible effect of BET on the crosstalk between the activation of Nrf2–NQO1 and the stabilisation of the tumour suppressor p53 protein, we examined the mRNA and protein levels of p53. BET at all the tested doses increased both the mRNA and protein levels of p53 (Fig. 8(a)–(c)), but only in the THLE-2 cells. The increase was dose dependent. The levels of both the transcript and p53 protein were significantly lower in the HepG2 cells than in the non-tumour THLE-2 cells after treatment with 2, 10 and 20 μm of BET (P< 0·05–P< 0·01).

Fig. 8 Effect of betanin (BET) on the level of p53 in HepG2 and THLE-2 cells. (a) mRNA expression of p53. (b) Representative immunoblots for p53 content analysis. (c) Level of p53 protein. Values are means from three separate experiments, with their standard errors represented by vertical bars. * Mean values were significantly different from those of the control group ( P< 0·05). Mean values were significantly different for the effects of BET between the non-tumour and tumour cells: † P< 0·05 and †† P< 0·01. C, vehicle control. □, BET 2 μm; ![]() , BET 10 μm; ■, BET 20 μm. (A colour version of this figure can be found online at http://www.journals.cambridge.org/bjn).
, BET 10 μm; ■, BET 20 μm. (A colour version of this figure can be found online at http://www.journals.cambridge.org/bjn).
Effect of betanin on the methylation of glutathione S-transferase P1
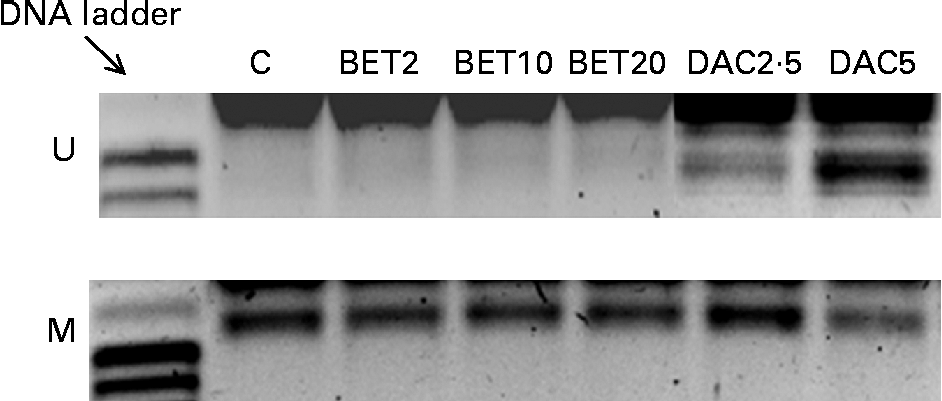
For the evaluation of the ability of BET to reactivate GSTP1, which is epigenetically silenced by promoter methylation in the HepG2 cells, the MSP technique was used. Decitabine (2·5 and 5·0 μm) was used as the reference demethylating compound. BET was not able to epigenetically reactivate GSTP1 (Fig. 9), which is consistent with its very low expression in the HepG2 cells.

Fig. 9 Effect of betanin on the methylation of glutathione S-transferase P1 (GSTP1) in HepG2 cells. Representative examples of electropherograms showing the results of methylation-specific polymerase chain reactions with primers specific for the methylated (M) or unmethylated (U) sequence. C, vehicle control; DAC, decitabine.
Discussion
Although, over the centuries, red beetroot extract has been utilised in the prevention and treatment of a variety of human diseases, only in the past few years, the potential health benefits of the extract have gained the attention of researchers as well as general public. This is largely due to recent findings that betalain pigments present in red beetroot extract act as natural antioxidants, exhibiting powerful free radical-scavenging properties with a potential for the prevention and cure of diseases associated with oxidative stress, including cancer(Reference Kapadia, Rao and Bhagyalakshmi1, Reference Gliszczyńska-Świgło, Szymusiak and Malinowska7, Reference Azeredo27, Reference Kanner, Harel and Granit28). In this regard, a broad spectrum of anti-tumour activity was demonstrated in laboratory animals receiving red beetroot extract in drinking-water(Reference Kapadia, Azuine and Sridhar4, Reference Kapadia, Tokuda and Konoshima29, Reference Lechner, Wang and Rocha30). The studies in a mouse model have shown a delay in the NDEA-induced tumour onset induced by both a short interval and a prolonged treatment with the beetroot extract(Reference Kapadia, Azuine and Sridhar4). This delay in tumour onset could involve the protection against DNA damage caused by NDEA-derived electrophiles or ROS as a result of the induction of expression of phase II enzymes observed in several studies including ours(Reference Kapadia, Azuine and Sridhar4, Reference Krajka-Kuźniak, Szaefer and Ignatowicz5, Reference Kapadia, Tokuda and Konoshima29).
These enzymes are responsible for the detoxification and elimination of xenobiotics and reactive metabolites that may cause damage and injury to cells and tissues(Reference Yang, Noh and Han31). The key role in the induction of expression of phase II detoxifying enzymes as well as other cytoprotective proteins is played by the Nrf2–ARE pathway; however, the effect of red beetroot components on this pathway has never been studied. Thus, the aim of the present study was to evaluate the effect of BET, the principal betalain pigment of beetroot, on this pathway in two hepatic cell lines: immortalised human liver epithelial THLE-2 cells and human hepatocellular carcinoma-derived HepG2 cells.
Based on the results of the initial viability test, BET concentrations within the range of 2–20 μm were selected for further experiments.
BET in a dose-dependent manner increased the expression of Nrf2 (mRNA transcript level) and led to its activation by the enhancement of its translocation from the cytosol to the nucleus and binding to ARE sequences. Moreover, the present study also showed that ERK, JNK and AKT signalling pathways may be involved in the BET-mediated induction of Nrf2 expression. Thus, the results of the present study provide further evidence that chemopreventive compounds may enhance the transcriptional activity of Nrf2 through mechanisms other than a direct effect on Keap1. Such a mechanism was also shown for procyanidin B2 and quercetin(Reference Rodriguez-Ramiro, Ramos and Bravo32, Reference Granado-Serrano, Martin and Bravo33). Interestingly, the activation of Nrf2 was found only in human liver epithelial (non-tumour) cells THLE-2. These immortalised cells are characterised by an overall higher metabolic activity in comparison with HepG2 cells. The latter are, for example, less sensitive towards carcinogens such as benzo[a]pyrene and dimethylnitrosamine(Reference Wilkening, Stahl and Bader34). Moreover, THLE-2 cells retained the phase II enzymes, but had markedly reduced phase I activities(Reference Soltanpour, Hilgendorf and Ahlström35). Thus, it is possible that HepG2 cells might also be insensitive to BET due to a lower metabolic activity. On the other hand, although THLE-2 cells have normal hepatic epithelial cell morphology, they are characterised by features that make them a good model of liver tumour promotion, while HepG2 cells derived from hepatocellular carcinomas represent the later stages of hepatocarcinogenesis. Promotion is characterised by the clonal expansion of initiated cells and is the most desired target of chemoprevention strategy(Reference Baer-Dubowska, Ignatowicz, Baer-Dubowska, Bartoszek and Malejka-Giganti36). Thus, the data obtained in the present study may confirm the chemopreventive capacity of BET and beetroot extract/juice in liver cancer early prophylaxis. Additionally, this is further supported by the evidence of a crosstalk between Nrf2 and inflammatory responses mediated by, for example, NF-κB(Reference Anand, Kunnumakkara and Sundaram37). In this regard, it has been found that the anti-inflammatory effects of chemopreventive phytochemicals such as isothiocyanate – sulforaphane are mediated by Nrf2(Reference Lin, Wu and Wu38, Reference Liu, Dinkova-Kostova and Talalay39). Since chronic hepatitis predisposes and is an early event in the development of hepatocellular carcinoma, it is possible that BET and beetroot extract/juice may also affect this inflammatory response(Reference Thorgeirsson and Grisham40). Further studies are required in order to explain if such an interplay really exists.
The activation of Nrf2 by BET resulted in increased GSTP, GSTT, GSTM and NQO1 mRNA and protein levels and GST and NQO1 activities in the THLE-2 cells. This observation confirms our hypothesis that BET might be the main constituent responsible for the induction of expression of these enzymes by beetroot juice in rat liver demonstrated in our earlier studies(Reference Krajka-Kuźniak, Szaefer and Ignatowicz5). The GST isozymes mentioned above play an important role in the detoxification of several classes of electrophiles, particularly of those resulting from the activation of carcinogens as well as ROS and products of lipid peroxidation(Reference Hartley, Ruth and Petersen41–Reference Landi43). Thus, the interaction of BET with these GST isozymes may provide protection against insults induced by several types of reactive species and prevent the induction or development of cancer. Moreover, NQO1 by catalysing the two-electron reduction of quinones to hydroquinones leads to their excretion from a biological system and bypasses one-electron reduction that can generate ROS(Reference Winski, Hargreaves and Butler44).
A more recent study has shown that NQO1 is involved in the stabilisation of the tumour suppressor p53 protein(Reference Gong, Kole and Iskander45). The expression of P53 gene is induced in response to DNA damage, allowing its repair by extending the G1 phase of cell cycle or mediating apoptosis(Reference Vazguez, Bond and Levine46). In the present study, BET significantly increased the mRNA and protein levels of p53 in the THLE-2 cells. Thus, it is possible that the increased levels of p53 protein might result from NQO1-mediated inhibition of its proteasomal degradation. However, this requires further elucidation. Overall, the rise in p53 levels may significantly promote cellular homoeostasis and may be an important component of the protective potential of BET.
The prevention or reversal of hypermethylation-induced inactivation of key tumour suppressor genes by the inhibition of DNMT is considered as an effective approach for the prevention of cancer(Reference Link, Balaguer and Goel47). Recent studies on the expression of GSTP have demonstrated that gene promoter methylation may be involved in its regulation. In our previous investigations, using a cell-free assay, we found that BET reduced the activity of DNMT present in the nuclear extract of MCF7 breast cancer cells (used as the source of the enzyme in the assay) by 20 % at a concentration of 20 μm(Reference Paluszczak, Krajka-Kuźniak and Baer-Dubowska16). In order to verify this inhibitory activity in intact cells, we assessed the effect of BET on the methylation of GSTP1, which shows aberrant hypermethylation in HepG2 hepatoma cells. The treatment of cells with BET did not affect the methylation of GSTP1 promoter region in contrast to a known demethylating agent – decitabine. These results can be explained in several ways. The estimation of the inhibitory activity of DNMT was done using nuclear extracts as the source of enzymes and BET may not be able to affect the catalytic activity of DNMT in proliferating cells. This indicates that in this cell-free model the possible effect of BET on the activity of DNMT would occur through an indirect mechanism, e.g. the increase in S-adenosylhomocysteine (SAH) due to catechol-O-methyltransferase-mediated methylation as indicated for chlorogenic and caffeic acids(Reference Paluszczak, Krajka-Kuźniak and Baer-Dubowska16). This would not operate in HepG2 cells since the accumulation of SAH is unlikely due to efficient SAH cycling. On the other hand, the effect of BET may be gene specific, leaving the hypermethylation of GSTP1 unaffected. Recently, it has been shown for lycopene that its demethylating activity is gene- and cell line-dependent(Reference King-Batoon, Leszczynska and Klein25). Thus, BET may act in a similar way.
In summary, the results of the present study show for the first time that BET may induce the expression of phase II detoxifying enzymes through the activation of Nrf2 as a result of the stimulation of mitogen-activated protein kinases in human non-tumour liver cells. These findings confirm the hypothesis that BET is, at least in part, responsible for the hepatoprotective activity of beetroot observed in our earlier in vivo study. Moreover, our data provide insight into the mechanism of the induction of detoxifying/antioxidant enzyme expression by BET and suggest that this mechanism may play an important role in the prevention of liver injury (hepatoprotection) and the chemoprevention of liver cancer.
Acknowledgements
The present study was supported by the Ministry of Science and Higher Education of Poland, grant no. N N405 425439. The authors' responsibilities are as follows: V. K.-K. was involved in the conception, planning and designing of the study as well as in conducting the experiments, the acquisition of data and their interpretation, and drafting of the manuscript; J. P. was involved in the RT-PCR and DNA methylation analysis and the writing of the manuscript; H. S. performed the cell cultures; W. B.-D. was involved in the conception and designing of the study, data interpretation and the writing of the manuscript. All authors read and approved the final version. The authors declare no conflicts of interest.


