Introduction
Insoluble atmospheric dust represents an important fraction of the total mass of atmospheric aerosols (Reference PyePye, 1987), and provides one of the most important proxies for paleoclimatic reconstruction. Dust can play an important role in climate, for example by influencing the Earth–atmosphere radiative budget (Reference Sokolik and ToonSokolik and Toon, 1996). Continental microparticles also play an important role in the biogeochemical cycles of several elements, through their potential in ocean fertilization and chemical equilibrium (Reference De BaarDe Baar and others, 1995; Reference KumarKumar and others, 1995). In this context, several recent works (e.g. Reference BoydBoyd, 2002; Reference Morel and PriceMorel and Price, 2003; Reference TsudaTsuda and others, 2003) discuss the roles of typical crustal elements (e.g. iron) in biogeochemical mechanisms of control and feedback on oceanic primary production, and in the related control of the carbon budget in the atmosphere.
The changes in atmospheric dust load during the Quaternary can be related to higher atmospheric storminess, to the reduced hydrological cycle and to the extension of arid areas (e.g. Reference SvenssonSvennson, 1998). Dust records from Antarctic ice cores show higher dust concentrations during cold stages and lower concentration during warm stages. The record of atmospheric dust changes during the last four glacial/interglacial cycles (420 kyr) provided by the Vostok (East Antarctica; 78˚30'S, 106˚54'E) ice core has proven to be clearly anticorrelated to the temperature record, deduced from the stable-isotope δD record (Reference PetitPetit and others, 1999). In the same ice core, the dust concentration values during cold stages 6 and 2 (this latter culminated in the Last Glacial Maximum (LGM)) were respectively ∼20 and ∼50 times higher than during interglacial stage 5e and the Holocene.
Dust archived in Antarctic ice consists mainly of small mineral grains that originate from continental regions (source areas), are taken up by winds, carried up into the atmosphere, transported over very long distances into the mid- and high troposphere, and deposited on the high East Antarctic plateau (Reference PyePye, 1987; Reference Gaudichet, De Angelis, Joussaume, Petit, Korotkevich and PetrovGaudichet and others, 1992; Reference Basile, Grousset, Revel, Petit, Biscaye and BarkovBasile and others, 1997). Volcanic ash and tephra layers are also observed in ice cores, and consist of glass shards or single mineral crystals injected into the high troposphere or stratosphere during eruptions, and transported by winds (Reference Palais, Petit, Lorius and KorotkevichPalais and others, 1989).
Strontium and neodymium isotopes of continental microparticles, used as tracers for identification of dust provenance to the East Antarctic plateau (Reference GroussetGrousset and others, 1992; Reference Basile, Grousset, Revel, Petit, Biscaye and BarkovBasile and others, 1997; Reference Delmonte, Petit and MaggiDelmonte and others, 2002), indicate the southern South American regions as the dominant source area during the cold glacial stages of the Pleistocene. The environmental conditions over the continental surfaces, however, underwent continuous changes in response to the varying precipitation regime, hydrological cycle, atmospheric temperature, wind strength and isostatic changes that are reflected by the typology and the extent of vegetation cover as well as by pedogenic processes (e.g. Reference Tegen, Lacis and FungTegen and others, 1996). Such processes can induce some modifications in mineral assemblages (e.g. differential alteration of rocks and neoformed clays and other minerals) and hence in the concentrations of crustal elements (Reference ArimotoArimoto, 2001; Reference Harrison, Kohfeld, Roelandt and ClaquinHarrison and others, 2001; Reference Kohfeld and HarrisonKohfeld and Harrison, 2001). To date, however, this aspect has been neglected, because only limited information is available on the elemental composition of the insoluble fraction of dust.
Here we present the first record of particle-induced X-ray emission (PIXE) measurements on the insoluble dust from the first 2200m of the EPICA (European Project for Ice Coring in Antarctica) Dome C (75˚06' 04" S, 123˚20' 53" E; Fig. 1) ice core, spanning the last 220 kyr according to the expanded EDC1 time-scale (Reference Schwander, Jouzel, Hammer, Petit, Udisti and WolffSchwander and others, 2001; personal communication from J. Schwander, 2003). We present the record of three crustal elements, Si, Fe and Ti, and compare the records with the total dust content obtained by Coulter©Counter measurements.
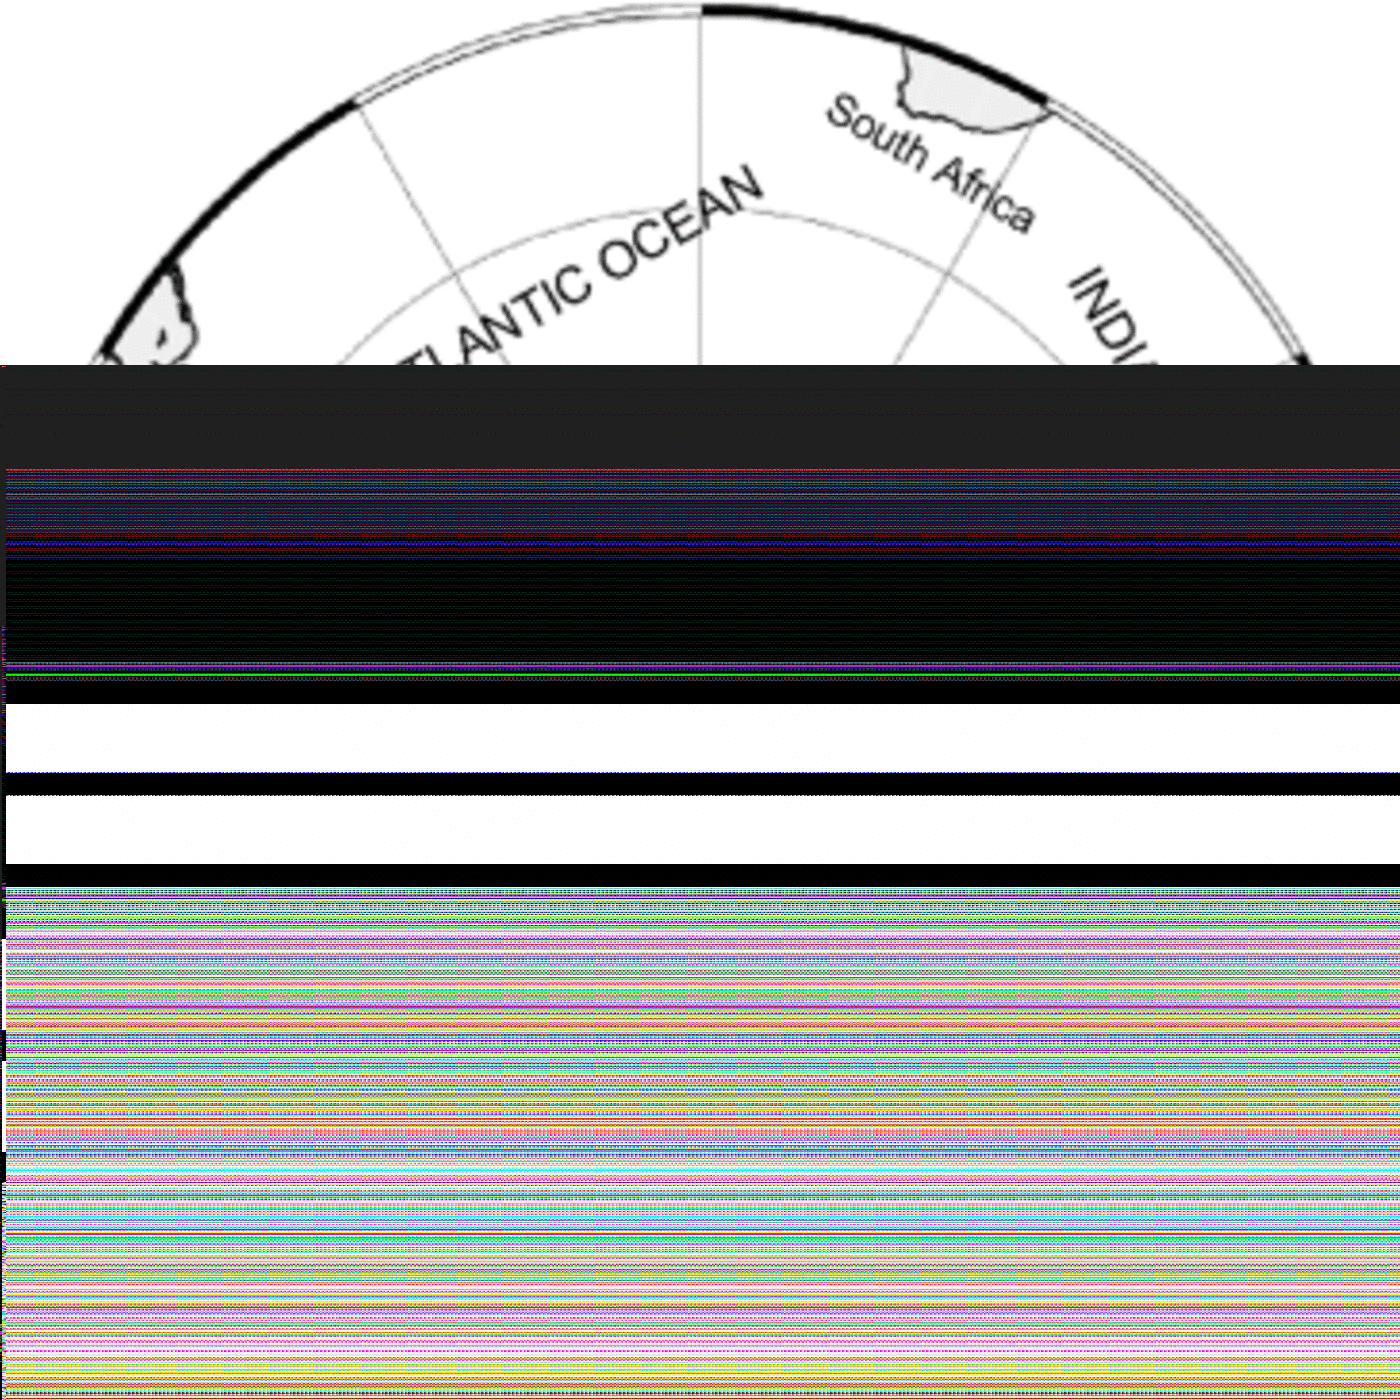
Fig. 1. Map of Antarctica and surrounding continents with location of EPICA Dome C (DC) and Vostok ice cores (VK).
The PIXE measurements on EPICA samples follow a previous study on the Greenland Ice Core Project (GRIP) ice core (Reference LajLaj and others, 1997), in which the authors discuss the soluble/insoluble partition of some elements, and continue the preliminary results obtained by Reference Ghermandi, Cecchi, Capotosto and MarinoGhermandi and others (2003) on the first 581 m of the EDC ice core.
Two kinds of problem may arise when the elemental content of insoluble dust is measured: one is the difficulty of separating the soluble and insoluble fractions without introducing spurious signals (e.g. from the filter); the other concerns the small quantity of insoluble particles that can be collected (a few ng of each analyte) using a reasonable amount of ice.
Despite these limitations, the first Si, Fe and Ti measurements performed on the EDC ice core and presented in this work suggest several important environmental implications of the data.
In particular, (i) the insoluble dust elemental concentrations indicate that source areas may provide mineral assemblages related to climatic variability; (ii) atmospheric dust has the potential to provide substantial amounts of available elements to the Southern Ocean, and may influence oceanic primary productivity (Reference KumarKumar and others, 1995; Reference Falkowski, Barber and SmetacekFalkowski and others, 1998; Reference Latimer and FilippelliLatimer and Filippelli, 2001; Reference Hoppema, Fahrbach, Hellmer and KleinHoppema and others, 2003); and (iii) determination of the elemental content of atmospheric dust may permit us to evaluate the elemental load of the atmosphere, and to gain further knowledge of the relations between the soluble and insoluble components of those materials (Reference LajLaj and others, 1997).
Materials and Methods
A total of about 200 ice samples from EPICA Dome C ice core was analyzed from 100 to 2200m depth; the time period covered by the ice-core section investigated spans from 2 to about 220 kyr BP (Reference Schwander, Jouzel, Hammer, Petit, Udisti and WolffSchwander and others, 2001; personal communication from J. Schwander, 2003). The frequency of sampling is about one sample per 230 years for the Holocene, 300 years for the LGM, 860 years for stage 3, 1500 years for stages 4 and 5, and 4000 years for glacial stage 6. Samples represent 2–3 years of accumulation in interglacials and 4–5 years in glacials. They were selected and decontaminated in the cold room at the Laboratoire de Glaciologie et de Géophysique de l’Environnement du CNRS, Grenoble, France, by removing the outer part of the core and by three repeated washings in ultrapure (Milli-Q) water of the inner sample. After melting in pre-cleaned beakers, an aliquot of ∼10 mL was kept for Coulter©Counter measurements, while the remaining part was frozen and sealed in plastic bags and transferred to the Department of Mechanics and Civil Engineering, University of Modena and Reggio Emilia, Modena, Italy.
The analytical procedures for Coulter©Counter measurements are described in Reference Delmonte, Petit and MaggiDelmonte and others (2002). In this paper, we focus on the PIXE technique which has proven to be useful for the study of trace element distribution in environment and ecosystems. It has the advantage of multi-element analysis, high sensitivity and high speed of analysis (20 min) for a wide variety of samples (Reference Ghermandi and MyersGhermandi, 2000). The physical basis of PIXE is the primary ionization of the inner shells of a target atom by an incoming particle beam whose energy ranges from hundreds of KeV to a few MeV, with the subsequent emission of an X-ray photon, an Auger electron or both (radiative Auger effect). PIXE takes into account only the X-ray photons. The production of characteristic X-rays from each element studied allows a multi-elemental analysis in a single run (Reference Johansson, Campbell and MalmqvistJohansson and others, 1995).
Depending on particle energy and mass, and on sample preparation, detection limits are normally <1 ppb. However, it must be stressed that adequate sample preparation procedures and suitable measurement conditions are required in order to make full use of PIXE capabilities.
Because solid targets must be exposed to the particle beam, thin targets of sample material are preferable, to minimize matrix effects; in this way the proton beam energy loss and X-ray attenuation can be considered negligible. The definition of a thin target depends on incident proton energies and the nature and thickness of the exposed sample matrix; with a 2–4MeV energy proton beam and carbon or polymer backings, a thin target is on the order of <1 mg cm–2 of sample material (backing excluded) (Reference Johansson, Campbell and MalmqvistJohansson and others, 1995). The concentrations of trace elements in polar snow and ice are very low, ranging from ppm (mg kg–1) to fractions of ppt (ng kg–1); therefore the specimen surface density resulting from the total amount of material (dissolved fraction and insoluble particles) present in ice and firn samples is typically 0.3 mg cm–2, backing excluded (Reference Ghermandi and MyersGhermandi, 2000), which constitutes a thin target. These very low concentrations require that extreme care be taken in sample treatment and target preparation to avoid contamination (Reference Ghermandi, Cecchi and LajGhermandi and others, 1996). The possibility of preparing sample targets without pre-treatment, such as preconcentration or precipitation with the addition of chemical agents, is an important feature of PIXE, contributing to reduction of contamination.
All operations were performed inside a class 100 clean plastic bench running continuously and located inside a clean laboratory at the Department of Mechanics and Civil Engineering, University of Modena and Reggio Emilia. PIXE targets were prepared by filtering each melted sample (a volume of about 20 mL for samples in the upper 580m and 3–8mL for deeper samples) through a Nuclepore membrane (polycarbonate 1 mg cm–2, pore size 0.45 μm, 25 mm diameter), using pre-cleaned glass filter holders. Nuclepore polycarbonate membranes provide good size selectivity. They generally may contain traces of Cr, Fe, and sometimes Br, in variable amounts. This contamination is negligible in comparison with the Cr and Fe concentration in sample material (i.e. Cr, Fe and Br concentration from Nuclepore membrane is close to the PIXE detection limit); the possible release of these elements (mainly Cr) from the membranes into the solute filtrate has been evaluated by filtration of deionized water samples (blanks). The diameter of the filtration area was about 1 cm; only the central part of the Nuclepore filter is exposed to the filtration by the funnel-shaped filtering system especially built to provide a filtration area (0.78 cm2) smaller than the filter surface (4.9 cm2). That prevents possible contamination during filter handling. Moreover, possible target inhomogeneity was integrated by performing PIXE measurements with a uniformly diffused beam, collimated to produce a beam spot larger than the filtration area on the target. The filters were left to dry at room temperature. All apparatus in contact with samples was previously cleaned by three successive immersions in 0.1% HNO3 solutions, obtained by dilution of ultrapure HNO3, followed by a final immersion in deionized water.
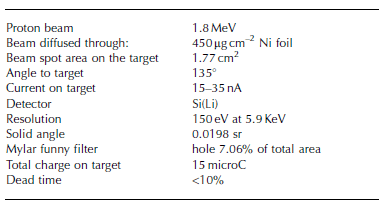
The PIXE analyses were carried out at the 2 MeV AN 2000 Van de Graaff accelerator of the National Laboratories of Legnaro (Istituto Nazionale di Fisica Nucleare, Padua, Italy) with working conditions shown in Table 1. A more detailed description of the PIXE experimental set-up is presented elsewhere (Reference Cecchi, Ghermandi and CalvelliCecchi and others, 1987; Reference Ghermandi and MyersGhermandi, 2000). The PIXE experimental chamber was calibrated by analyzing a series of polycarbonate foils coated with known concentrations of several elements; before each PIXE run, some reference samples (polycarbonate foils coated with known Cu concentrations: 5, 10, 20 and 30 ng cm–2) were analyzed. Given that the features of the targets from EPICA ice samples fit well with the definition of thin targets, the calibration performed with polycarbonate foils coated with elements is reliable; in fact, such foils are commonly used as reference materials for aerosol particle analyses (Reference Cahill and ZieglerCahill, 1975). Inter-comparison between PIXE and atomic absorption spectroscopy measurement values for samples from the GRIP ice core (Reference Laj, Ghermandi, Cecchi and CeccataLaj and others, 1996) gave satisfactory results.
Table 1. PIXE experimental set-up and working conditions used in this work
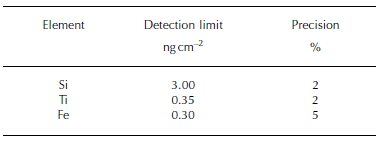
Blanks were prepared in order to quantify any spurious additions to the samples during target preparation operations. The average blank concentrations calculated from the analysis of some Nuclepore polycarbonate filters are subtracted from each sample (Fig. 2). The background of the blank spectrum is quite smooth and agrees well with the minima between the peaks in the sample PIXE spectrum. In particular, the elemental lines due to impurities in the Nuclepore polycarbonate filter have rather low intensity, i.e. they usually amount to no more than a few per cent of the signals of the same element in the aerosol samples. This reflects the low impurity level in the filters. The very high peaks on the right part of the spectrum (Fig. 2) are internal signals produced by a pulse generator applied to the experimental set-up for the dead-time determination. The pulse generator clearly produces the same signal in the three different spectra (sample, blank and filter). Blank values obtained in this work are similar to those measured by Laj and others (1997) and are also similar to those measured by inductively coupled plasma mass spectrometry (ICP-MS) in Nuclepore polycarbonate filters (Reference Berg, Royset and SteinnesBerg and others, 1991). Comparison between PIXE and other analytical techniques (e.g. Ion Chromatography (Reference SellegriSellegri and others, 2003) and inductively coupled plasma atomic emission spectroscopy (Reference Menzel, Schramel and WittmaackMenzel and others, 2002)) has shown that the different methods usually agree to within 15% or better. Quantitative analysis was achieved by following the thin target model approach of Reference Johansson, Campbell and MalmqvistJohansson and others (1995) and Reference Ghermandi and MyersGhermandi (2000). X-ray counts were directly registered using a multichannel analyzer, and PIXE spectra were fitted using commercial software, GUPIX98 (Gupix Software; Reference Maxwell, Campbell and TeesdaleMaxwell and others, 1989, Reference Maxwell, Teesdale and Campbell1995), that applies non-linear least-squares fitting procedure and a chi-square test to evaluate whether the fitted spectrum differs significantly from the experimental data. The experimental data were fitted with a spectrum model that contains only the X-ray peaks (whose shapes are Gaussian with low energy tails and steps), pile-up and escape peaks. The code uses a digital filter to remove the background signal. The GUPIX98 code also estimates errors (typically <15%) for each detected X-ray emission peak, as the sum of a statistical error (depending on the number of counts in the peak, as it is followed by the Poisson distribution) plus a fit error (depending on the peak-fitting procedure), and detection limits that range from 0.1 to 10 ng cm–2. Element concentration uncertainties were of the order of 5–10% of the concentration, depending on the element (Table 2). The GUPIX98 output provides the surface densities (ng cm–2) for each element present in the deconvoluted PIXE spectrum; these results were converted into concentrations (ng cm–3) in the melted ice, taking into account both beam spot size and filtered volume of sample.
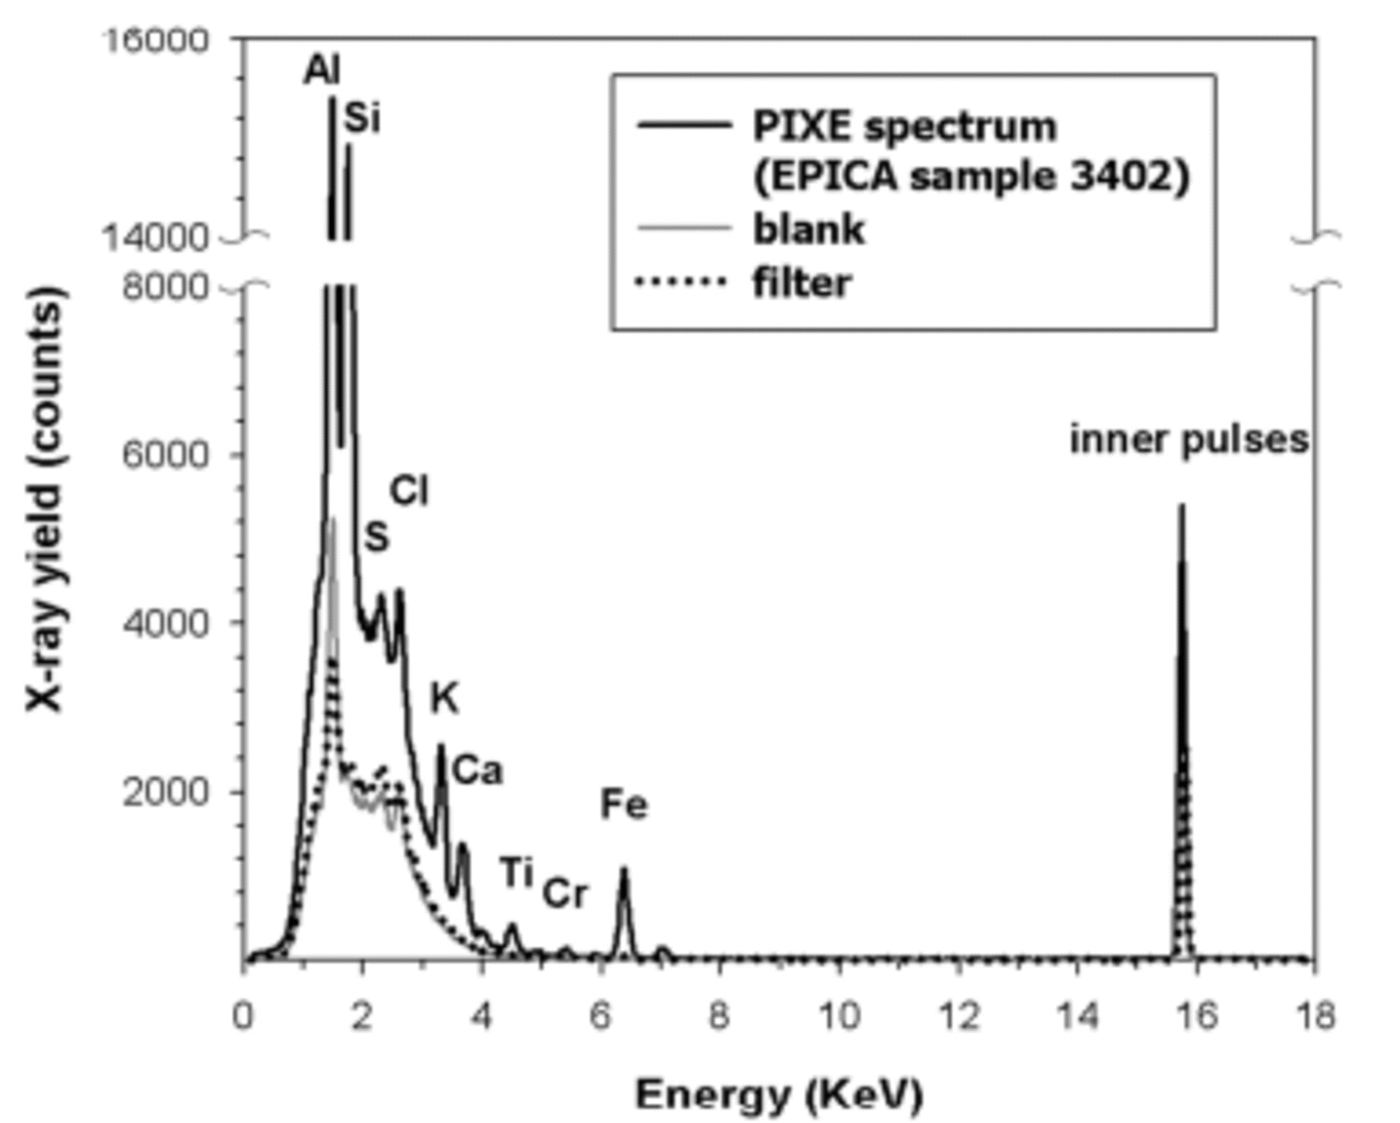
Fig. 2. Overlap between the PIXE spectrum of the EPICA sample (bag 3402; 1871.10 m depth), Nuclepore filter and blank (deionized water sample).
Table 2. Detection limits and analytical uncertainties in PIXE analyses
As mentioned above, PIXE allows multi-elemental determination of a wide group of elements with atomic number (Z) from 12 to 85, at trace concentrations, without large variations in sensitivity among different elements, and it offers its maximum sensitivity in two atomic number regions: 20 < Z < 35 and 75 < Z < 85 (Reference Ghermandi and MyersGhermandi, 2000). However, for the purposes of this study, we focus on iron, silicon and titanium, which are major and minor constituents of the insoluble particles analyzed by PIXE, and which are present in the continental crust in approximately the same abundances as those in the particles in ice (Reference Taylor and McLennanTaylor and McLennan, 1985; Reference WedepohlWedepohl, 1995).
Results and Discussion
The elemental concentrations within the insoluble fraction of ice-core samples depend on the mineral phases composing the dust mixture, and their proportions. In turn, these are related to the dust source areas and to the processes occurring during transport. Settling of dust during atmospheric transport is a function of particle mass, and an important process occurring during transport is heavy mineral fractionation. The rapid gravitational settling of heavy minerals (such as magnetite, garnet, horneblende, zircon, rutile, epidote) makes them relatively more abundant in sediments with an overall larger grain-size (Reference Taylor and McLennanTaylor and McLennan, 1985).
Insoluble particles entrapped in polar ice, i.e. at the end of atmospheric dust transport, are crustal materials such as clays (mainly illite in East Antarctic ice; see Reference Gaudichet, De Angelis, Joussaume, Petit, Korotkevich and PetrovGaudichet and others, 1992), crystalline silica, feldspars, and minor proportions of pyroxenes and amphiboles, metallic oxides and volcanic glasses (Reference Gaudichet, Petit, Lefevre and LoriusGaudichet and others, 1986, Reference Gaudichet, De Angelis and Petrov1988). Silicate minerals are the main group typically observed in the dust microparticles (Reference Gaudichet, De Angelis and PetrovGaudichet and others, 1988; Reference MaggiMaggi, 1997) as well as the most abundant family of crustal materials, with Si (30–98%, mainly as SiO2) and Fe (0.10–70%, mainly as Fe2O3 + FeO) as major elements, and Ti (0.01–30%, mainly as TiO2) as a minor element incorporated into the crystal structure (Reference Deer, Howie and ZussmanDeer and others, 1993).
The relationship between the dust mass measured independently by particle counting (assuming spherical particles with density of 2.5 g cm–3) and the PIXE concentrations of Si, Fe, Ti, plus additional data for Ca and Al, are shown in Figure 3, together with the best-fit equations and the correlation coefficients. In the context of continental crustal element (CCE) abundances, Si and Fe are quite well correlated (correlation coefficient >0.70), and Ca and Ti are less well but still significantly correlated (>0.60). The correspondence supports the reliability of the PIXE technique. The higher dispersion of Ca and Ti data with respect to Si and Fe could be related to the lower element concentrations (0–8 ppb for Ca and 0–4 ppb for Ti) and to a natural scattering of the data.
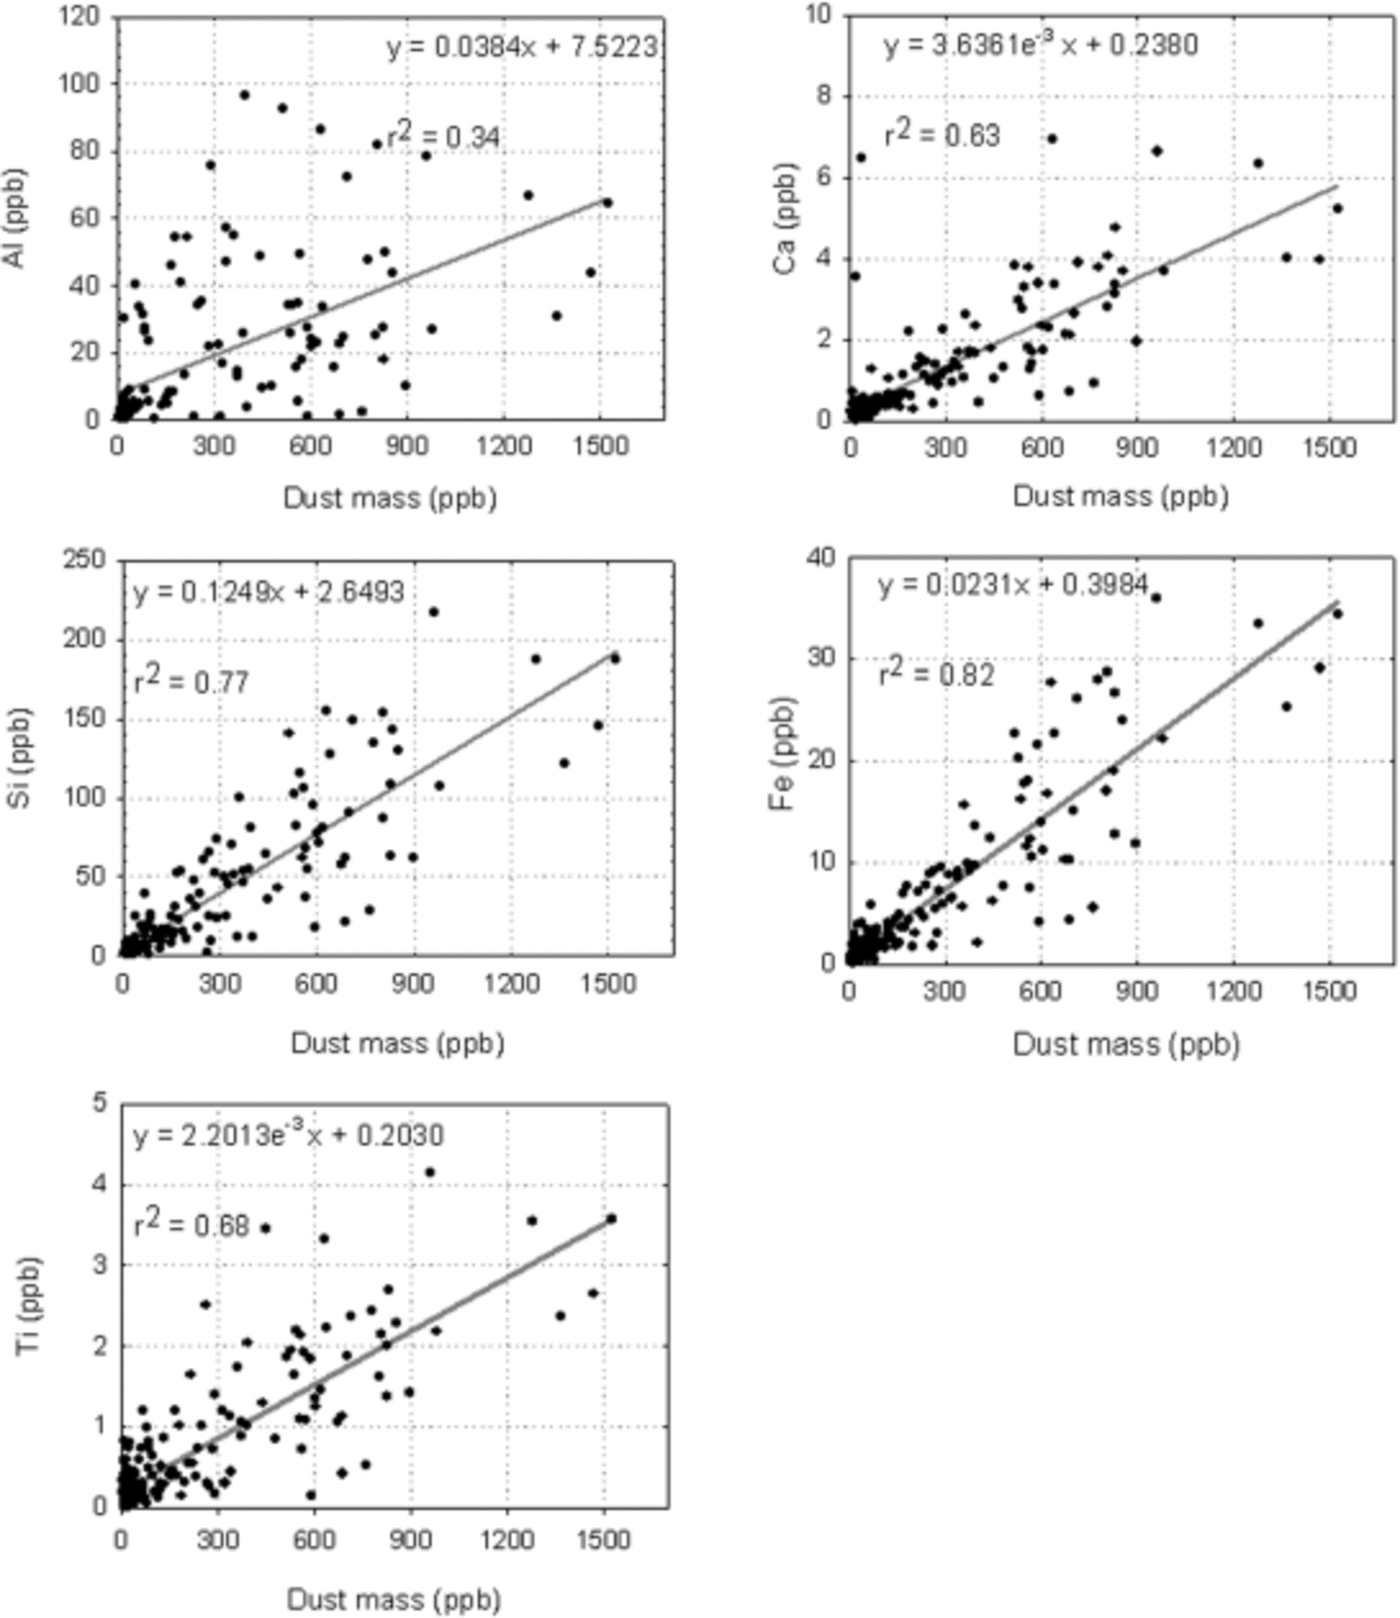
Fig. 3. Correlations between Al, Ca, Si, Fe and Ti concentration (ppb) measured by PIXE and the EPICA dust mass concentration (ppb) as determined by particle counting. The best-fit equations and the correlation coefficients are also shown on the graph.
Furthermore, it should be considered that particle counting and PIXE measurements are different analytical techniques, each having a different size threshold (0.7 μm for the particle counting, and 0.4 μm for the PIXE). If such differences do not greatly influence the dust concentration results (the modal value of the dust mass-size distribution being around 2 μm), the PIXE elemental abundances can suggest different mineral assemblages during different climatic periods, and possibly a larger abundance of clay minerals (fine fraction of dust), for example in the LGM. The availability of new deflation areas at that time (through lowering of the sea level and exposure on the South American continental shelf) could change the relative abundances of silicate and non-silicate minerals inside the dust plume (Reference MaggiMaggi, 1997).
The large scatter resulting from the comparison between the dust mass and Al concentrations (Fig. 3; r 2 = 0.34) reduces the significance of Al as a crustal reference element at this stage in the continuing work, and further work is needed to optimize the Al determination.
In addition, Ca, one of the most widely used markers for continental source materials, may derive partly from the soluble fraction (Reference RöthlisbergerRöthlisberger and others, 2002). Up to now, only a few studies have been done to understand the relationship between soluble and insoluble calcium in atmospheric load material (Reference LajLaj and others, 1997; Reference Hinkley and MatsumotoHinkley and Matsumoto, 2001). Moreover, because of the double origin of atmospheric calcium, continental and marine, differences between dust and sea-salt ratio during different climatic stages are observed. For example, Reference Hinkley and MatsumotoHinkley and Matsumoto (2001) observed that during the Holocene the dust/sea-salt mass ratio was around 0.28–0.47, whereas during the LGM it was around 3.0.
For these reasons this present work emphasizes Si, Fe and Ti only, because of their dominantly crustal origin, and because they are well correlated among themselves (correlation coefficient >0.85; Fig. 4). Si and Fe especially show high correlation, with an r 2 value of 0.98, but Si vs Ti and Fe vs Ti also have good correlations, with r 2 values of 0.87 and 0.85 respectively. These correlations indicate that the elements (Si vs Fe in particular) have similar behaviour in atmospheric insoluble particulate material, and that they do not undergo significant fractionation processes en route during transport.
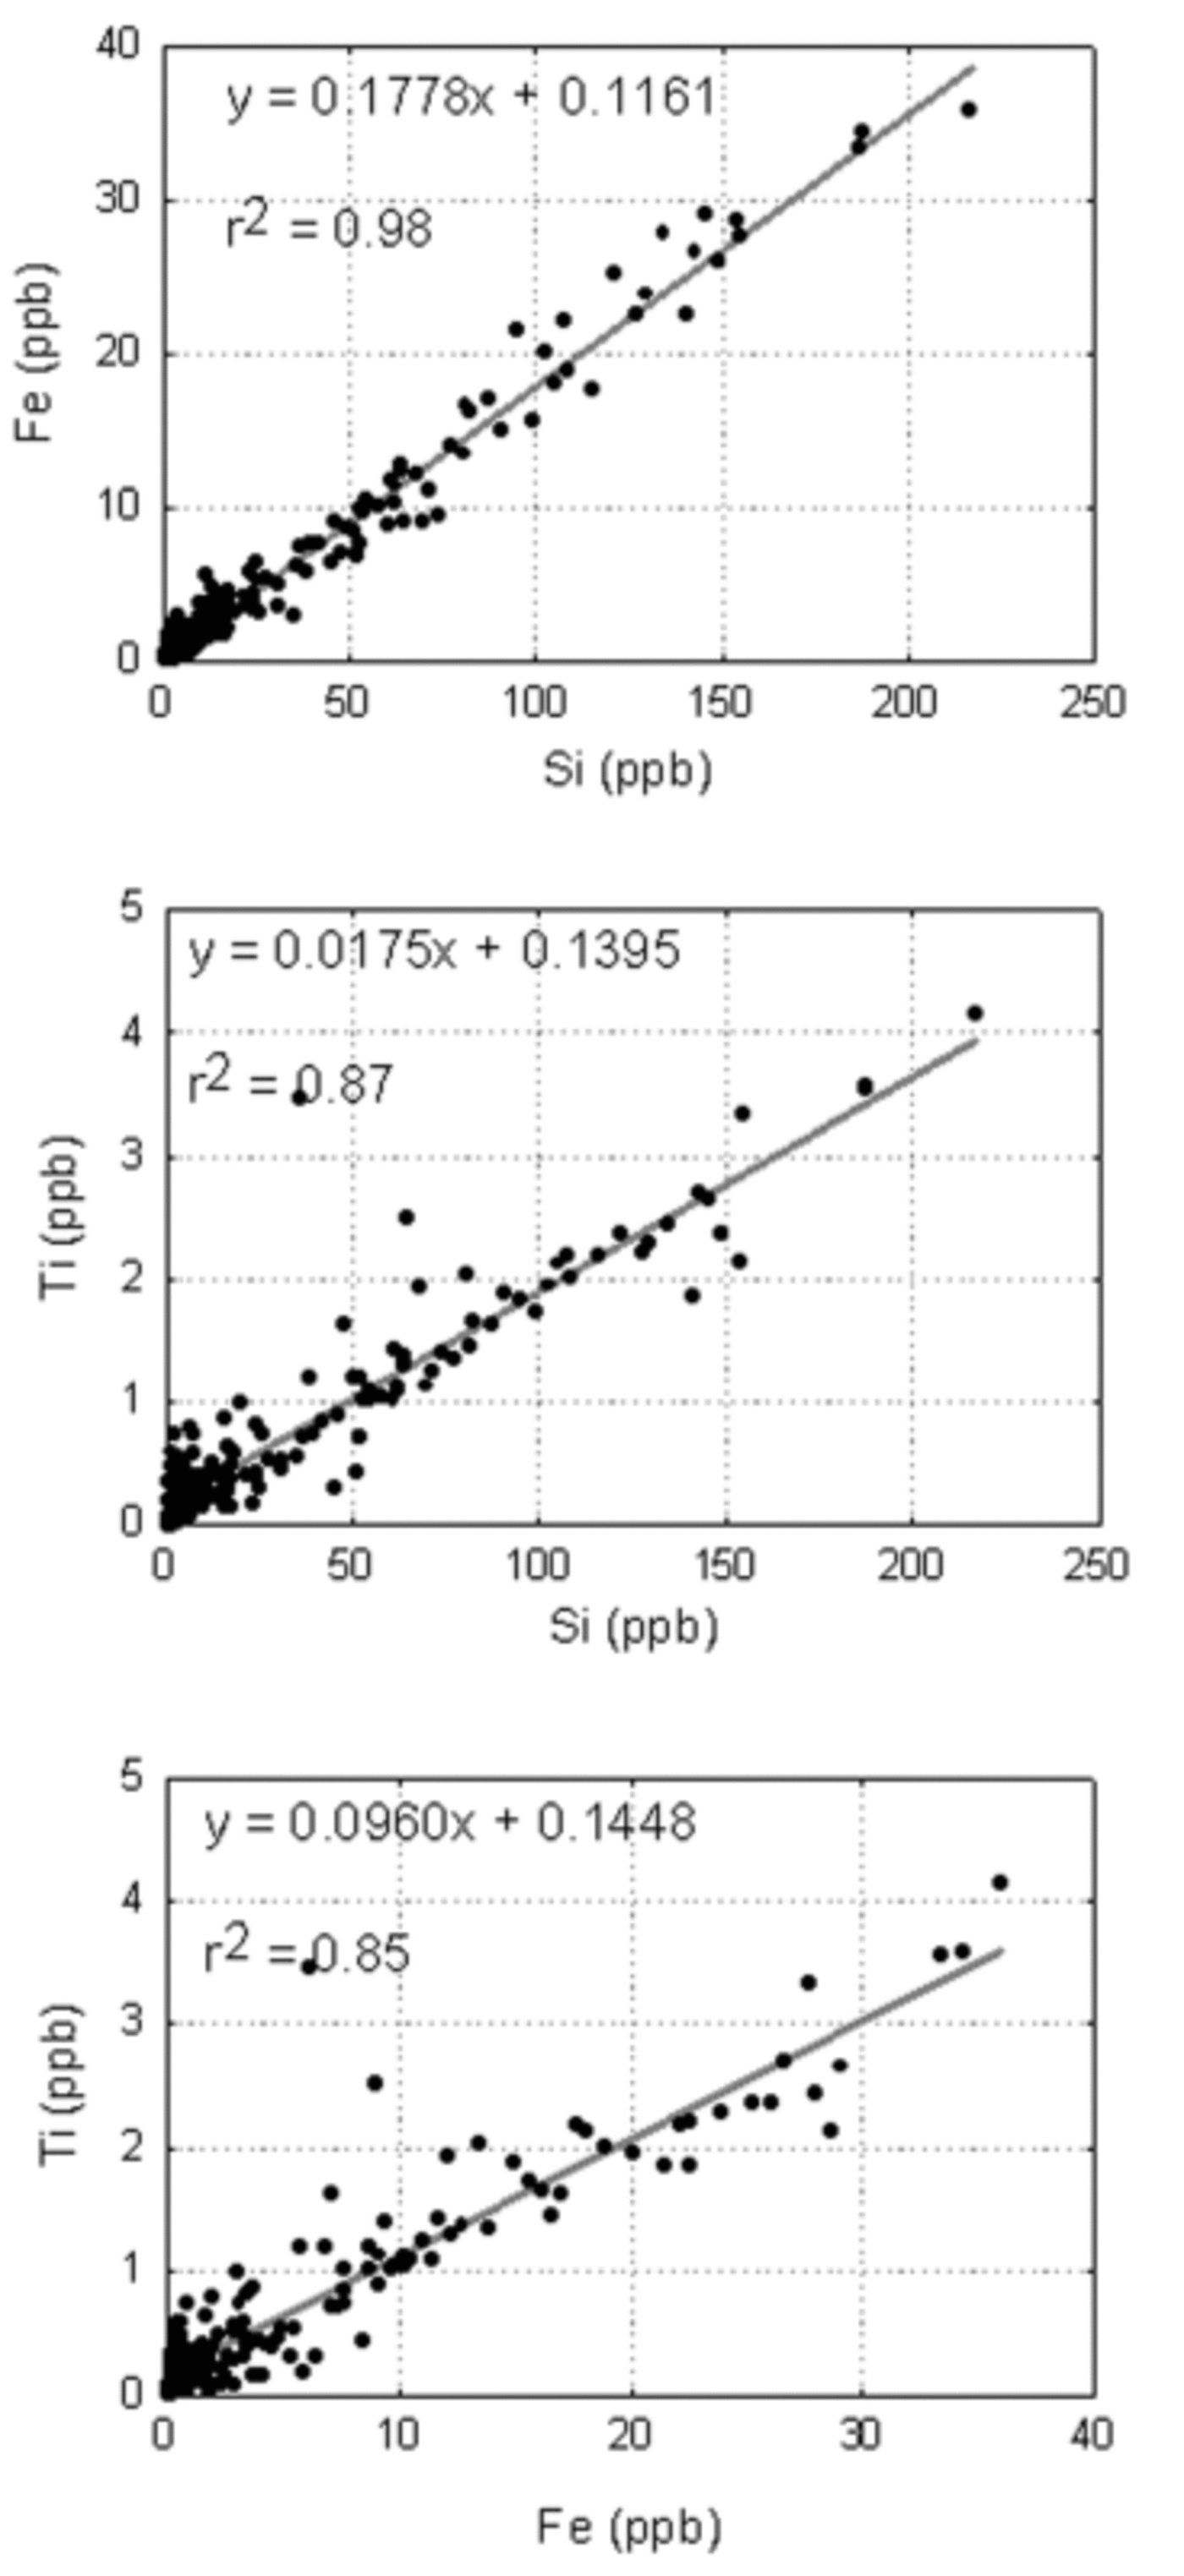
Fig. 4. Correlation of Si vs Fe, Si vs Ti and Fe vs Ti from PIXE measurements. The best-fit equations and the correlation coefficients are also shown on the graph.
The general pattern of Si, Fe and Ti concentration vs age within the EPICA ice core shows the same typical features as the dust mass record as determined by particle counting. High concentrations characterize glacial stages, and low or very low concentrations are typical for interstadials and interglacials (Fig. 5). The cold stages 2, 4 and 6 are well delineated by the major features of the elemental (Si, Fe, Ti) records as well as by the total dust mass record as determined by particle counting.
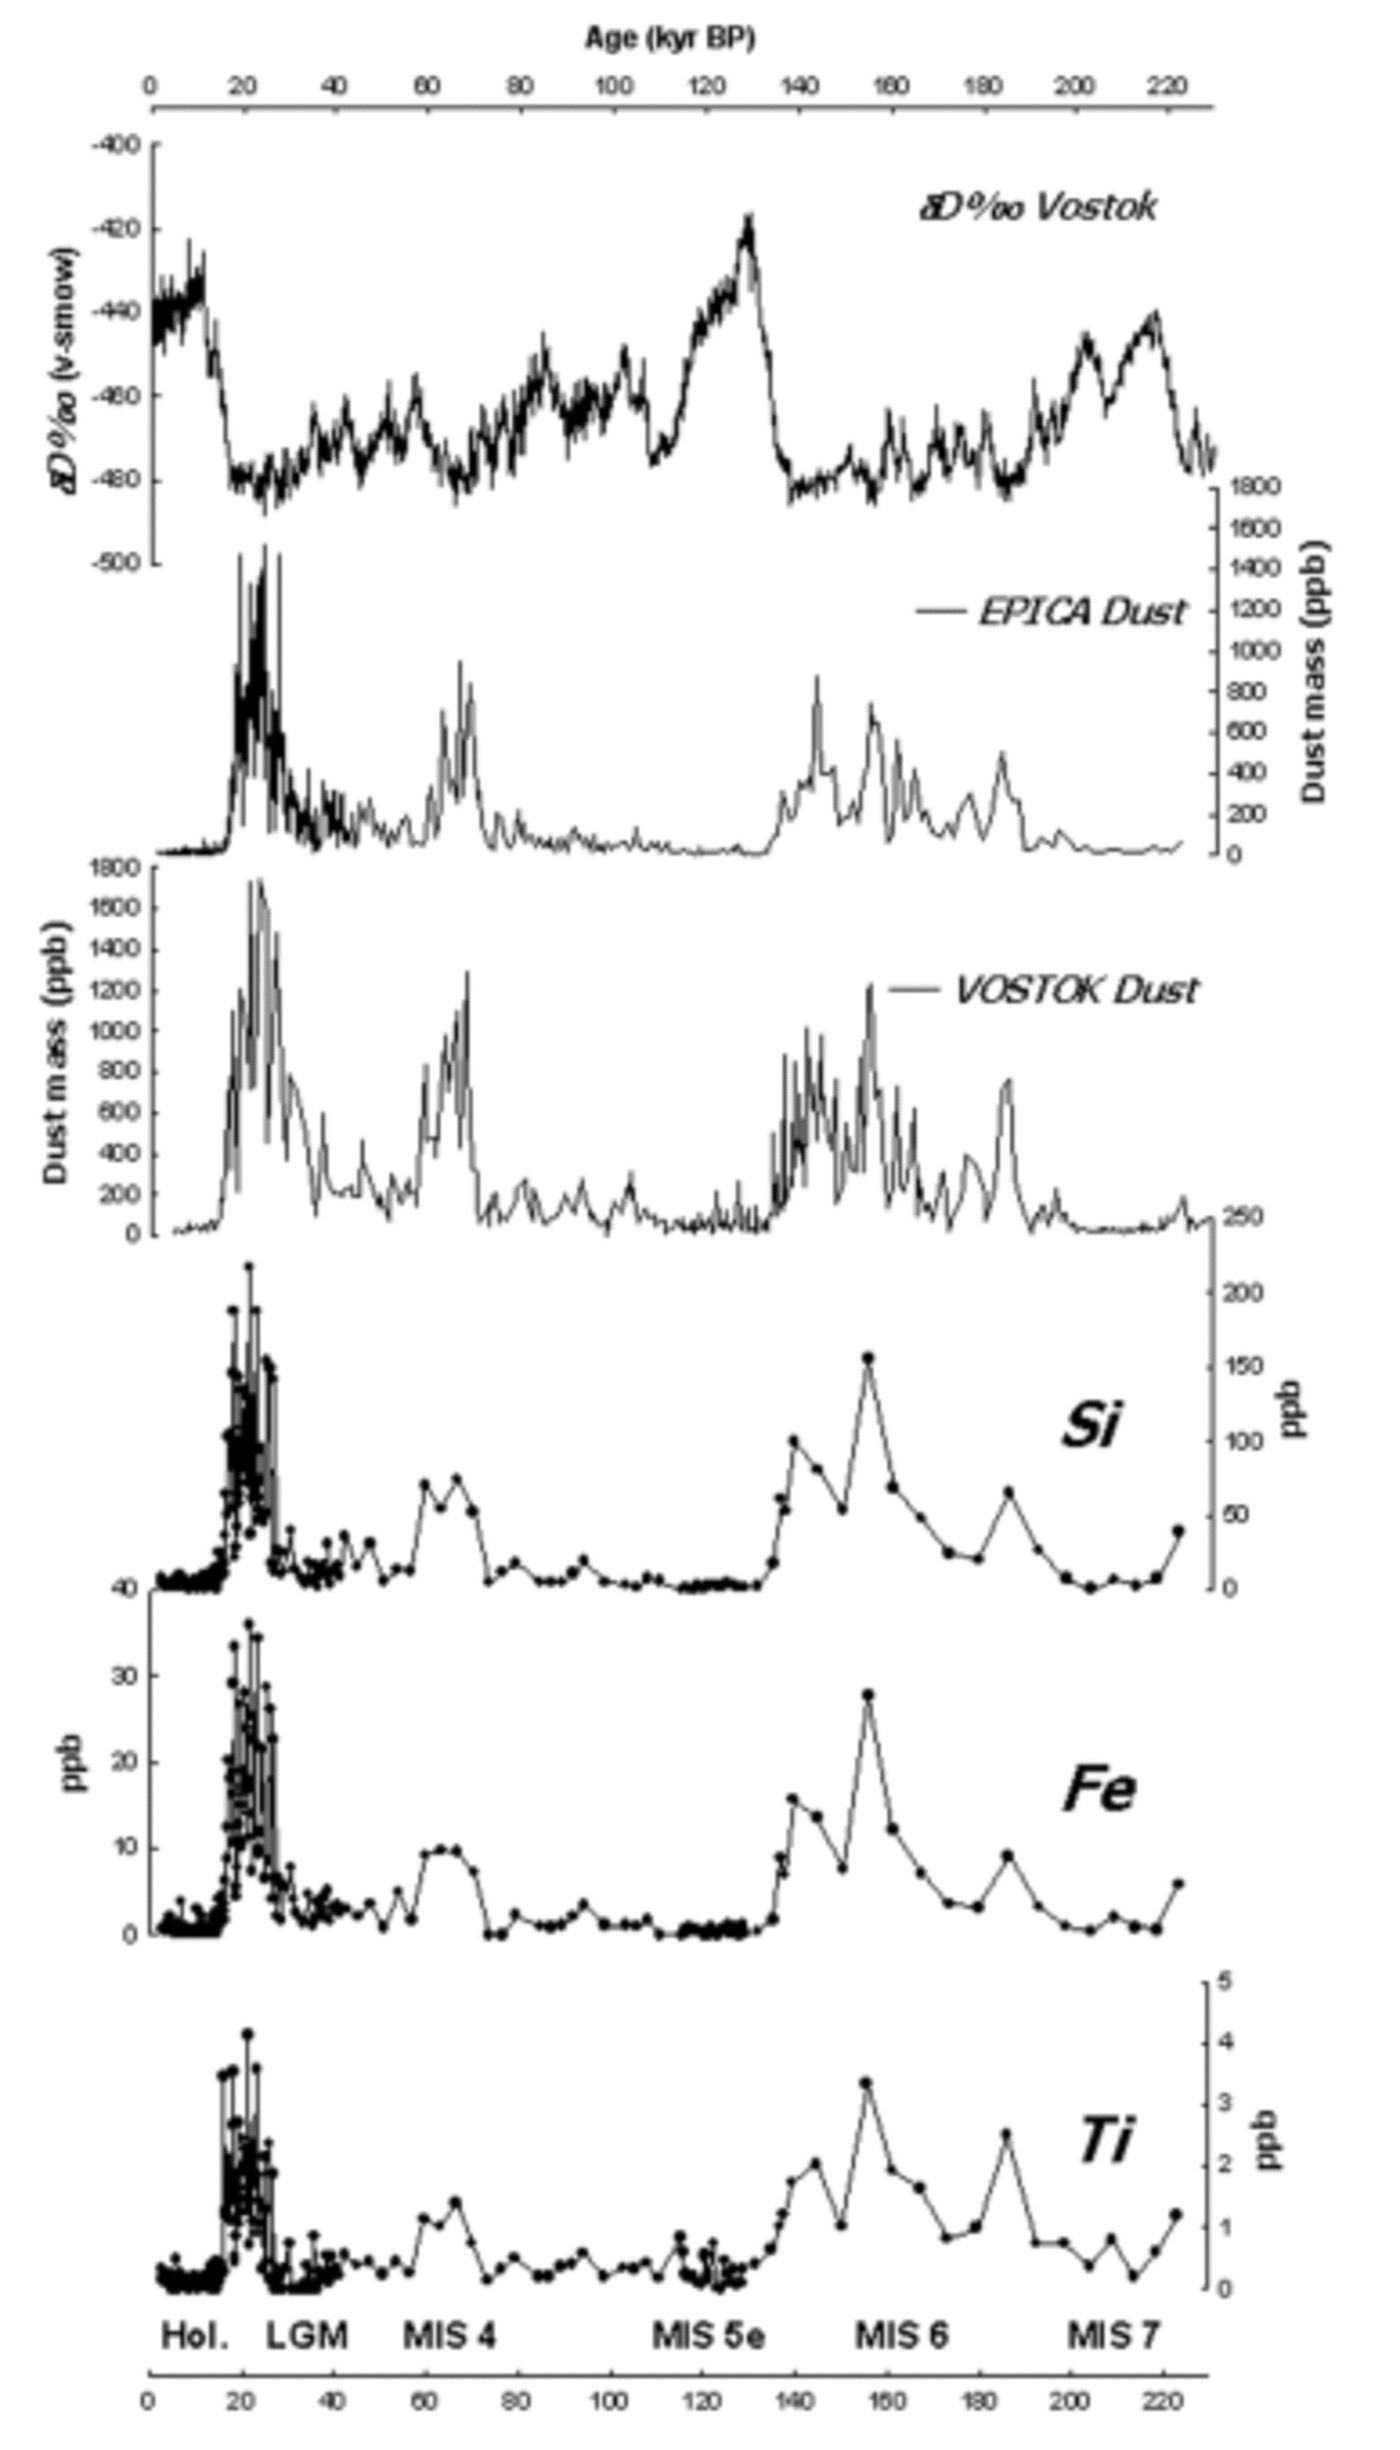
Fig. 5. Silicon (Si), iron (Fe) and titanium (Ti) records from EPICA ice core, obtained by PIXE measurements, in comparison with EPICA dust mass concentration and Vostok dust mass concentration (Reference PetitPetit and others, 1999) and Vostok deuterium profile (Reference PetitPetit and others, 1999). The nomenclature used in the discussion (Hol. = Holocene; LGM = Last Glacial Maximum; MIS 3, 4, 5e, 6, 7 = marine isotopic stages) is shown at the bottom.
During the last climatic transition, documented by PIXE at high resolution, the typical Holocene values are reached around 14.6 kyr BP, the same as for the total dust concentration as determined by particle counting. Despite the lower sampling frequency, moreover, during stages 4 and 6 the PIXE data also match quite well the pattern of total dust variations (as determined by particle counting) both in EPICA Dome C and in the Vostok cores (Fig. 5).
The average Si, Fe and Ti concentrations with respect to the dust mass as determined by particle counting differ slightly between cold and warm periods (Table 3; Fig. 6): samples from extremely cold periods show strong correlation between Si, Fe and Ti. During warm periods (Holocene and stage 5e), in contrast, the correlation between elements is reduced. Interglacial ice is characterized by low dust concentrations, and PIXE measurements are close to the detection limits; data are therefore more scattered, and clusters of points can be observed close to the axis origin (Fig. 6). However, we should also note that glacial stages are characterized by high variability, and even for samples having fairly low concentrations the correlations remain good (Fig. 6a).
Table 3. Average concentrations of Si, Fe and Ti for the principal climatic periods and dust mass concentrations (sd = standard deviation) for the last 220 kyr

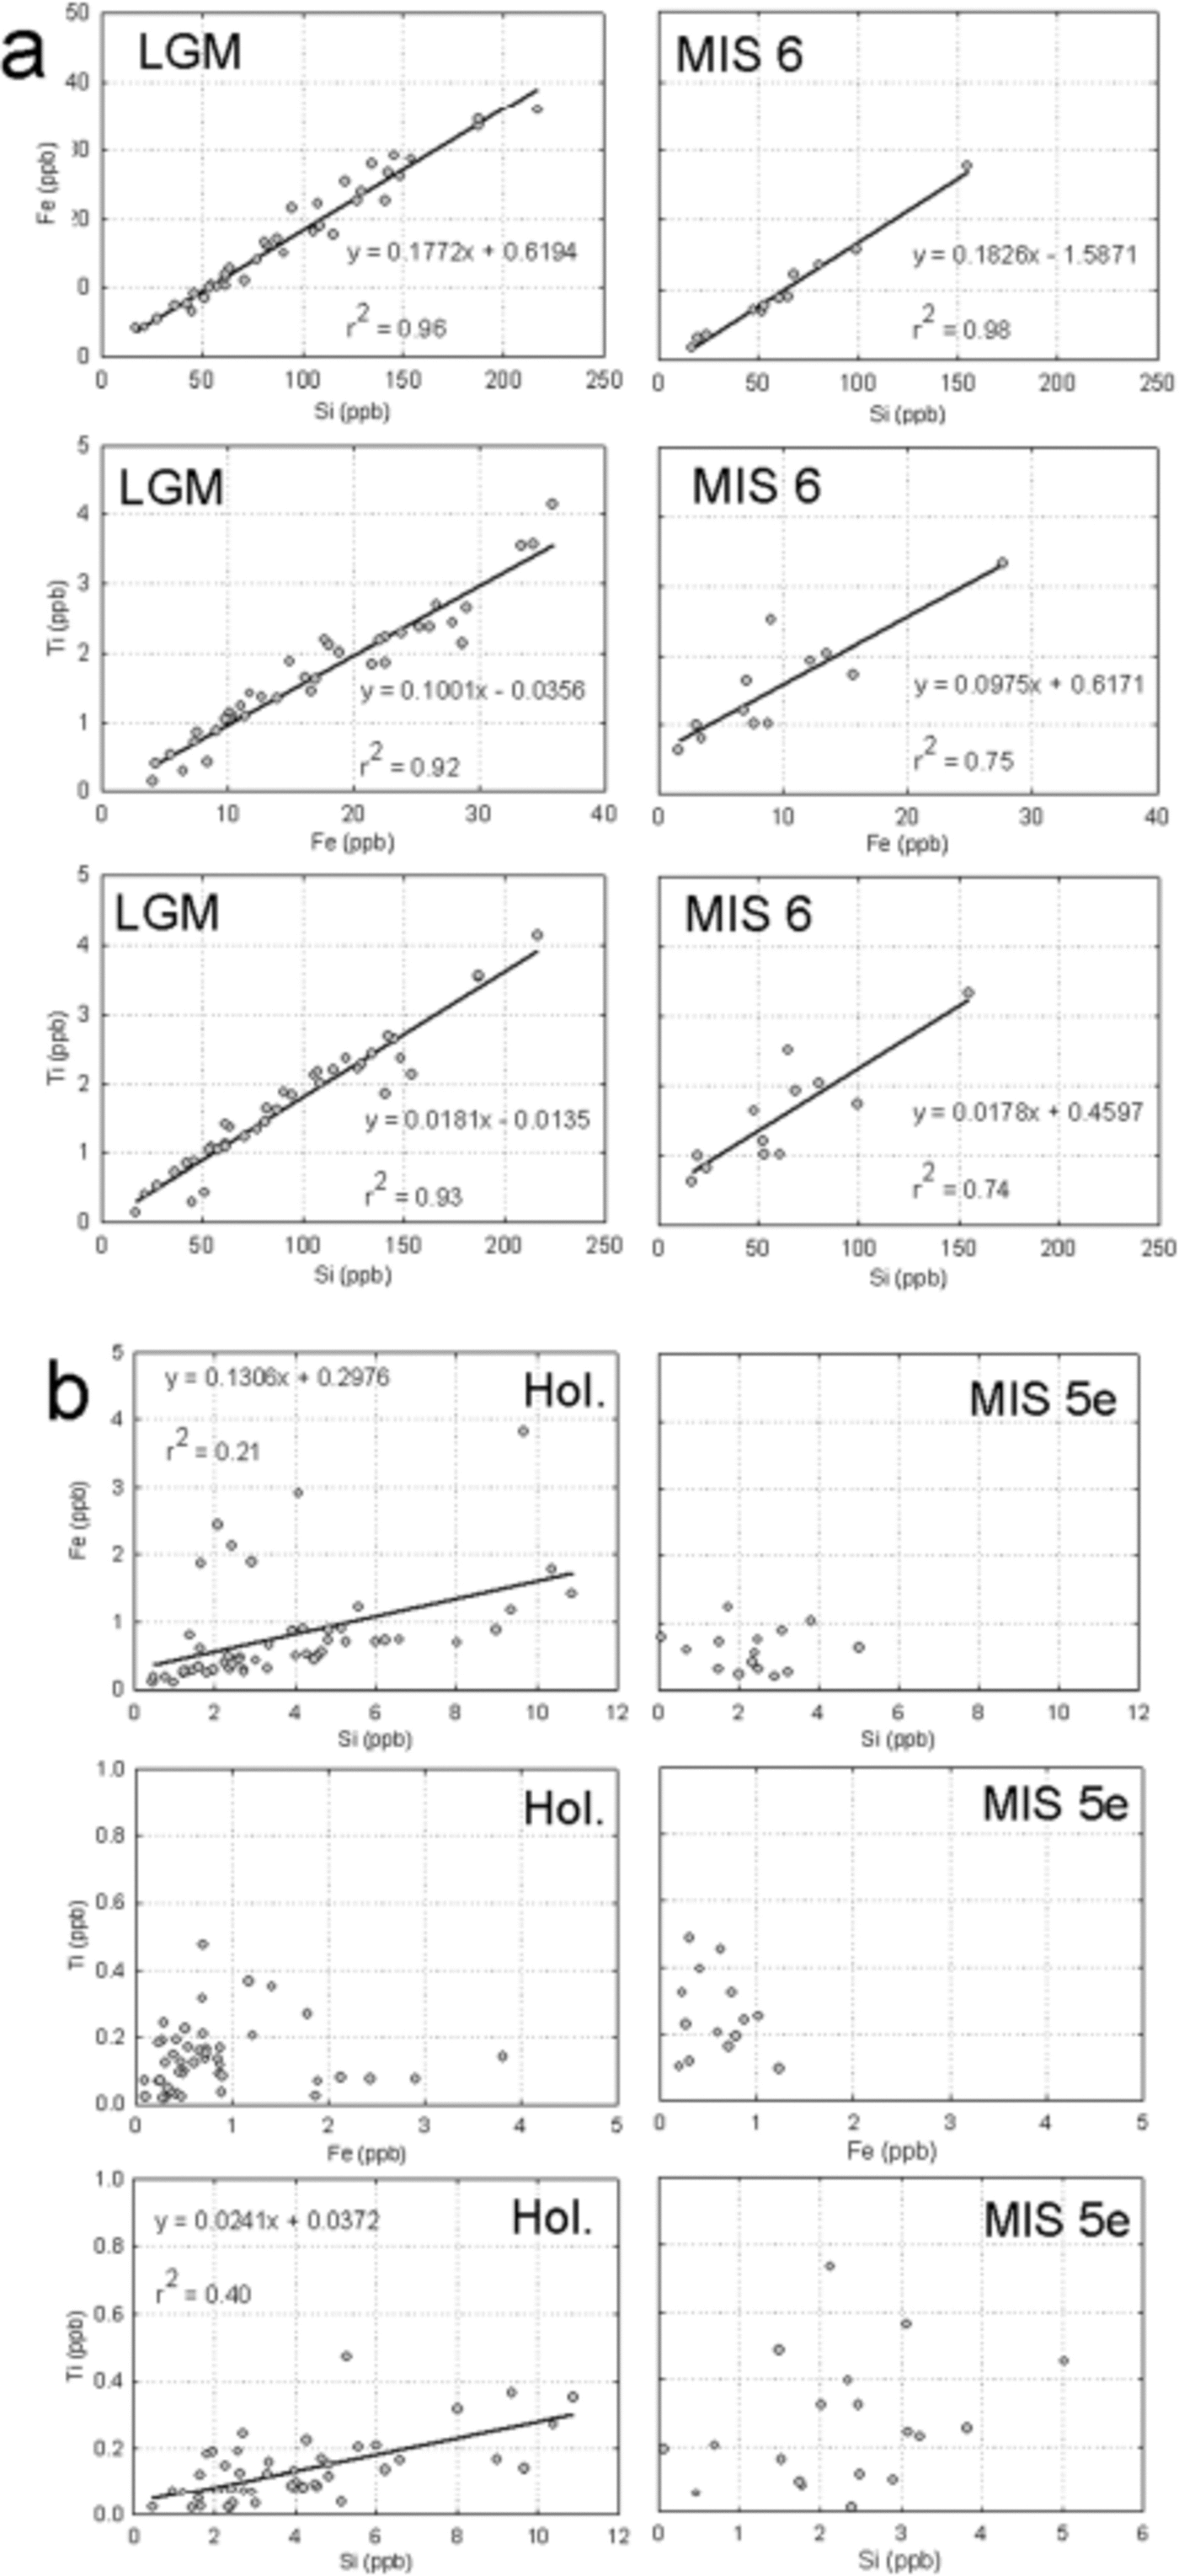
Fig. 6. Correlation of Si vs Fe, Si vs Ti and Fe vs Ti from PIXE measurements during glacial/interglacial stages: (a) glacial stages: LGM and MIS 6; (b) interglacial stages: Holocene and MIS 5e. The best-fit equations and the correlation coefficients are also shown on the graph.
Glacial/interglacial differences have to be tested in future through further measurements on the very low-concentration interglacial samples; nevertheless, they are consistent with the hypothesis of a change in dust provenance or a contribution from an additional geographic source that preliminary isotopic measurements on interglacial dust have suggested (Reference DelmonteDelmonte, 2003).
Despite the different resolution of sampling and the number of data available, the average abundances of the elements (especially for silicon and iron) also seem to differ between glacial stages 2 and 6 (Table 4), both elements being relatively higher in stage 6 and closer to the concentration values of the upper continental crust (UCC; Reference WedepohlWedepohl, 1995).
Table 4. Average abundances of the elements (percentage of each element with respect to the total dust mass) for the different climatic periods, and abundances of UCC elements for comparison (Reference WedepohlWedepohl, 1995)
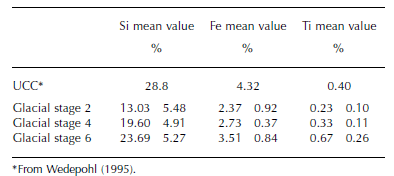
Unlike glacial/interglacial differences, the variations observed in the elemental abundances between glacial stages are likely not affected by analytical uncertainties, and need to be considered in further detail. Provenance and transport changes seem quite unlikely, since particle size distributions and geochemical (Sr-Nd) signatures in between glacial stages are very similar (Reference Basile, Grousset, Revel, Petit, Biscaye and BarkovBasile and others, 1997; personal communication from B. Reference DelmonteDelmonte, 2003). Therefore, a possible explanation could involve changes within South America, the dominant source for glacial aeolian dust in Antarctica; these variations probably affected the characteristics of deflation surfaces (pedogenesis, changes in hydrological cycle and environmental conditions) and/or their extent (exposure of sea levels during the two cold stages).
It should be emphasized at this step that the element ratios for the UCC (Table 5, from Reference WedepohlWedepohl, 1995) are averaged over all bulk rocks, and compositional changes due to weathering of terrains, that may become important in areas of aeolian deflation (Reference ArimotoArimoto, 2001; Reference Harrison, Kohfeld, Roelandt and ClaquinHarrison and others, 2001; Reference Kohfeld and HarrisonKohfeld and Harrison, 2001), are not taken into account.
Table 5. Element ratios (Fe/Si, Ti/Si, Ti/Fe) calculated for the principal climatic periods, and CCE ratios (Reference WedepohlWedepohl, 1995) for comparison (sd = standard deviation)
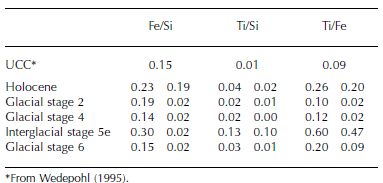
The similarity of our glacial values to literature values for the UCC (Table 5), and the deviation from these reference values for interglacial samples, could be the basis of a hypothesis that the changes in surface rock and soil properties are a consequence of climatic and environmental changes (rise of sea level, development of pedogenesis and vegetation cover) during warm periods.
The Fe/Si, Ti/Si and Ti/Fe ratios measured by PIXE are of crucial importance for investigation of paleoenvironmental and climatic changes. Because different rock-forming minerals have different relative abundances of Si, Fe and Ti (Reference Deer, Howie and ZussmanDeer and others, 1993), the ratios of these elements measured in polar ice can provide a potential for evaluation of the evolution of the first-order dust mineralogical composition (Table 5).
Conclusions
In this work we presented the first records of Si, Ti and Fe measured by the PIXE technique of the insoluble dust from the EPICA ice core. The profiles of the three elements show a very close relationship with the total dust mass concentration measured by particle counting (Coulter©Counter) and reveal that they are a good proxy for continental dust.
The elemental concentrations and their relative abundances can help in the evaluation of changes that may have occurred at the dust sources in the different climatic periods. Cold stages 2 and 6 show different concentrations and proportions of elements, suggesting possible environmental and climatic changes within the dust source region (southern South America). Also, elemental abundances differ between glacial and interglacial periods, suggesting possible changes at the original dust source or contributions from new sources; however, the very low dust concentrations characterizing warm periods cause the data to be close to the detection limit of PIXE, and therefore additional measurements are needed.
We suggest that Si (28.8% on average in the upper crust) can be used as a proxy for continental aerosol. The PIXE system seems a reliable tool for atmospheric dust analysis for climatic and environmental purposes. The advantage of the technique is that it permits the inspection of small amounts of particles collected from Antarctic ice-core samples. The next step will be to increase the number of elements to include in the climatic and environmental discussions, in order to quantify the contribution of each element in the dust and the interplay of all of them.
Acknowledgements
This work is a contribution to the ‘European Project for Ice Coring in Antarctica’ (EPICA), a joint European Science Foundation(ESF)/European Commission (EC) scientific programme, funded by the EC and by national contributions from Belgium, Denmark, France, Germany, Italy, the Netherlands, Norway, Sweden, Switzerland and the United Kingdom. This is EPICA publication No. 99. The authors thank T. Hinkley and an anonymous referee for helpful comments and suggestions that improved the manuscript.


