


According to the International Diabetes Federation, the global prevalence of diabetes is estimated at 10·5 % (536·6 million people) among people aged 20–79 years in 2021. It is expected to rise to 12·2 % (783·2 million people) by 2045, with the majority of them being type 2 diabetes mellitus (T2DM)(Reference Sun, Saeedi and Karuranga1,Reference Rittiphairoj, Pongpirul and Mueller2) . T2DM is a complex chronic non-communicable disease, the occurrence of which is associated with genetic and various environmental factors(Reference Kautzky-Willer, Harreiter and Pacini3). Recent studies suggest that the development of T2DM may be associated with alterations in the gut microbiota (GM) and that the complex interactions between the GM and diet play an important role in regulating the metabolic health of the host(Reference Zmora, Suez and Elinav4). For illustration, dietary fibre may be fermented by specific intestinal microorganisms to produce short-chain fatty acids (SCFA), which stimulate the secretion of glucagon-like peptide-1 and regulate glucose metabolism(Reference He, Zhang and Shen5).
Previous experimental animal studies exploring the relationship between intestinal microbiota, dietary intake and T2DM could reveal that dietary fibre-rich ingredients, such as mung bean peel(Reference Hou, Zhao and Chen6), carob-rich functional meat(Reference Macho-Gonzalez, Garcimartin and Redondo7), a total saponin from Lohangi(Reference Zhang, Peng and Zhao8) Potentilla discolours Bunge aqueous extract(Reference Han, Li and Du9) or flora transplantation(Reference Lee, Lee and Park10), could promote the accumulation of beneficial intestinal bacteria and increased levels of the metabolite SCFA in mice, thus acting as an anti-diabetic and associated inflammatory agent. Similar results have been observed in observational studies of populations, where microbiome profiles and SCFA levels were associated with diet, T2DM and lifestyles(Reference Maldonado-Contreras, Noel and Ward11–Reference Wang, Gou and Su15). These findings demonstrate that dietary composition or quality can cause changes in the composition and function of the GM and thus influence the progression of T2DM.
China has many people with diabetes and pre-diabetes, and diabetes has become a major health problem(Reference Xu, Wang and He16). Given the specific dietary habits of the Chinese and the differences in the intestinal flora of T2DM between Chinese and European or American populations(Reference Karlsson, Tremaroli and Nookaew17–Reference Yang, Lipworth and Shu20), the results of studies from other countries may not be universally applicable to the Chinese population. More comprehensive analyses examine the relationship between intestinal flora metabolite characteristics, dietary quality and T2DM in rural Chinese populations. Therefore, using a case–control study based on Henan Rural Cohort, we aimed to investigate the characteristics of SCFA, the metabolite of intestinal flora, in a population in rural areas and to examine the association between fecal SCFA levels, dietary quality and T2DM. As a secondary objective, we aimed to explore the interaction between SCFA levels and diet quality on T2DM.
Materials and methods
Study population
Participants in this study were drawn from the Henan Rural Cohort(Reference Liu, Mao and Li21), a large population-based study of chronic non-communicable diseases conducted within five regions of Henan Province, China. Briefly, 39 259 participants aged 18–79 years were recruited in the cohort between July 2015 and September 2017. During the follow-up period in 2021, fifty participants with new-onset T2DM were randomly selected as the case group from Suiping County. The inclusion criteria were as follows. (1) patients between 35 and 79 years of age; (2) no intention to change diet, exercise or lose weight during the study; (3) informed consent to the study from the participants and their families and (4) no consumption of probiotics, antibiotics, microbial preparations in the last 4 weeks. The exclusion criteria were as follows: (1) treatment with antibiotics or ingestion of other substances that affect the intestinal flora within 2 months before stool sampling; (2) recent history of diarrhoea, inflammatory bowel disease or other medical conditions that may affect the intestinal microbiota and (3) lack of information on dietary intake questionnaires or other covariates. Fifty healthy participants were randomly selected as the control group with the same criteria. Consequently, 100 subjects (50 T2DM patients and 50 matched controls) were included in this study.
This study was conducted according to the guidelines laid down in the Declaration of Helsinki, and all procedures involving human subjects were approved by the Life Sciences Ethics Committee of Zhengzhou University ((2015) MEC (S128)). Written informed consent was obtained from all subjects.
Data collection and anthropometric measurements
Basic information on participants was obtained through standardised questionnaires administered by trained staff. Demographic characteristics (age, gender, income, marital status and education level), lifestyle behaviours (smoking, alcohol consumption, physical activity and dietary habits), personal and family medical history and other information were collected through face-to-face interviews.
Educational attainment is divided into two categories according to the questionnaire report: illiterate or primary, secondary and above. Marital status was classified into two levels, including married/cohabiting and other/widowed. Monthly per capita household income was calculated on a household basis and divided into three categories: < 500RMB/month, 500–1000RMB/month and ≥ RMB/month. Both smoking and drinking status were classified into two classes based on whether they had a history of smoking or drinking. The International Physical Activity Questionnaire classifies physical activity levels into three levels: heavy, moderate and light.
Anthropometric variables included height, weight and waist circumference (WC). Weight was measured to the nearest 0·1 kg with the individuals dressed lightly without shoes using a weight measurement device (V. BODY HBF-371, OMRON). Height and WC were measured to the nearest 0·1 cm with the individual’s shoes off upright against a calibrated wall using a standard ruler. BMI was calculated by dividing weight (kg) by the square of height (m). After a rest period of at least 5 min, systolic blood pressure and diastolic blood pressure were measured three times with an electronic sphygmomanometer (Omron HEM-7071A) on the right arm at 30-second intervals. The average of the three measurements was used to calculate the pulse pressure for statistical analysis.
Blood and fecal samples collection and laboratory analysis
Venous blood samples were collected from participants who had fasted overnight for laboratory measurements. Fasting plasma glucose (FPG), insulin (INS) glycosylated hemoglobin (GHB) HbA1C, total cholesterol (TC), TAG, HDL-cholesterol) and LDL-cholesterol were measured directly or enzymatically using a ROCHE Cobas C501 automated biochemistry analyzer. Homeostatic model assessments of insulin resistance (HOMA2-IR) and beta-cell function (HOMA2-β) were calculated according to the designed equations based on fasting glucose and insulin levels(Reference Wallace, Levy and Matthews22).
Participants were given a specimen collection kit to collect fresh morning stools, place them in a holding tank and then store them in a –80℃ refrigerator for testing. Targeted analysis of SCFA using a GC-MS system from Thermo. The pure standards of acetic acid, propionic acid, butyric acid, isobutyric acid, valeric acid, isovaleric acid and hexanoic acid were measured in appropriate amounts and prepared in ether to make ten mixed standards of 0·02 μg/ml, 0·1 μg/ml, 0·5 μg/ml, 2 μg/ml, 10 μg/ml, 25 μg/ml, 50 μg/ml, 100 μg/ml, 250 μg/ml and 500 μg/ml concentration gradients. The master mix and working standard solution were stored at –20°C. Centrifuge 50 μl of 15 % phosphoric acid, 100 μl of 125 μg/ml internal standard (isocaproic acid) and 400 μl of ether in a 2 ml centrifuge tube for 1 min. The supernatant was centrifuged at 12 000 rpm for 10 min at 4°C. The supernatant was taken up for GC-MS analysis. GC-MS analysis was performed using a Trace 1300 gas chromatograph system coupled with an ISQ 7000 mass spectrometer. The system uses an Agilent HP-INNOWAX capillary column with a split injection volume of 1 μl and a split ratio of 10:1. The sample inlet temperature is 250°C, the ion source temperature is 300°C and the transmission line temperature is 250°C. The programmed ramp-up starts at 90°C, then ramps up to 120°C at 10°C/min, then to 150°C at 5°C/min, and finally to 250°C at 25°C/min for 2 min. The carrier gas is helium at a flow rate of 1·0 ml/min(Reference Zhang, Wang and Zhu23,Reference Hsu, Chen and Lin24) . The energy was –70 eV in electron impact mode.
 $${{\!\!{\rm Content (\mu g/g)\hskip-0.5pt =\hskip-0.5pt C (\mu g/ml) \!\times\! {\rm{0}} \cdot {\rm{5/sampling \,volume \,(mg)}}\! \times\! {\rm{1000}}}}}$$
Dietary intake and alternate healthy eating index 2010
Dietary intake was assessed using a validated semi-quantitative FFQ (includes thirteen foods (staples, pork, beef and lamb, chicken and duck, fish, eggs, dairy products, fresh fruit, fresh vegetables, pulses and legumes, dried fruits, salted and pickled vegetables, mixed grains and animal oils)) based on Chinese dietary guidelines and dietary characteristics of rural residents in Henan Province, which was described in detail previously(Reference Xue, Yang and Wang25). Participants were asked to report the frequency (never, day, week, month and year) and amount (kilograms, grams) of their consumption for each food or beverage item. Then the response was converted into the average daily intake by dividing the intake amount of the individual group by their frequency. Scoring criteria for the 2010 Alternate Healthy Eating Index (AHEI-2010) are described elsewhere(Reference Chiuve, Fung and Rimm26). Because consumption of sugary drinks and fruit juices was very low in the study population, and information on sugary drinks and fruit juices was not collected in the rural Henan cohort, scores for these two components were not included in this study. AHEI-2010 score was calculated based on nine dietary components (vegetables, fruits, whole grains, nuts and legumes, red or processed meat, EPA + DHA, PUFA, Na and alcohol) in this study. Each component was given a minimum score of 0 and a maximum score of 10, with intermediate values scaled and potentially contributing 0–10 points to the total score. The scores for all components are added together to give a total AHEI-2010 score ranging from 0 to 90, with higher scores indicating a healthier diet.
Definition of type 2 diabetes
According to American Diabetes Association criteria(27) and the WHO(Reference Alberti and Zimmet28), people with diabetes were defined as those with fasting blood glucose ≥ 7·0 mmol/l (≥ 126 mg/dl), glycated Hb ≥ 6·5 %(47·5 mmol/mol) or self-reported being diagnosed with T2DM by a physician or taking hypoglycaemic drugs in the past 2 weeks.
Statistical analysis
Normally distributed data were expressed as mean ± standard deviation (sd) and analysed using independent t tests. Data that were not normally distributed (continuous variables) were expressed as medians and inter quartiles and analysed using the Wilcoxon rank sum test. χ2 tests were used to test for differences in categorical variables between cases and controls. We used two independent samples t test or Mann–Whitney U tests to compare SCFA levels between subjects with T2DM and controls. Pearson correlation analysis was used to calculate correlations for SCFA and principal component analysis to demonstrate differences in SCFA levels between the T2DM and control groups. Spearman correlation was used to investigate the relationship between SCFA levels and metabolic indicators of T2DM. Multiple linear regression was used to explore the association of SCFA with FPG and HOMA2-β levels. Generalised linear regression models were used to explore the relationship between SCFA levels, AHEI-2010 diet scores and T2DM risk separately. Model 1 was not adjusted. Model 2 was additionally adjusted for other non-dietary factors, including age, WC, TAG, gender, level of education, income, smoking, drinking and physical activity. Model 3 was further adjusted for BMI, total energy, cholesterol and protein. In addition, generalised linear regression models were used to explore the interaction between SCFA levels and dietary quality on T2DM outcomes. All analyses were performed using SPSS software version 26.0 or R software version 4.2.2, and results with P < 0·05 were considered significant.
Results
Demographic information characteristics
The characteristics of the participants are shown in Table 1. Overall, the mean (sd) age was 59·22 (7·872) years, of which 63·0 % were female. Compared with controls, diabetic participants had higher levels of BMI, WC, FPG, INS, GHB, HbA1c and TAG (P < 0·05 for all), but the differences in total energy, carbohydrate, cereal fibre, cholesterol, protein, the pulse pressure, TC, HDL-cholesterol, LDL-cholesterol and other lifestyle habits were not statistically significant. Besides, participants’ adherence to the dietary guidelines for Chinese residents was relatively low. As assessed by the Alternate Healthy Eating Index 2010, we found that participants in this study had AHEI-2010 diet scores ranging from 20·5 to 58·5, with controls having higher AHEI-2010 diet scores than patients with T2DM (P < 0·05). For each diet component score of the AHEI-2010, T2DM patients had lower vegetable and fruit scores than non-T2DM patients (P < 0·05) (online Supplementary Table 1).
Table 1. Descriptive characteristics of the study participants
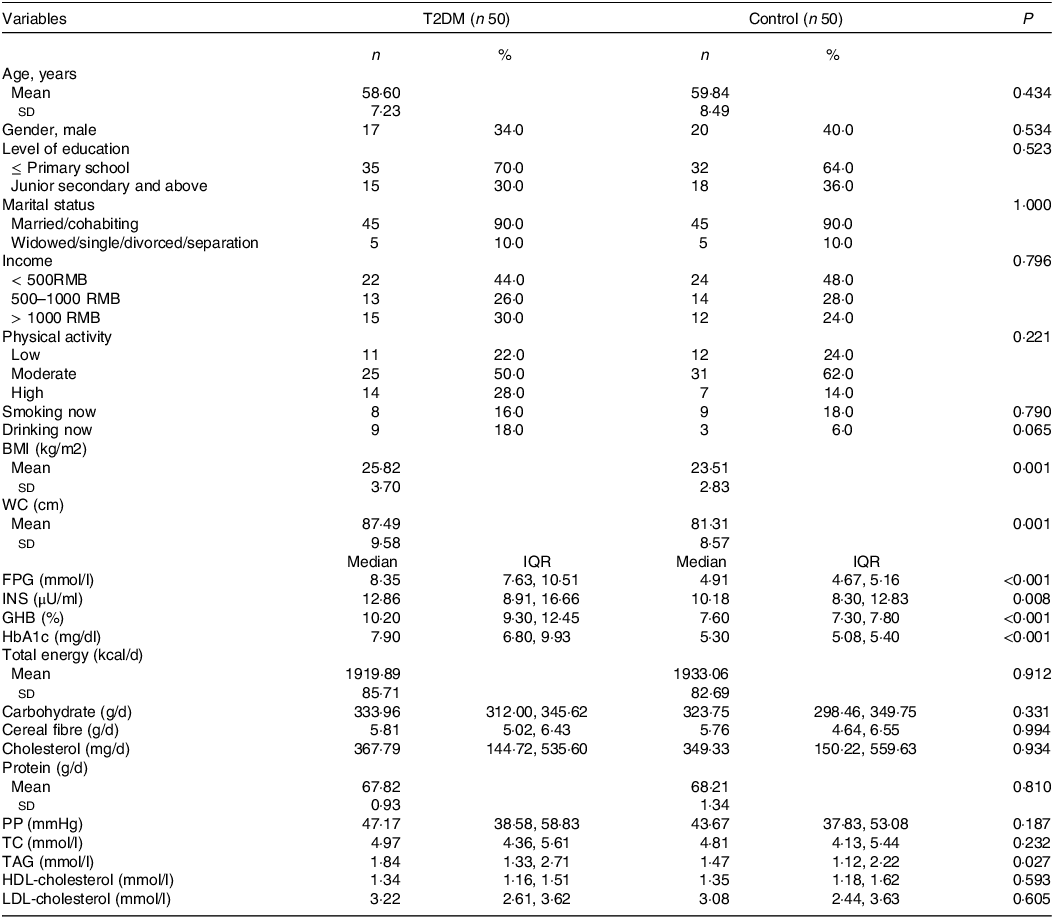
T2DM, type 2 diabetes mellitus; RMB, renminbi; WC, waist circumference; FPG, fasting plasma glucose; INS, insulin; GHB, glycosylated hemoglobin; HbA1c, hemoglobin A1C; PP, pulse pressure; TC, total cholesterol.
χ2 tests for categorical variables, t test or Wilcoxon rank sum test for continuous variables.
Short-chain fatty acid levels difference between type 2 diabetes mellitus and controls groups
SCFA levels difference between T2DM and control groups are shown in Fig. 1. T2DM group had lower levels of acetic acid (1238·776 (991·418, 1547·473) v. 1474·130(1220·787, 1795·313), P = 0·021) and butyric acid (472·913 (270·433, 778·818) v. 697·022 (548·789, 918·609), P = 0·005) compared with the control group participants. Correlation heat maps were used to show the correlation between metabolites (Fig. 2). Among them, acetic acid was moderately positively correlated with propionic acid, butyric acid, valeric acid and caproic acid; propionic acid showed a low positive correlation with butyric acid and valeric acid and a negative correlation with isobutyric acid and isovaleric acid; isobutyric acid is highly positively correlated with isovaleric acid, but moderately positively correlated with valeric and caproic acid. Besides, there was a moderate positive correlation between butyric acid and isovaleric, valeric and caproic acid (All P < 0·05). The content of SCFA between cases and controls was visually displayed using principal component analysis (Fig. 3).
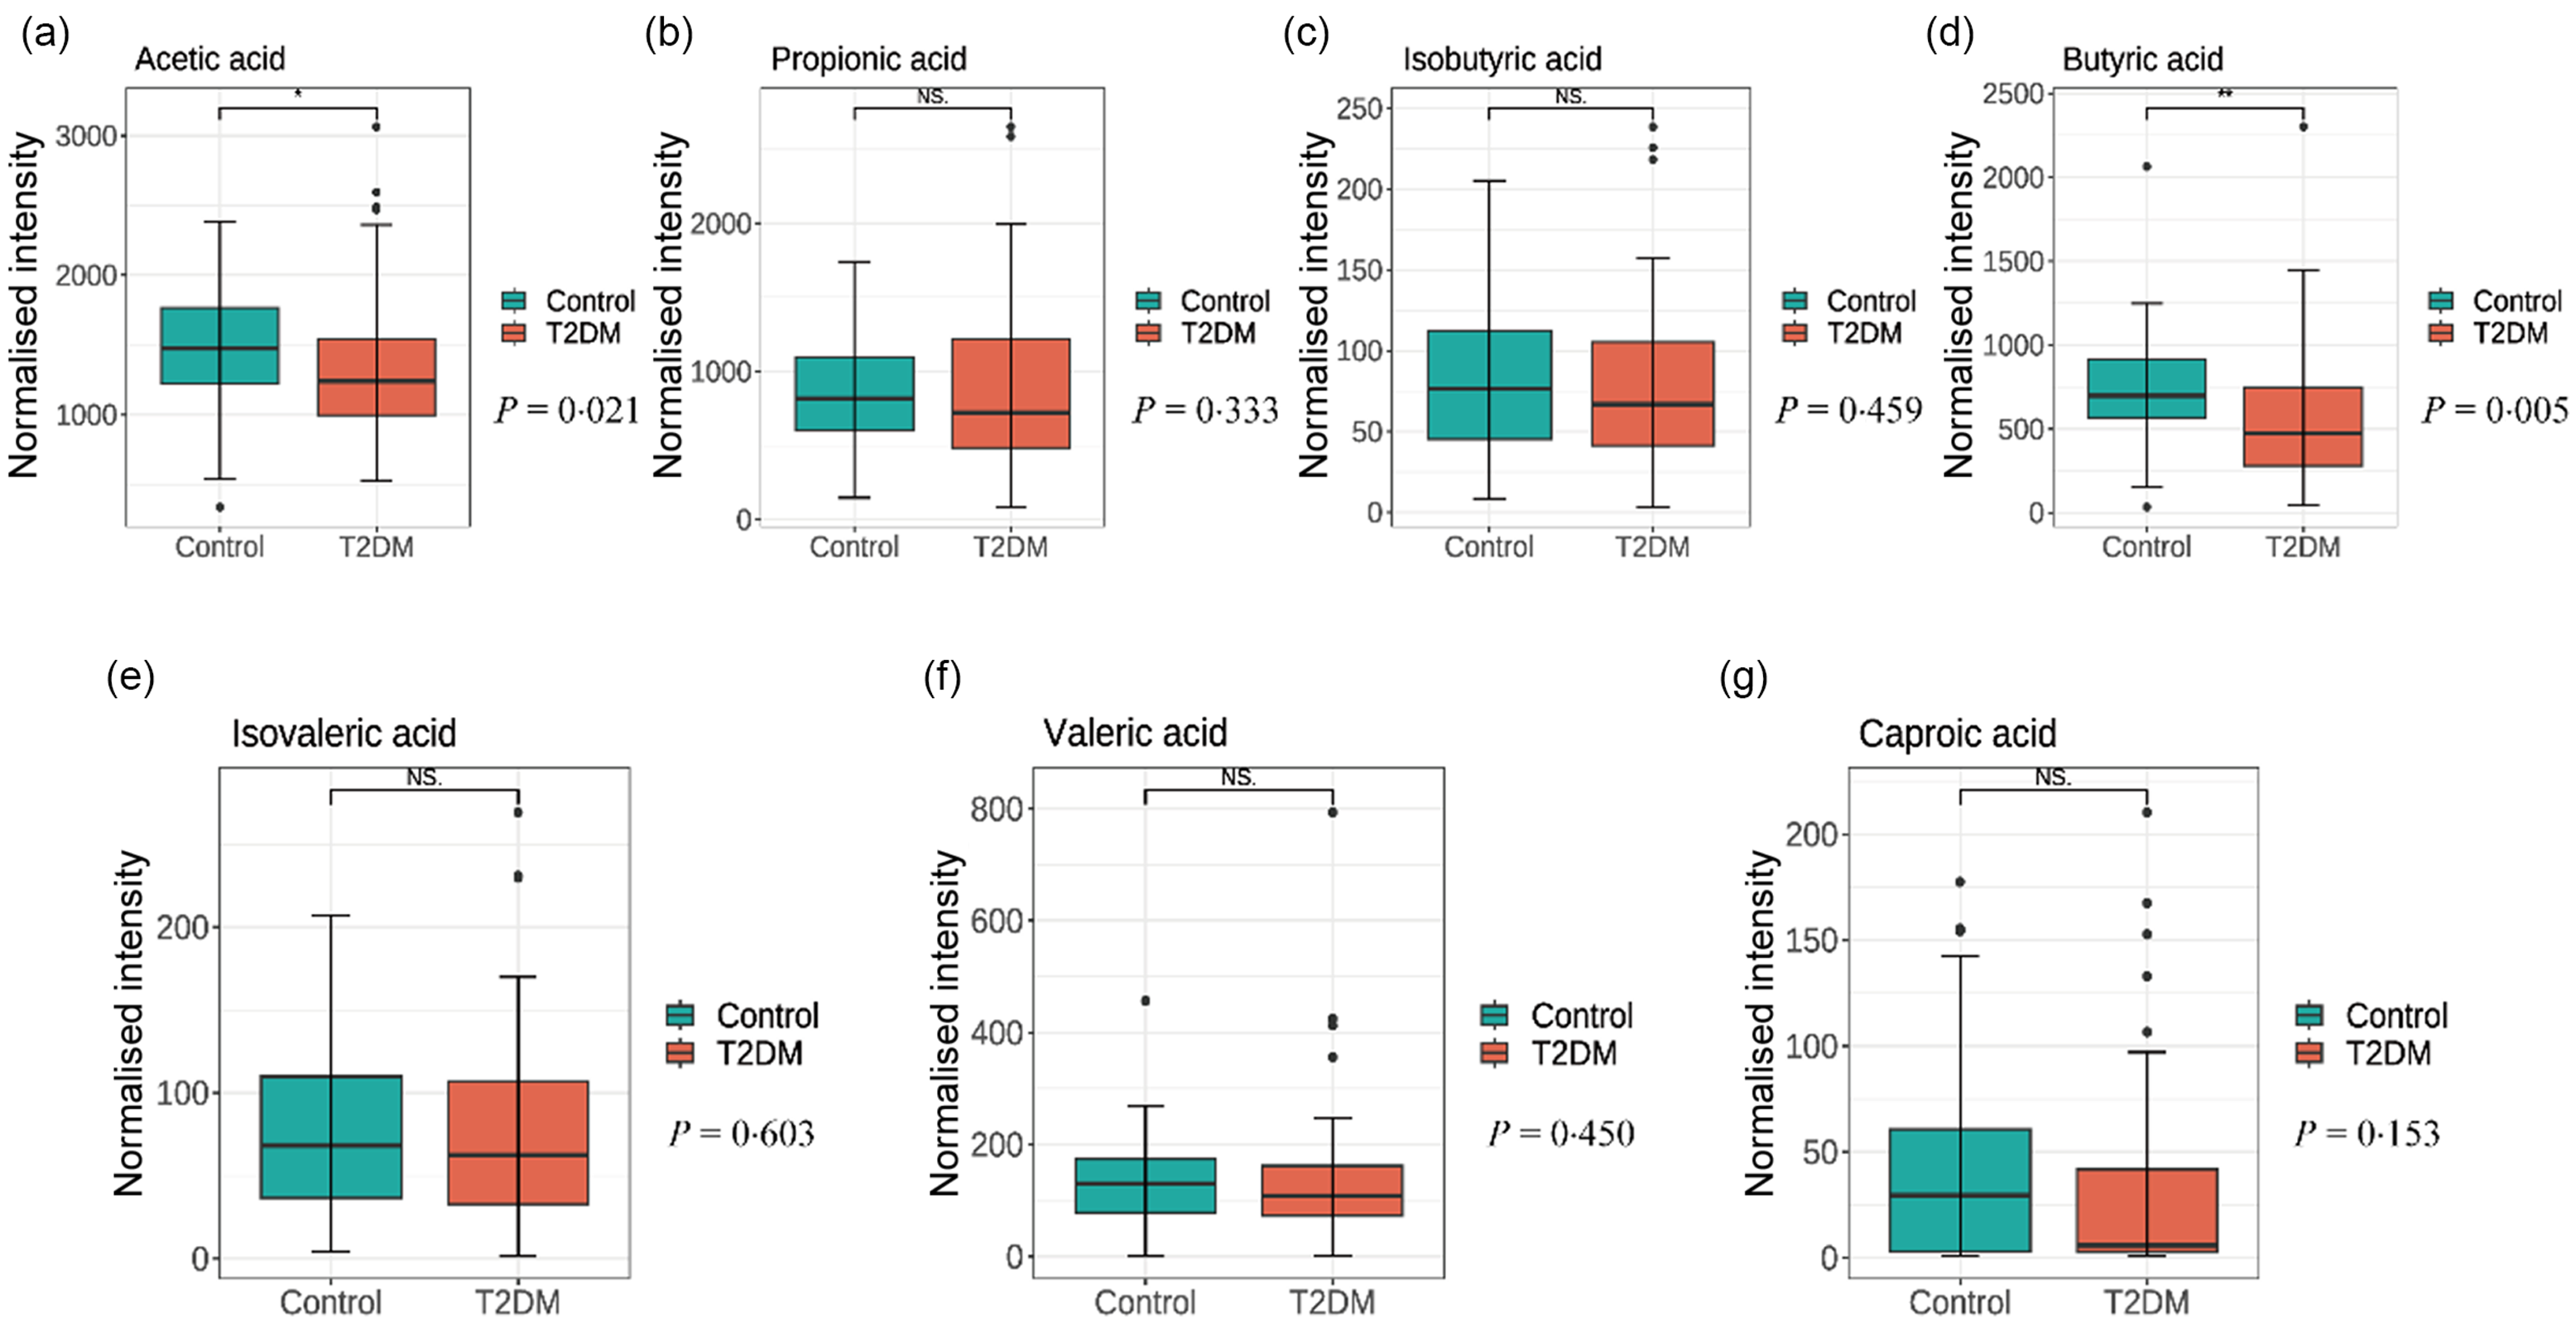
Fig. 1. Comparison of metabolite short-chain fatty acid levels (a) acetic acid, (b) propionic acid, (c) isobutyric acid, (d) butyric acid, (e) isovaleric acid, (f) valeric acid, (g) caproic acid) in the stool of T2DM and controls. T2DM, type 2 diabetes mellitus.
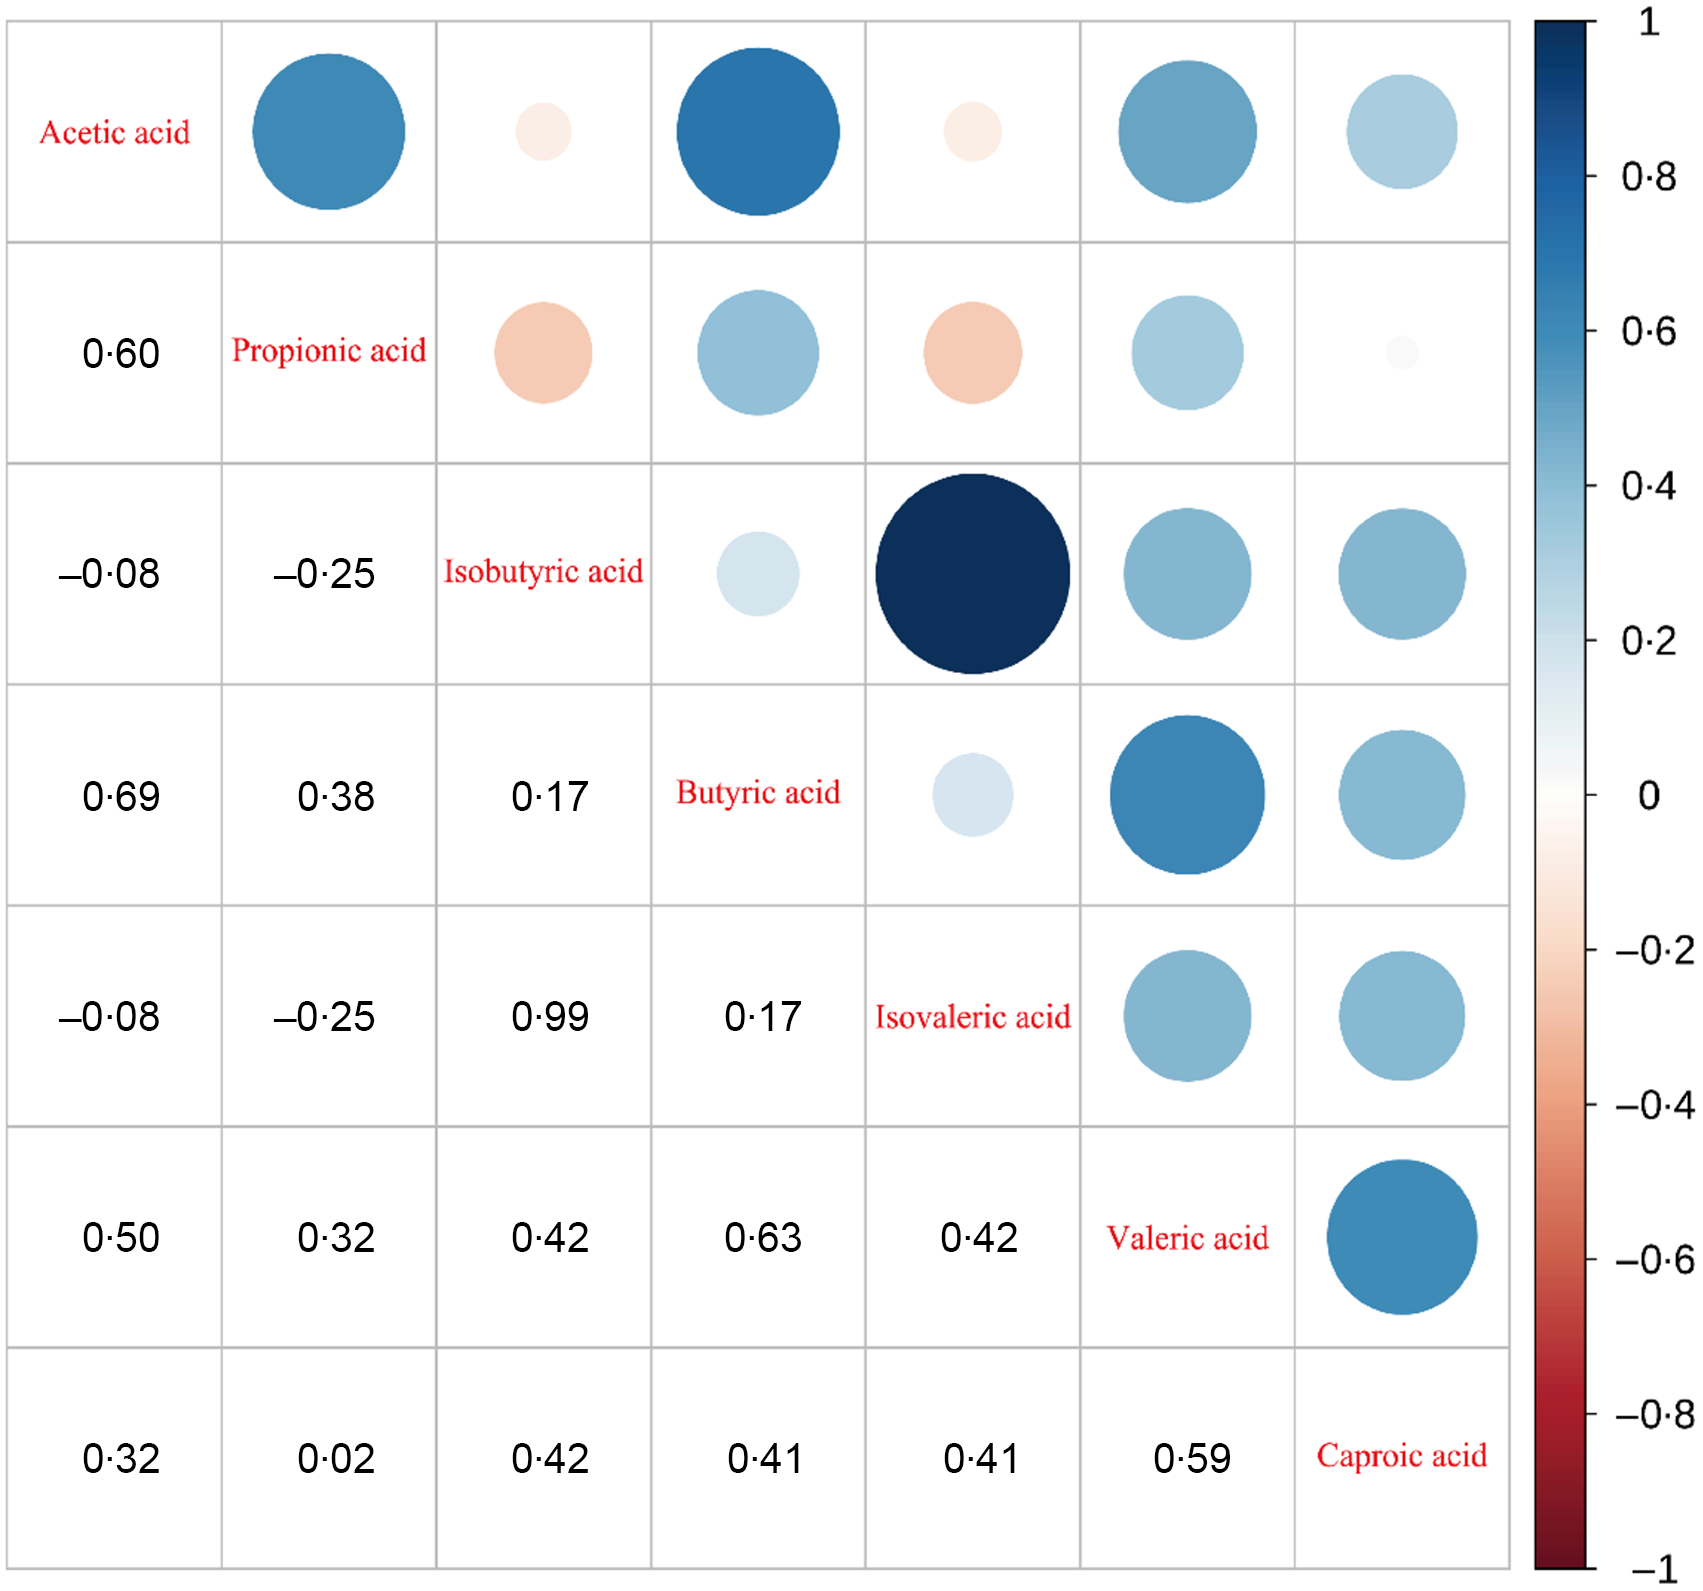
Fig. 2. Heat map of the correlation between metabolite SCFA in the stool. SCFS, short-chain fatty acids.
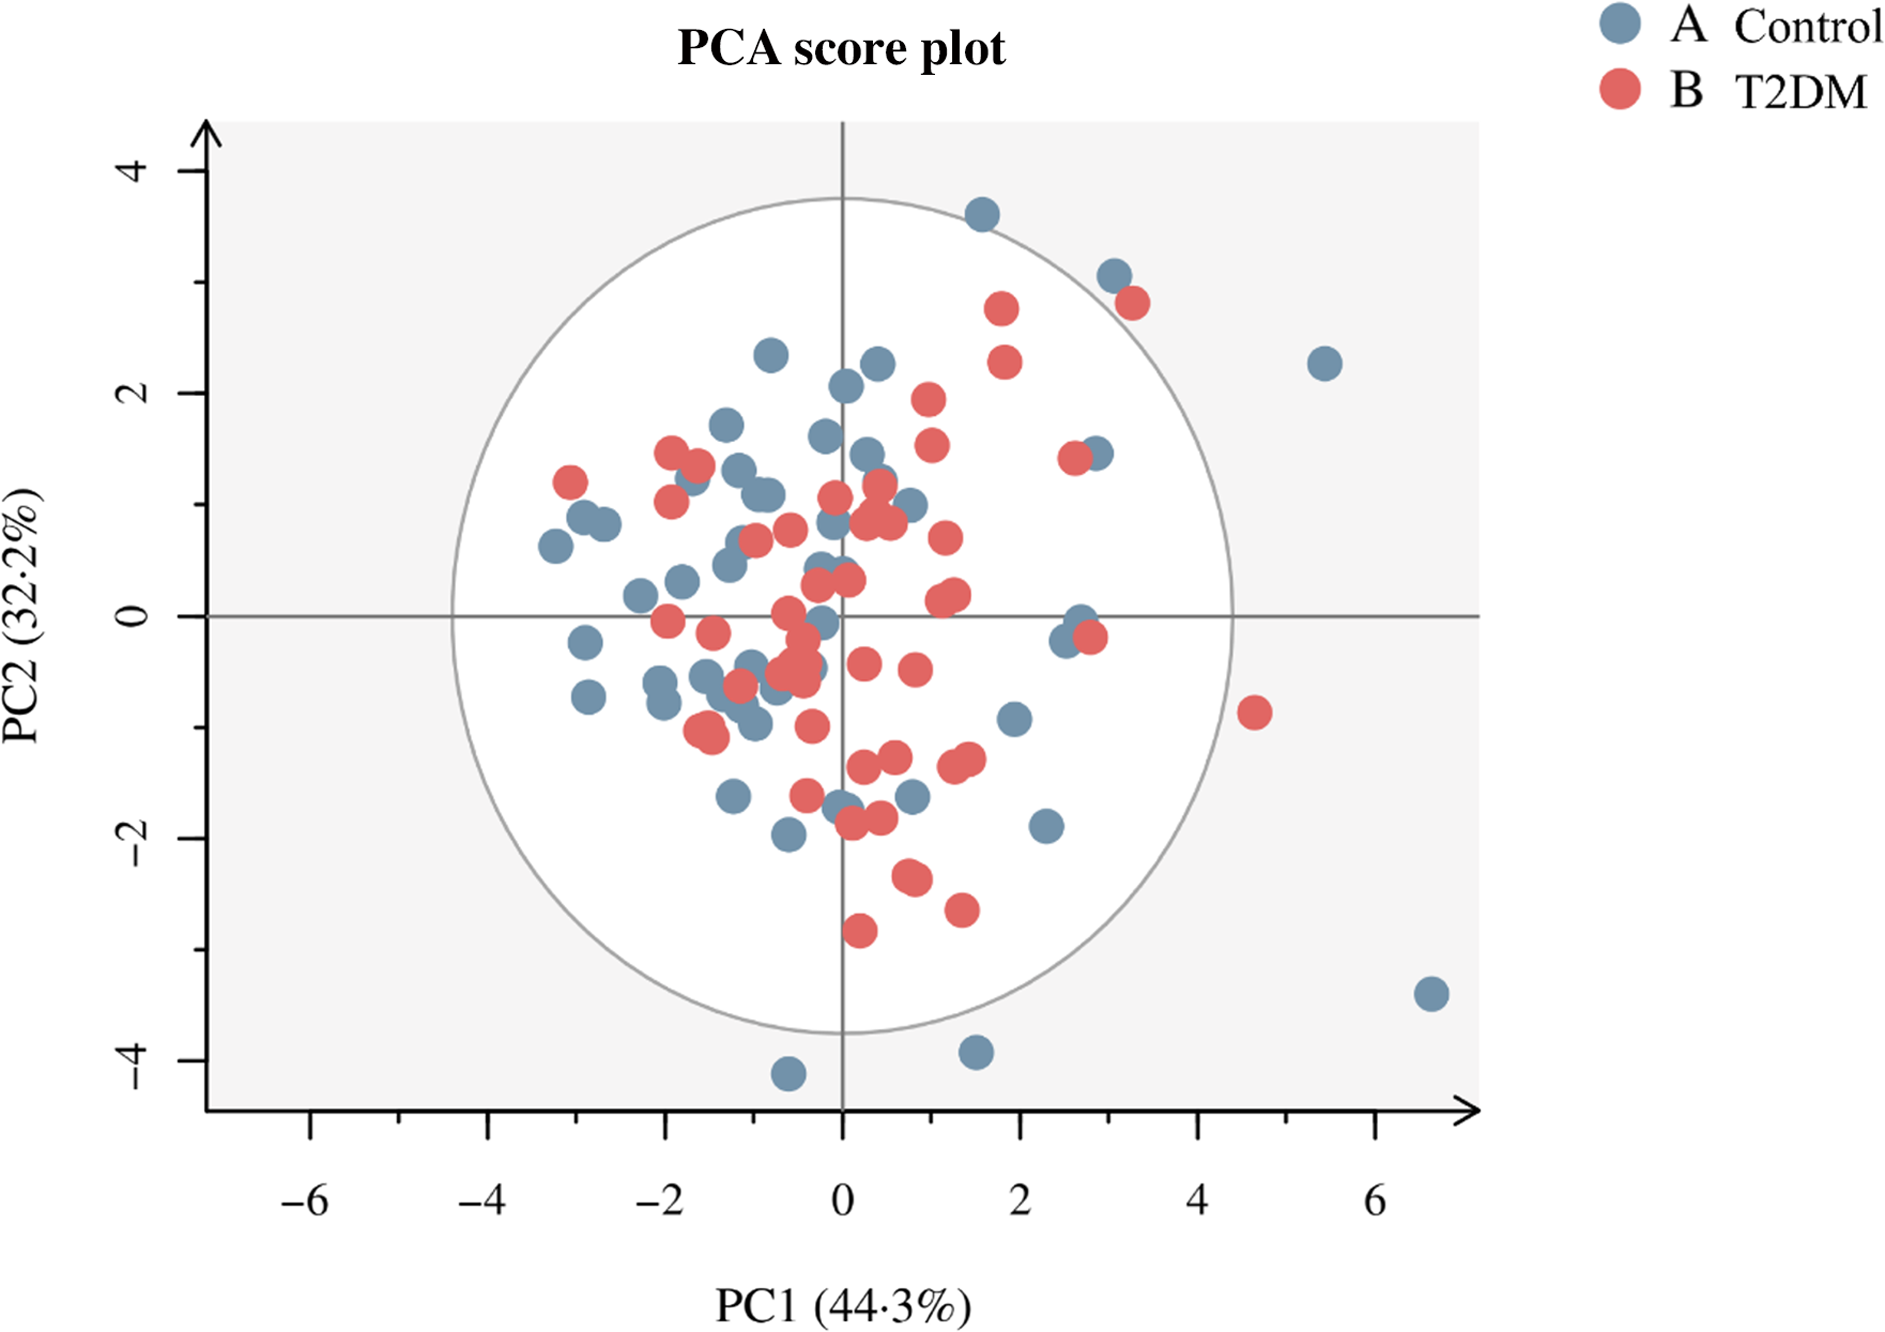
Fig. 3. Principal coordinate score plot illustrating the grouping pattern of individual SCFA in T2DM and control groups. SCFS, short-chain fatty acids.
Association of short-chain fatty acid levels, Alternate Healthy Eating Index 2010 scores with type 2 diabetes mellitus biomarkers and type 2 diabetes mellitus
The relationships between the levels of each SCFA and T2DM biomarkers are presented in Fig. 4. The results found that acetic acid was significantly negatively correlated with FPG (r = −0·24), HbA1c (r = −0·32) and GHB (r = −0·34) but significantly positively correlated with HOMA2-β (r = 0·21). Propionic acid was significantly negatively correlated with HbA1c (r = −0·24) and GHB (r = −0·23), while butyric acid was significantly negatively correlated with FPG (r = −0·25), HbA1c (r = −0·30) and GHB (r = −0·30), but significantly positively correlated with HOMA2-β (r = 0·25) (All P < 0·05). Multiple linear regression analysed the association of SCFA with FPG and HOMA2-β levels (online Supplementary Table 2 and 3). The results show no substantial association between propionic, isobutyric, isovaleric, valeric and capric acid levels and FPG and HOMA2-β levels (P > 0·05). After adjusting for potential confounding variables in model 3, the β (95 % CI) for the highest acetic acid level group and FPG was −2·130 (–3·588, −0·673). The β (95 % CI) for the highest acetic acid level group with HOMA2-β was 34·647 (9·574, 59·720), and the β (95 % CI) for the highest butyric acid level group with HOMA2-β was 27·225 (2·401, 52·050).

Fig. 4. Heat map of Spearman’s correlation between SCFA levels and biomarkers of type 2 diabetes. SCFS, short-chain fatty acids.
Table 2 demonstrates the association of SCFA with T2DM. No substantial correlation was observed between propionic, isobutyric, Isovaleric, valeric and capric acid levels and T2DM risk (P > 0·05). On the contrary, compared with participants with the lowest levels of acetic acid and butyric acid, after adjusting for multiple confounders (including age, WC, TAG, gender, level of education, income, smoking, drinking, physical activity, BMI, total energy, cholesterol as well as protein) in model 3 (OR (95 % CI) of 0·099(0·022, 0·441), 0·210 (0·057, 0·774) respectively), the risk of T2DM was reduced by 90·1 %, 79·0 %, respectively. In addition, compared with participants with the lowest AHEI-2010 dietary scores, after adjusting for multiple confounders in Model 3 (OR: 0·196; 95 % CI: 0·059, 0·646), the risk of T2DM was reduced by 84·1 % (online Supplementary Table 4). In the meantime, an apparent non-linear association between acetic (P non-line-association = 0·022) and butyric acid (P non-line-association = 0·041) level and T2DM risk is illustrated in the restricted cubic spline (Fig. 5). Participants with acetic acid levels > 1330·106μg/g or butyric acid levels > 585·031μg/g had a lower risk of T2DM.
Table 2. Association of short-chain fatty acid levels with T2DM

T2DM, type 2 diabetes mellitus.
Model 1: no adjustment.
Model 2: adjusted for age, WC, TAG, gender, level of education, income, smoking, drinking and physical activity.
Model 3: model2 + BMI, total energy, cholesterol and protein.
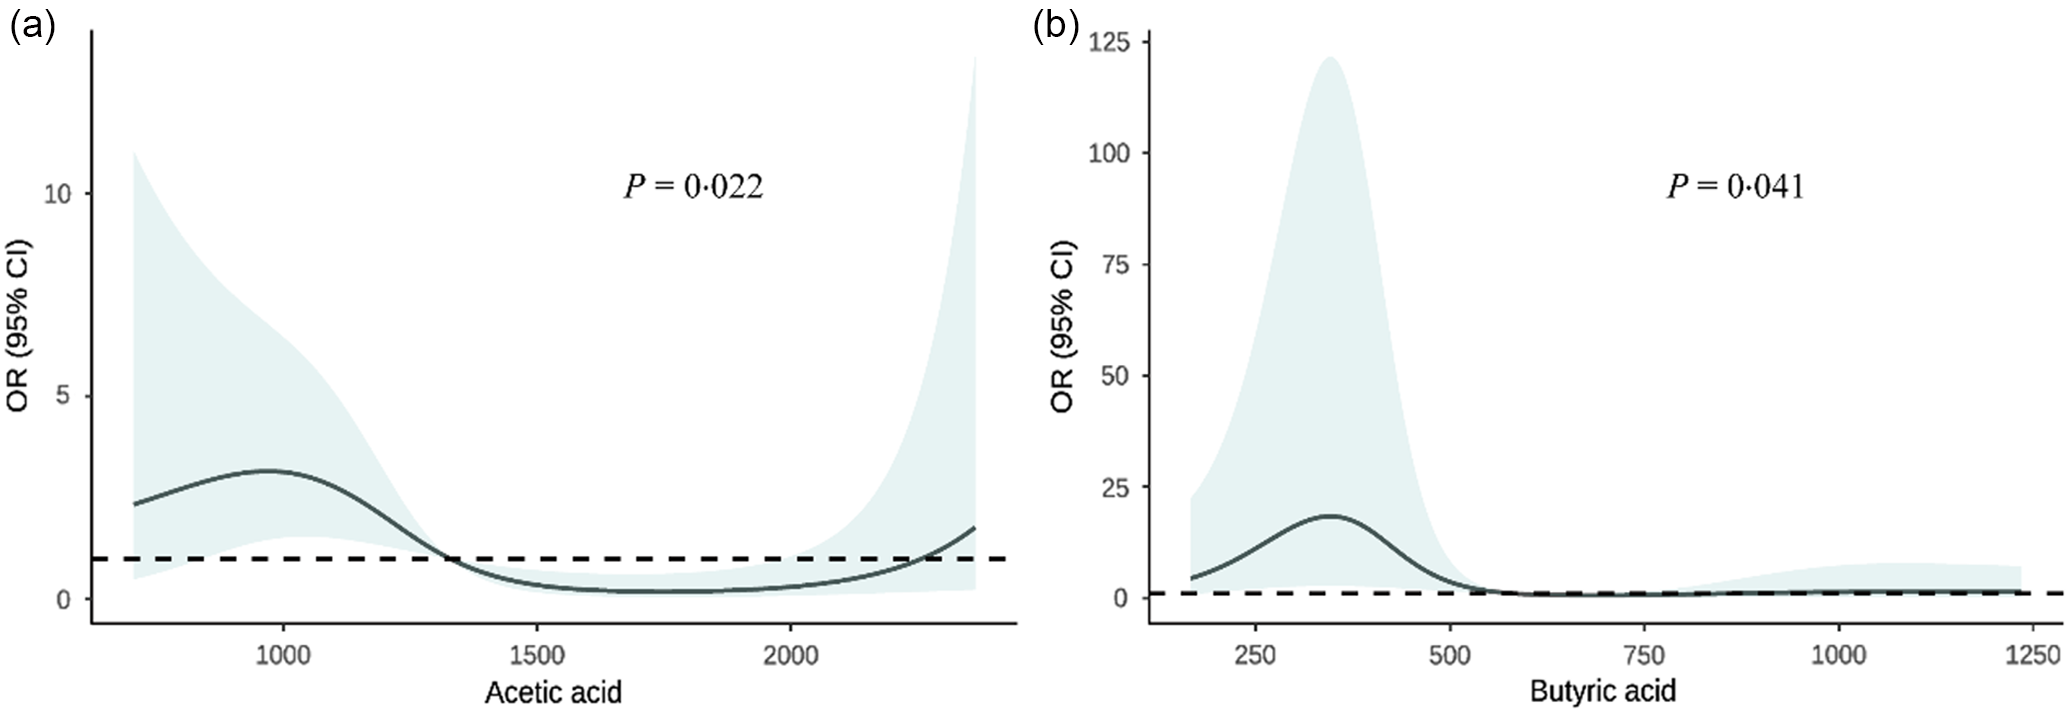
Fig. 5. Association of fecal short-chain fatty acid levels with type 2 diabetes. The model was adjusted for age, WC, TAG, gender, level of education, income, smoking, drinking, physical activity, BMI, total energy, cholesterol and protein. WC, waist circumference.
Combined effects of short-chain fatty acids levels and Alternate Healthy Eating Index 2010 scores on type 2 diabetes mellitus
The combined effect of fecal SCFA levels and diet quality scores on the risk of T2DM is presented in Table 3. Higher levels of acetic and butyric acid concentrations were negatively associated with the risk of T2DM in participants with higher diet quality scores compared with those with lower diet quality scores, with OR and 95 % CI, respectively, 0·007 (0·001, 0·148), 0·005 (0·001, 0·120) (P < 0·05). It implies that the negative effects of acetate and butyric acid with T2DM are influenced and modulated by the quality of the diet. Furthermore, no multiplicative or additive interactions were observed between the AHEI-2010 dietary score and acetate or butyric acid levels on T2DM (All P > 0·05). The interaction of fecal levels of each SCFA (acetic acid, butyric acid) and dietary quality score RERI (95 % CI) on the additive scale were 0·564 (–0·286, 1·415), 0·452 (–0·563, 1·466). The multiplicative scales OR (95 % CI) were 0·329 (0·030, 2·867) and 0·339 (0·027, 3·110).
Table 3. The combined effect of fecal SCFA levels and AHEI-2010 diet score on the risk of T2DM

SCFA, short-chain fatty acid; T2DM, type 2 diabetes mellitus.
The model was adjusted for age, WC, TAG, gender, level of education, income, smoking, drinking, physical activity, BMI, total energy, cholesterol and protein.
Discussion
To the best of our knowledge, this is the first case–control study to detect individual fecal SCFA types in rural China and to correlate changes in intestinal micro-metabolites with dietary quality. We discovered higher levels of acetate and butyric acid exhibited a negative association with the risk of T2DM, demonstrating a non-linear dose–response relationship. In addition, higher AHEI-2010 scores and fecal levels of acetic and butyric acid may collectively contribute to a positive impact on mitigating the risk of T2DM.
In this study, we observed lower acetic acid and butyrate levels in T2DM participants, corroborating the findings of prior investigations(Reference Maldonado-Contreras, Noel and Ward11,Reference Wu, Tremaroli and Schmidt29,Reference Zhao, Lou and Peng30) that reported a decrease in total SCFA levels and acetic acid or butyrate levels in T2DM and pre-diabetes. Additionally, the correlation analyses also revealed that acetic acid was negatively associated with FPG, GHB and HbA1c, and propionic acid demonstrated negative associations with HbA1c and GHB. Conversely, it showed negative associations with FPG, GHB and HbA1c, but a positive association with HOMA2-β, aligning with the results from studies by Mueller NT and Valdes DS(Reference Mueller, Differding and Zhang31,Reference Sanna, van Zuydam and Mahajan32) , suggesting that increased circulating SCFA and acetate levels or butyrate production can reduce fasting insulin concentrations or be associated with an improved insulin response, despite differences in ethnicity, geographical location and dietary habits. Moreover, it has been reported that dietary fibre, while significantly increasing the relative abundance of total SCFA and glycated Hb, had no significant effect on fasting glucose, Homeostatic Model Assessment for Insulin Resistance (HOMA-IR), acetic acid, propionic acid, butyric acid and adverse events(Reference Ojo, Feng and Ojo33). Notably, our observation of the correlation between the SCFA profile and a reduced T2DM risk aligns with the conclusions drawn in multiple previous studies(Reference Wu, Tremaroli and Schmidt29,Reference Zhao, Lou and Peng30) . While longitudinal cohort studies in USA men have highlighted the interaction of diet and GM to produce potentially bioactive metabolites that in turn modulate health in chronic metabolic diseases(Reference Li, Li and Ivey34), anthropometric and metabolic improvements in T2DM patients were not associated with changes in microbial diversity or SCFA concentrations in an Okinawan-based Nordic diet population(Reference Huang, Nilholm and Roth35). This contradicts our results and may be due to differences in diet structure and gut microbes among populations in different geographical regions. Furthermore, our study found a significantly lower risk of T2DM at higher levels of acetic acid and butyric acid with a nonlinear dose–response relationship, which is consistent with Valdes DS’s population studies that dietary acetic acid supplementation has the potential to reduce plasma TAG and FBG concentrations in patients with T2D(Reference Valdes, So and Gill36).
Moreover, our finding of a negative association between higher AHEI-2010 diet quality scores and risk of T2DM confirms previous findings(Reference Chiuve, Fung and Rimm26,Reference Yu, Zhang and Xiang37,Reference Merino, Guasch-Ferré and Li38) . The higher Global Diet Quality Score was inversely associated with T2DM risk in USA women of reproductive age or older(Reference Fung, Li and Bhupathiraju39). Furthermore, higher fruit intake-associated metabolic alteration was associated with a lower risk of T2DM in the Guangzhou Nutrition and Health Study (GNHS)(Reference Jiang, Sun and He40). In Chinese adults, long-term diet quality positively correlates with microbiota diversity(Reference Yu, Nguyen and Yang41), which may mediate or modify diet–disease relations. These studies explain the relationship between dietary quality and the risk of T2DM, which can be influenced to some extent by SCFA. In addition, review and meta-analyses assessing the relationship between dietary patterns and the risk of T2DM in adults highlighting healthy dietary quality that may be beneficial for the primary prevention of T2DM(Reference Qian, Liu and Hu42,Reference Schwingshackl, Bogensberger and Hoffmann43) , which is consistent with the higher AHEI-2010 diet quality scores could reduce risk of T2DM in this study.
Despite lack of evidence regarding the association between diet quality and SCFA levels on the risk of T2DM in population studies, animal studies suggest that Lactobacillus casei CCFM419, as a dietary supplement, modifies T2DM through an altered intestinal flora-SCFA-inflammation/GLP-1 mechanism(Reference Wang, Li and Zhao44). Potentilla discolours Bunge significantly increases the expression levels of acetate and butyric acid and their specific receptors G protein-coupled receptors 41 and 43 in faces, thus playing a role in anti-diabetes and related inflammation(Reference Han, Li and Du9). Consumption of functional meat enriched with carob extract (CFE-RM) induces higher levels of GM, more adequate production of SCFA and improved colonic barrier integrity(Reference Macho-Gonzalez, Garcimartin and Redondo7). Additionally, evidence suggests that microbial and systemic metabolic dysregulation in T2DM rats can be effectively modulated by novel type 3 resistant starch (CE-RS3) and metformin, leading to increased intestinal bacterial diversity and the restoration of SCFA-producing bacteria, ultimately resulting in a significant increase in SCFA levels and symptom relief in T2DM rats(Reference Zhang, Ma and Wu45). Consumption of polyphenols or polyphenol-rich foods can increase the number of Aspergillus and microorganisms and decrease the production SCFA by bacteria by affecting the intestinal microbiota(Reference Li, Sui and Xie46). These studies are consistent with the association between dietary composition and quality in the present study in influencing the risk of SCFA and T2DM to some extent.
Currently, the existing studies indicate that the mechanism of the association between SCFA and the risk of T2DM is explained by the degradation of dietary fibre components by intestinal microorganisms to produce SCFA(Reference Canfora, Hermes and Müller47). SCFA regulate the expression of cytokines, steroids and chemokines by acting on macrophages and endothelial cells. High levels of microbial-derived SCFA then help maintain homoeostasis by downregulating pro-inflammatory effectors and promoting a hyporeactive immune environment against commensal bacteria(Reference Cronin, Joyce and O’Toole48). SCFA may also influence weight control by affecting energy intake and energy expenditure, insulin sensitivity and systemic hypotension, thus playing a role in the pathophysiology of obesity and related diseases, such as T2DM(Reference Cronin, Joyce and O’Toole48,Reference Canfora, Jocken and Blaak49) . While our study has explored the relationship between SCFA and the risk of T2DM in the population, further research is needed on the molecular mechanisms.
Our study has several strengths. First, our research is the first comprehensive study to detect individual fecal SCFA types in rural China and to correlate changes in intestinal micro-metabolites with dietary quality in participants to explore their combined effects on T2DM. Second, the patients with T2DM included in this study were newly diabetic, avoiding memory bias and changes in dietary habits due to the disease. However, it is crucial to acknowledge potential limitations when interpreting the results. First, the present study is a case–control design and cannot yield a precise causal relationship between SCFA and the disease process of T2DM. Second, although this study has controlled for a large number of important covariates, there are still potential confounders that were not identified. Third, the subjects in this study were from a rural area of a Chinese province, which makes the study results potentially inapplicable to other populations. Finally, this study only explored the effects of diet quality and the intestinal flora metabolite SCFA on patients with T2DM without addressing other factors, such as lifestyle and socio-economic conditions. Therefore, large-scale longitudinal and interventional studies that fully consider lifestyle, dietary habits, socio-economic and other factors that may influence the GM are needed to elucidate the relationship between SCFA, lifestyle factors and T2DM.
Conclusions
In summary, acetate and butyrate levels may be important modifiable beneficial factors affecting T2DM in rural China. Higher AHEI-2010 scores and fecal levels of acetic and butyric acid may positively joint affect the reduced risk of T2DM. Improving dietary quality for body metabolism balance should be encouraged to promote good health.
Acknowledgements
The authors thank all of the participants, coordinators and administrators for their support and help during the research.
This study was supported by the Key Research and Development Program and Promotion project in Henan Province (grant no: 222102310268) and the Scientific Research Funding Program of Henan Province for overseas students.
J. L. and L. L. conceived the study and designed the research. J. L. performed all data analyses and wrote the paper. L. L. and J. L. checked all the statistical analyses and interpreted the results. J. L., Y. L., S. Z., C. W., Z. M., W. H., T. Y., Y. L. and W. X. wrote and revised the paper. All authors have read and agreed to the published version of the manuscript.
This study was conducted according to the guidelines laid down in the Declaration of Helsinki, and all procedures involving human subjects were approved by the Life Sciences Ethics Committee of Zhengzhou University ((2015) MEC (S128)). Written informed consent was obtained from all subjects.
There are no conflicts of interest.
Supplementary material
For supplementary material/s referred to in this article, please visit https://doi.org/10.1017/S0007114524000400


