INTRODUCTION
Maximizing plant yield potential in any given environment requires optimizing the use of water, nutrients and radiation, and avoiding negative effects from any type of stress during the vegetative and grain-filling periods. This can only be achieved by growing varieties with a flowering time and life-cycle duration suited to the environmental conditions. In wheat, flowering time is a critical stage as it defines the duration of spike formation and therefore the allocation of resources to seed production, and marks the beginning of the grain-filling period. The trade-off between resource allocation and stress avoidance is also of primary importance: for example, brief episodes of high temperature (>32–36 °C) coinciding with a critical period of only 1–3 days around wheat anthesis can greatly reduce seed set and yield (Wheeler et al. Reference Wheeler, Craufurd, Ellis, Porter and Vara Prasad2000). Therefore, setting the optimum flowering time for a target environment is essential, not only to enhance grain yield but also to permit full expression of end-use quality genetic potential. Manipulation of flowering time has always been a major objective in wheat breeding programmes. Understanding its underlying genetic control and the environmental effect on its expression is crucial to fine-tune phenology for a particular set of environmental conditions for optimum and stable performance.
Wheat flowering time is controlled mainly by three groups of loci, two of which interact with environmental factors, namely photoperiod sensitivity genes (Ppd) and vernalization requirement genes (Vrn) (Distelfeld et al. Reference Distelfeld, Li and Dubcovsky2009). The third group of loci, controlling ‘narrow-sense earliness’ or ‘earliness per se’ (Eps), act on the developmental rate independently of vernalization and photoperiod (Scarth & Law Reference Scarth and Law1984).
Vernalization is the acquisition or acceleration of a plant's ability to flower by exposure to cold (Chouard Reference Chouard1960). According to the vernalization requirements, wheat is classified as having a winter or spring growth habit. Winter wheat has a considerable vernalization requirement but spring wheat may be insensitive or only partly sensitive to vernalization. Vernalization requirement is mainly controlled by the Vrn-1 genes. Durum wheat contains a homologous copy of Vrn-1, designated Vrn-A1 and Vrn-B1 and located on the long arms of chromosomes 5A and 5B, respectively (Yan et al. Reference Yan, Helguera, Kato, Fukuyama, Sherman and Dubcovsky2004; Fu et al. Reference Fu, Szűcs, Yan, Helguera, Skinner, Von Zitzewitz, Hayes and Dubcovsky2005). As compared with hexaploid wheat, the major elite durum wheat gene pools show no major vernalization requirements (spring wheat), while functionally variant alleles are present at main loci for the photoperiod-sensitive response (Clarke et al. Reference Clarke, DePauw and Thiessen1998).
Photoperiod-sensitive wheat is stimulated to flower only on exposure to long-days, provided that any requirement for vernalization is met, and flowering is delayed under short days. In spring-habit wheat, photoperiod-sensitive types cannot be grown as an overwinter crop in tropical or low-latitude areas, since the day length requirement would not be satisfied in a short enough time-frame to produce a commercially viable crop (Worland & Snape Reference Worland, Snape, Bonjean and Angus2001). Photoperiod-insensitive wheat flowers independently of day length and can be grown to maturity in long- or short-day environments. This is a particular advantage in warm and dry climates, as early flowering varieties are able to fill the grain prior to the onset of the high temperatures and drought stress that occur late in the season (Worland & Snape Reference Worland, Snape, Bonjean and Angus2001). Photoperiod sensitivity in durum wheat is determined at the Ppd-A1 and Ppd-B1 loci, located on chromosomes 2AS and 2BS, respectively (Laurie Reference Laurie1997).
The intensive selection for photoperiod insensitivity in modern wheat was an important factor in the success of the ‘Green Revolution’ cultivars with the ‘shuttle-breeding’ strategy (selecting plants in segregating populations shuttling generations between two highly contrasting environments but both of short cycle duration), resulting in the selection of early types, most of them with little to no photoperiod sensitivity, with adaptation to a broad range of temperate agricultural environments. This allowed the Mexican semi-dwarf wheat to spread to millions of hectares around the world (Borlaug Reference Borlaug, Rajaram and Hettel1995). First implemented by Norman Borlaug, this shuttle-breeding approach still represents the cornerstone of the wide-adaptation breeding strategy used by the International Maize and Wheat Improvement Centre (CIMMYT) in Mexico. Yield advantages resulting from photoperiod insensitivity have been estimated at over 35% in Southern European environments and 15% in Central Europe (Worland Reference Worland1996). The effects of breeding on flowering time of durum wheat during the 20th century have been described in Spain, where a reduction of 8 days from sowing to flowering was estimated (Álvaro et al. Reference Álvaro, Isidro, Villegas, García Del Moral and Royo2008), and in Italy, where the reduction was 2 days (Álvaro et al. Reference Álvaro, Isidro, Villegas, García Del Moral and Royo2008), and the rate of flowering time has been reported to advance 5 °C per year (Motzo & Giunta Reference Motzo and Giunta2007). Flowering dates vary widely among durum wheat landraces, according to their area of origin. A recent study demonstrated that the number of days to heading and flowering of Mediterranean landraces increased steadily from the warmest and driest zone of origin to the coldest and wettest one (Royo et al. Reference Royo, Nazco and Villegas2014).
Photoperiod insensitivity in durum wheat results from mutations in the Ppd-1 genes on the A or B genomes. By convention, alleles conferring photoperiod insensitivity are assigned by an ‘a’ suffix (e.g. Ppd-A1a, McIntosh et al. Reference McIntosh, Yamazaki, Devos, Dubcovsky, Rogers and Appels2003), while wild-type alleles are given a ‘b’ suffix. The basis and degrees of photoperiod insensitivity have been insufficiently characterized in durum wheat. Wilhelm et al. (Reference Wilhelm, Turner and Laurie2009) found two large deletions within the Ppd-A1 gene in durum wheat (1027 and 1117 base pair (bp) deletion designated as alleles ‘GS-100’ and ‘GS-105, respectively), which remove a common region from the wild-type sequence. The presence of either deletion accelerated flowering, which led to the conclusion that these deletions are the likely causal basis of photoperiod insensitivity in tetraploid wheat (Wilhelm et al. Reference Wilhelm, Turner and Laurie2009). A quantitative trait locus (QTL) associated with Ppd-A1a significantly reducing heading date was detected by Maccaferri et al. (Reference Maccaferri, Sanguineti, Corneti, Ortega, Araus, Ben Salem, Bort, DeAmbrogio, Garcia Del Moral, Demontis, El-Ahmed, Maalouf, Machlab, Martos, Moragues, Motawaj, Nachit, Nserallah, Ouabbou, Royo, Slama and Tuberosa2008) in a recombinant inbred line population derived from the cross ‘Kofa’ (‘GS-100’ allele) × ‘Svevo’ (‘GS-105’ allele), suggesting that these alleles decrease photoperiod sensitivity to different degrees. As both mutations are predominant in modern durum wheat but absent from wild tetraploid wheat, it has been suggested that the Ppd-A1 insensitive alleles arose by mutation during domestication (Bentley et al. Reference Bentley, Turner, Gosman, Leigh, Maccaferri, Dreisigacker, Greenland and Laurie2011). The Ppd-B1 locus was originally mapped by Hanocq et al. (Reference Hanocq, Niarquin, Heumez, Rousset and Le Gouis2004) and Mohler et al. (Reference Mohler, Lukman, Ortiz-Islas, William, Worland, Van Beem and Wenzel2004) in bread wheat and was confirmed by Maccaferri et al. (Reference Maccaferri, Sanguineti, Corneti, Ortega, Araus, Ben Salem, Bort, DeAmbrogio, Garcia Del Moral, Demontis, El-Ahmed, Maalouf, Machlab, Martos, Moragues, Motawaj, Nachit, Nserallah, Ouabbou, Royo, Slama and Tuberosa2008) in durum wheat. Beales et al. (Reference Beales, Turner, Griffiths, Snape and Laurie2007) found several polymorphisms within Ppd-B1 genes of hexaploid wheat, including five single-nucleotide polymorphisms (SNPs) and a retrotransposon insertion. However, none corresponded to photoperiodic response, implying that the critical mutation causing the allelic difference of the Ppd-B1 gene has not been found. Diaz et al. (Reference Diaz, Zikhali, Turner, Isaac and Laurie2012) found the changes in flowering time to be associated with increased copy number and not with specific sequence polymorphism in bread wheat. Nishida et al. (Reference Nishida, Yoshida, Kawakami, Fujita, Long, Akashi, Laurie and Kato2013) reported a novel mutation in the 5′ upstream region of Ppd-B1, suggesting that an allelic series of photoperiod-insensitive mutation exists in hexaploid wheat.
The third component regulating flowering time, Eps, is characterized by a polygenic inheritance, and 20 meta-QTLs associated with it have been identified on chromosomes 1B, 3A, 3B, 4A, 4B, 5B, 6A and 6B (Griffiths et al. Reference Griffiths, Simmonds, Leverington, Wang, Fish, Sayers, Alibert, Orford, Wingen, Herry, Faure, Laurie, Bilham and Snape2009; Kamran et al. Reference Kamran, Iqbal, Navabi, Randhawa, Pozniak and Spaner2013). Although the effects of Eps are considered relatively small, it can cause measurable variations in flowering date independently from the effect of major genes such as Ppd or Vrn (Van Beem et al. Reference Van Beem, Mohler, Lukman, Van Ginkel, William, Crossa and Worland2005).
The objective of the current study was to examine the effect of allelic variants at Ppd-A1 and Ppd-B1 genes on the length of durum wheat developmental periods, namely, emergence to flowering and flowering to physiological maturity, across a wide range of northern temperate latitudes. The relative effect of putative Eps was also evaluated.
MATERIALS AND METHODS
Plant material
Thirty-five spring durum wheat (Triticum turgidum L. var. durum) genotypes were used in the study. Thirty resulted from a divergent selection process within the offspring of crosses between parents with contrasting flowering time. Five late-flowering genotypes (Durabon, Megadur, 2716–25·94·01, 2805–49·94·02, 2905–13·93·04) from the breeding programme of the University of Hohenheim (Germany) were crossed with five early-flowering advanced lines (Sooty_9/Rascon_37, Cado/Boomer_33, Dukem_12/2*Rascon_21, Guanay and Snitan) from the CIMMYT-Mexico programme. The F1, F2 and F3 populations were advanced in bulk at CIMMYT. From each F4 population, an early-flowering and a late-flowering plant were selected in order to capture the maximum range for time to flowering. From generations F5 to F7, selected lines were selfed, purified and increased at the Institute for Food and Agricultural Research and Technology (IRTA) in Spain. At generations F8 and F9, the seed of fixed lines with contrasting flowering dates was used in field experiments. The collection also included two sister lines derived from the cross CF4-JS40/3/Stot//Altar84/Ald, and three well known commercial cultivars with varying flowering dates that were used as controls: Mexa (early-flowering in Mexico and Spain), Simeto (late-flowering in Mexico and medium-to late-flowering in Spain) and Anton (late-flowering in both countries).
Molecular characterization
The selected genotypes were analysed with a set of molecular markers. Leaf tissue from five to ten plants per plot was collected in the field and DNA was extracted using the cetyltrimethyl ammonium bromide modified procedure (Saghai-Maroof et al. Reference Saghai-Maroof, Soliman, Jorgensen and Allard1984) described at http://repository.cimmyt.org/xmlui/handle/10883/3221.
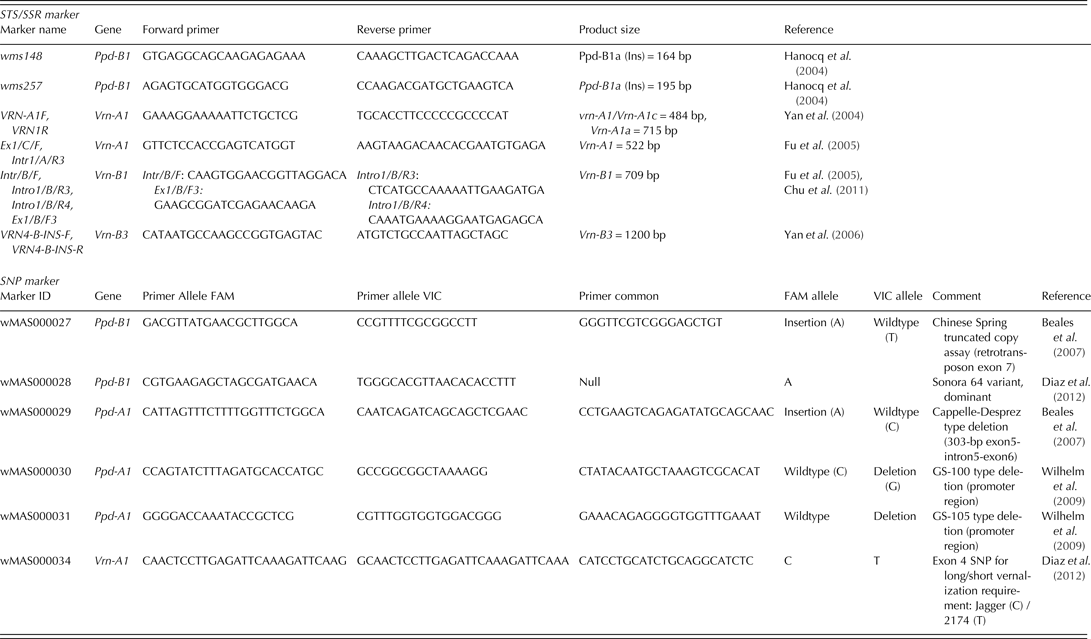
Sequence-tagged sites (STS), simple sequence repeats (SSR) and SNP markers associated with identified polymorphisms in durum wheat were utilized first. Subsequently, additional markers for known bread wheat alleles were tested (Table 2).
The genotypes were initially characterized for the Vrn-1 and Vrn-3 genetic loci (Vrn-A1, Vrn-B1 and Vrn-B3) to determine the spring or winter growth habit. Dominant spring alleles due to variation in the promoter and intron-1 region of the Vrn-A1 locus were identified utilizing the gene-specific STS markers described by Yan et al. (Reference Yan, Helguera, Kato, Fukuyama, Sherman and Dubcovsky2004) and Fu et al. (Reference Fu, Szűcs, Yan, Helguera, Skinner, Von Zitzewitz, Hayes and Dubcovsky2005). In addition, the presence of an SNP was tested for in Exon 4 of Vrn-A1, identified so far only in bread wheat (Diaz et al. Reference Diaz, Zikhali, Turner, Isaac and Laurie2012). Deletion alleles affecting the vernalization response in the intron-1 region of Vrn-B1 and Vrn-B3, respectively, were detected as described in Fu et al. (Reference Fu, Szűcs, Yan, Helguera, Skinner, Von Zitzewitz, Hayes and Dubcovsky2005), Yan et al. (Reference Yan, Fu, Li, Blechl, Tranquilli, Bonafede, Sanchez, Valarik, Yasuda and Dubcovsky2006) and Chu et al. (Reference Chu, Tan, Yu, Zhong, Xu and Yan2011).
For Ppd-A1, two SNP KASP assays were applied to detect the 1027 bp ‘GS-100’ type and 1117 bp ‘GS-105’ type deletions in durum wheat (Wilhelm et al. Reference Wilhelm, Turner and Laurie2009). Furthermore, the genotypes were tested for the presence of the bread wheat 1·2 kb insertion (cvar Chinese Spring was used as a control) and 306 bp deletion (cvar Cappelle-Desprez as a control) at Ppd-A1, respectively (Beales et al. Reference Beales, Turner, Griffiths, Snape and Laurie2007). For Ppd-B1, linked SSR markers gwm148 and gwm257 as described in Hanocq et al. (Reference Hanocq, Niarquin, Heumez, Rousset and Le Gouis2004) were primarily utilized. Gene-specific KASP assays determining truncated copies, transposon-junction and allele specific SNPs observed in cvar ‘Sonora64’ (containing three copies of Ppd-B1), cv. ‘Chinese Spring’ (carrying four copies of Ppd-B1) and cvar ‘Cheyenne’ (carrying one copy of Ppd-B1) were tested to determine whether similar allele variation exists in durum wheat (Diaz et al. Reference Diaz, Zikhali, Turner, Isaac and Laurie2012). Copy number variation of Ppd-B1 alleles could not be identified at the time the genotypic analyses were made. Following Beales et al. (Reference Beales, Turner, Griffiths, Snape and Laurie2007), the photoperiod-insensitive allele was designated as Ppd-1a. The alternative allele, which was assumed to infer some photoperiod sensitivity, was arbitrarily designated Ppd-1b.
The polymerase chain reaction (PCR) assay reaction mixture in single 10 μl reactions used to amplify all primers contained final concentrations of 1 × Buffer with Green Dye (Promega Corp., USA), 200 μM deoxynucleotide triphosphates, 1·2 mM magnesium chloride, 0·25 μM of each primer, 1U of DNA polymerase (GoTaq®Flexi, Promega Corp., Cat. # M8295) and 50 ng of DNA template. The PCR profile was 94 °C for 2 min followed by 30 cycles of 94 °C for 1 min, 54–60 °C for 2 min (dependent on the primer), and 72 °C for 2 min. The amplified products were separated on 1·2% agarose gels in tris-acetate/ethylene-diamine-tetraacetic acid (TAE) buffer. The SNP polymorphisms were scored using Kompetitive Allele Specific PCR (KASP) reagents (http://www.lgcgenomics.com) in reactions containing 2·5 ml water, 2·5 ml 2 × KASPar Reaction mix, 0·07 ml assay mix and 50 ng of dried DNA with a PCR profile of 94 °C for 15 min activation time followed by 20 cycles of 94 °C for 10 s, 57 °C for 5 s and 72 °C for 10 s and followed by 18 cycles of 94 °C for 10 s, 57 °C for 20 s, and 72 °C for 40 s. Fluorescence was read as an end point reading at 25 °C.
Experimental field setup
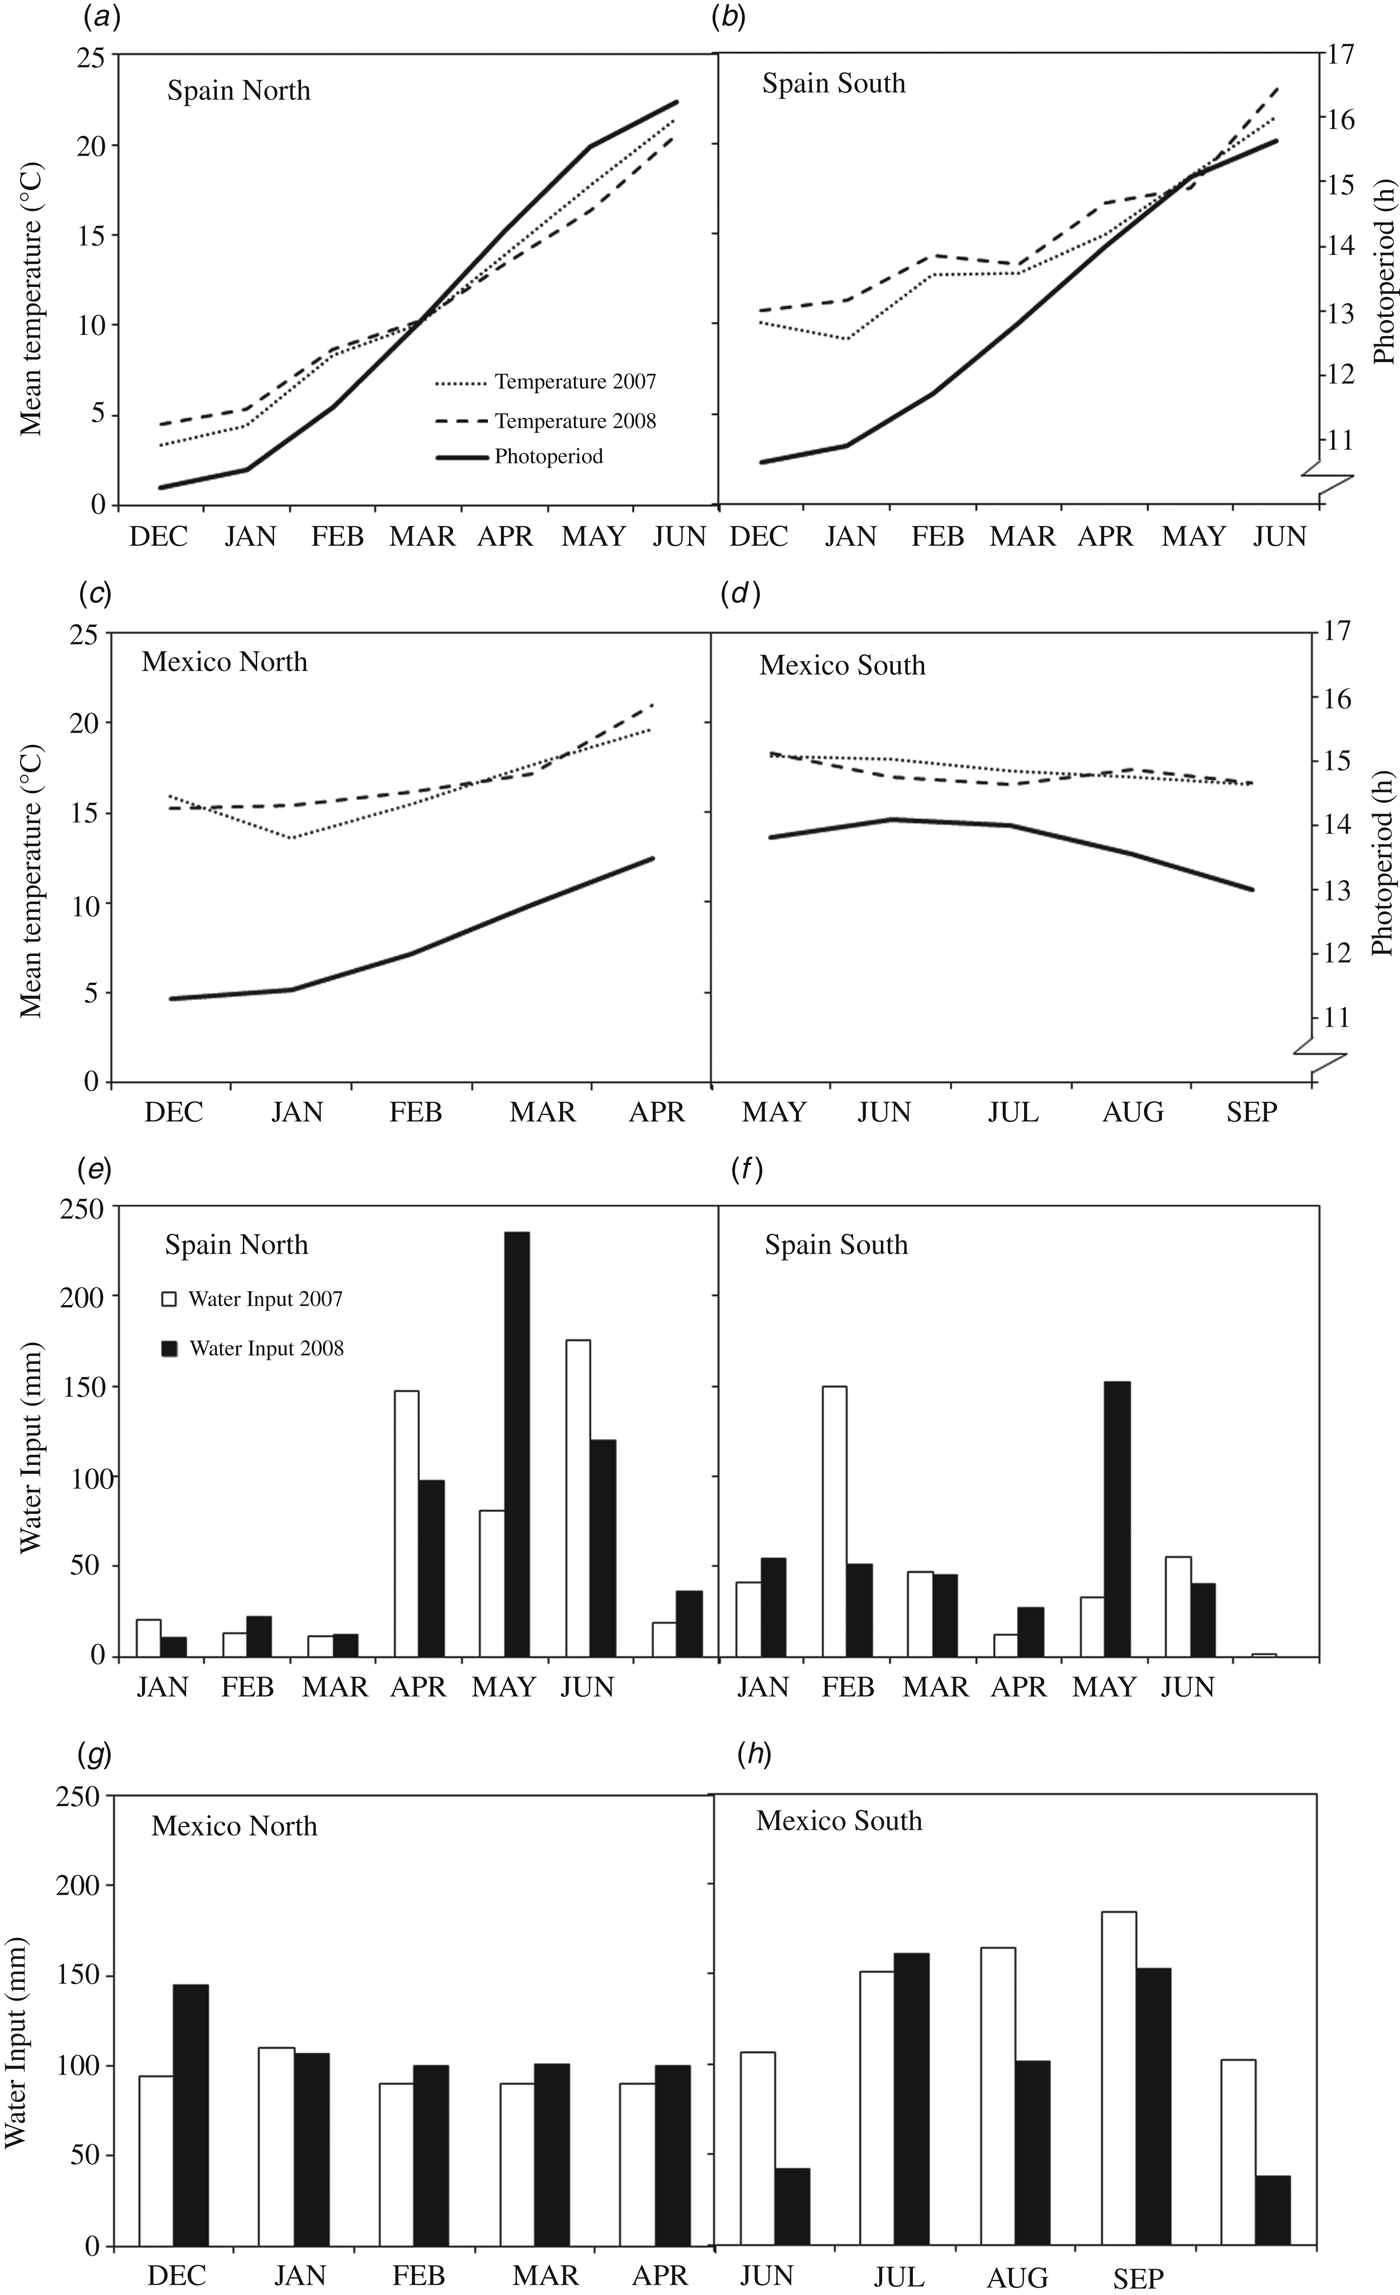
Field experiments were conducted in 2007 and 2008 at two sites in Spain: Lleida in the north (Spain-North 41°38′N), and Jerez de la Frontera in the south (Spain-South 37°0′N), and two locations in Mexico: Ciudad Obregon in the north (Mexico-North 27°21′N) and El Batan (Texcoco) in the Central Mexican Highlands (Mexico-South 19°31′N). The experiments were arranged in randomized complete block designs with three replications and plots of 12 m2. Sowing density was adjusted at each site in order to obtain an approximate plant density of 450 spikes/m2. Plots were managed according to the common cultural practices at each site, and were maintained free of weeds, diseases and pests. Three experiments were planted in autumn (from 19 November to 22 December) and the fourth, the one established in Mexico-South, was planted in spring (from 18 to 28 May) for a summer crop cycle. Irrigation was provided during the whole cycle in the Mexico-North site (full irrigation) and when necessary to avoid water stress (Fig. 1) in the other three, mostly rainfed, sites (Spain-North, Spain-South and Mexico-South).

Fig. 1. Environmental conditions prevailing during the experiments conducted in 2007 and 2008 at two contrasting sites in Spain and Mexico. (a–d): Mean temperatures and photoperiod. (e–h): Water input (rainfall + irrigation).
Data recording
The following developmental stages were determined on the central part of each plot according to the Zadoks scale (Zadoks et al. Reference Zadoks, Chang and Konzak1974): growth stage (GS) 10 (emergence), GS 65 (flowering or anthesis) and GS 87 (physiological maturity, indicated by the loss of green colour in the spike peduncles). A plot was considered to have reached a given developmental stage when at least 50% of the plants exhibited the stage-specific phenotypic characteristics. Daily maximum and minimum temperatures and rainfall were obtained from weather stations located in the experimental fields or at a distance <3 km from them. Photoperiod was calculated with the model proposed by Forsythe et al. (Reference Forsythe, Rykiel, Stahl, Wui and Schoolfield1995), as a function of latitude and Julian day, and including the civil twilight (when the centre of the sun is 6° below the horizon). Accumulated photoperiod (ACP, h) from emergence to flowering and from flowering to maturity was calculated by summing the daily photoperiod during each development period. The effects of Eps on the length of the emergence-flowering period were estimated in South Mexico, assuming that the long photoperiod existing at this site (c. 14 h) saturated photoperiod requirements. Allelic combination GS-100/Ppd-B1a was used as reference as it led to the shortest time to flowering. For each genotype (i) carrying other allelic combinations, Eps was calculated as:
where TFi = time to flowering of genotype i, TFaci = average time to flowering of allelic combination carried by genotype i, and TFI0I = average time to flowering of allelic combination GS-100/Ppd-B1a (I0I).
Statistical analysis
After checking for homogeneity of error variances, analyses of variance were carried out using the GLM procedure of the SAS statistical package (SAS Institute Inc. 2009), with a fixed-factor model. The sum of squares of the genotype and its interactions were partitioned into differences between allelic combinations and differences within each of them. The mean square (MS) of the ‘Between allelic combinations’ effect was tested with the sum of residuals of the analysis of variance (ANOVA) for the ‘within’ effects. Means of the allelic combinations for the two periods, emergence-flowering and flowering-maturity, were compared according to a least significant difference (LSD) test at P < 0·05.
A linear regression model was fitted to the relationship between ACP in the emergence-flowering period and the number of days of the same period. The relationship between the length of the emergence-flowering and flowering-maturity periods was assessed through the calculation of the Pearson correlation coefficients using the mean data of genotypes across environments (n = 34).
RESULTS
Molecular characterization
The molecular characterization (Tables 1 and 2) revealed that all of the 35 genotypes were spring types, carrying the dominant allele Vrn-A1c with a deletion in intron-1 of Vrn-A1 (Yan et al. Reference Yan, Helguera, Kato, Fukuyama, Sherman and Dubcovsky2004) and the recessive alleles vrn-B1 and vrn-B3 (Fu et al. Reference Fu, Szűcs, Yan, Helguera, Skinner, Von Zitzewitz, Hayes and Dubcovsky2005; Yan et al. Reference Yan, Fu, Li, Blechl, Tranquilli, Bonafede, Sanchez, Valarik, Yasuda and Dubcovsky2006).
Table 1. Allelic combinations for Ppd-A1, Ppd-B1 and Vrn-A1 genes present in a collection of 35 durum wheat genotypes obtained through a divergent selection process for flowering time, acronyms used and frequencies within the collection

* Nomenclature described in Wilhelm et al. (Reference Wilhelm, Turner and Laurie2009).
† Discarded from statistical analyses due to uniqueness in present collection.
Table 2. Molecular marker summary

Three alleles were identified at Ppd-A1 (Table 1). Sixteen out of the 35 genotypes carried the allele Ppd-A1b conferring photoperiod sensitivity, while the alleles ‘GS-105’ and ‘GS-100’ were identified in 12 and 7 genotypes, respectively. For Ppd-B1, the wild-type allele conferring photoperiod sensitivity (Ppd-B1b) was identified in 14 genotypes, while the mutation conferring photoperiod insensitivity (Ppd-B1a) was identified in 21 genotypes using the linked SSR markers. Allele polymorphisms that were identified in bread wheat (the SNP in Exon 4 of Vrn-A1, Indels in Ppd-A1, truncated copies, transposon-junctions and SNP variations in Ppd-B1) were not observed in this set of durum wheat (Table 2).
The genotypes were classified into Ppd-A1–Ppd-B1 allelic combinations (Table 1). Given the low frequency of the allelic combination GS-100/Ppd-B1b – identified only in the control variety Mexa − this combination was removed from the statistical analysis. The controls Simeto and Anton had the allelic combination identified as SI in Table 1.
Environmental and genetic effects on crop development
The four experimental sites have been characterized previously in terms of their environmental variables Villegas et al. (Reference Villegas, Alfaro, Ammar, Cátedra, Crossa, García del Mora and Royo2015) and the growing conditions during the two evaluation years are summarized in Fig. 1. Yearly average temperatures increased from north to south. Total water input ranged from 294 to 583 mm, including irrigation, but did not result in any measurable water stress in any of the experiments. The largest variation in photoperiod amplitude during the growth cycle, calculated as the difference between days of maximum and minimum photoperiod, corresponded to Spain-North with 6.05 h. This amplitude decreased sharply with decreasing latitude, to a minimum of 1.15 h in Mexico-South, which was the only site with decreasing photoperiod because of spring planting, while at the remaining sites the photoperiod increased during the growth cycle (Fig. 1).
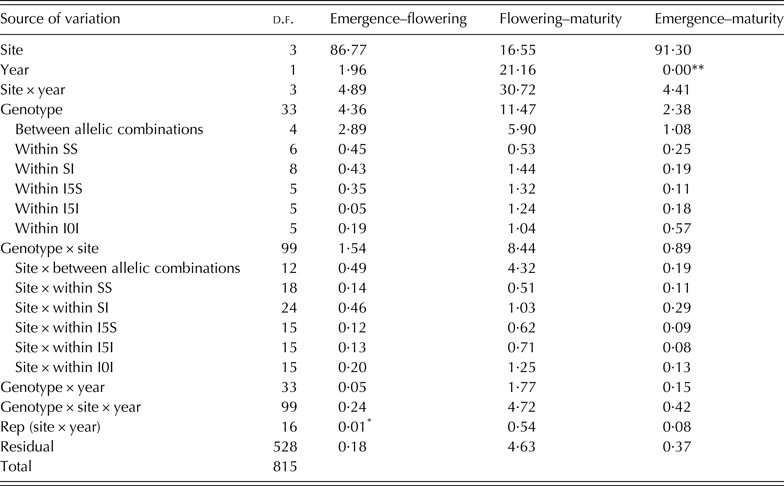
In each experiment, plants of all plots emerged on the same day. The ANOVA results are presented in Table 3. The environmental effects (site, year and site × year) accounted for the largest proportion of the variability in crop phenology (Table 3). The site effect was the most important in explaining the length of the emergence-flowering and emergence-maturity periods. Genotype mean values across experiments are shown in Table 4. For the duration of emergence-flowering differences between allelic combinations accounted for 66·3% of the variability due to genotype, with the remaining 33·7% being explained by differences within combinations (deduced from Table 3). The genotype effect accounted for 11·5% of variation in the flowering-maturity period. Differences between allelic combinations accounted for 51·4% of the variation induced by the genotype effect for the duration of this period. For the total cycle length, the emergence-maturity period, allelic combinations accounted for c. 45·4% of the genotype effect (deduced from Table 3).
Table 3. Percentage of the sum of squares (% SS) of the analysis of variance (ANOVA) for the number of days of developmental periods of 34 durum wheat genotypes grown at two contrasting sites in Spain and Mexico in 2007 and 2008

The genotype effect and the environment × genotype interaction are partitioned into differences between allelic combinations and differences within each of them (see Table 1 for allelic combination acronyms).
%SS values without symbol are significant at P < 0·001, *P < 0·01, **P > 0·05.
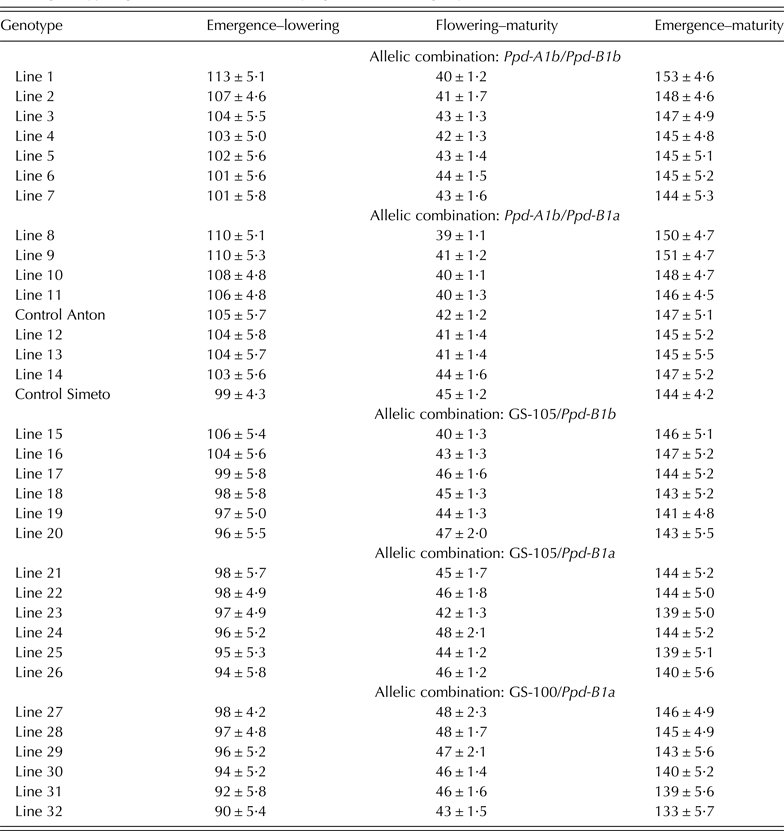
Table 4. Mean values across sites and years ± s.e. of the number of days for developmental periods of 34 durum wheat genotypes grown at four sites of varying latitude during 2 years

The genotype × site interaction accounted for the largest portion of the genotype × environment interaction for all the variables measured. The site × between allelic combinations interaction was significant for the three periods and accounted from c. 21·3 to 51·2% of the variance explained by the genotype × site interaction, and from 0·19 to 4·32% of the total variance of the model. The interactions between site and the variability within allelic combinations were significant in all cases (P < 0·001) and explained between 0·08 and 1·25% of the total variance of the models (Table 3).
Main effect of allelic variation at Ppd-A1
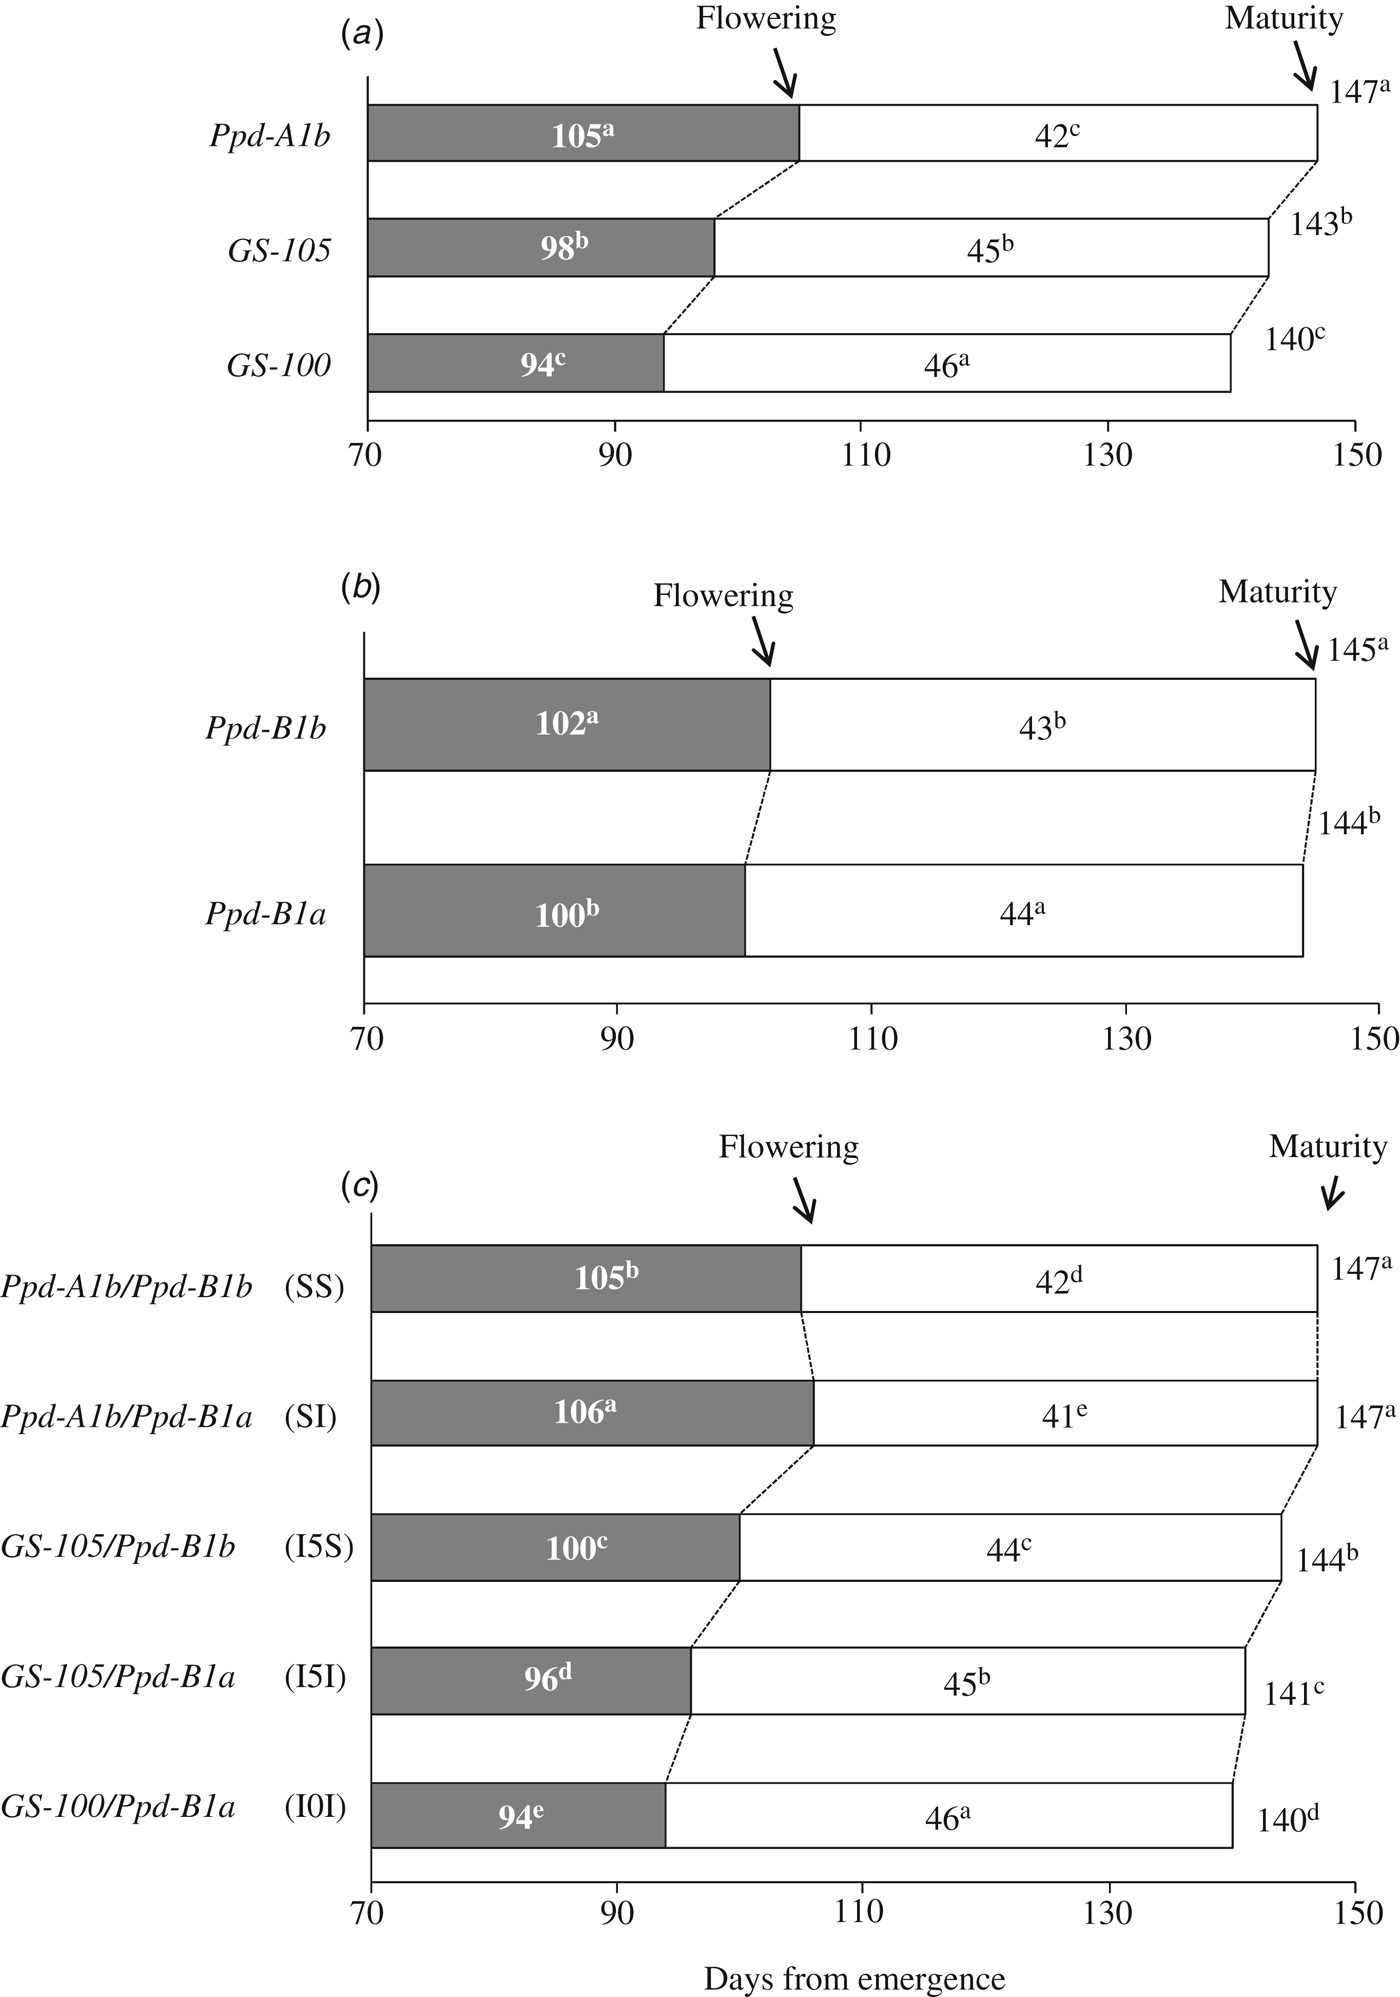
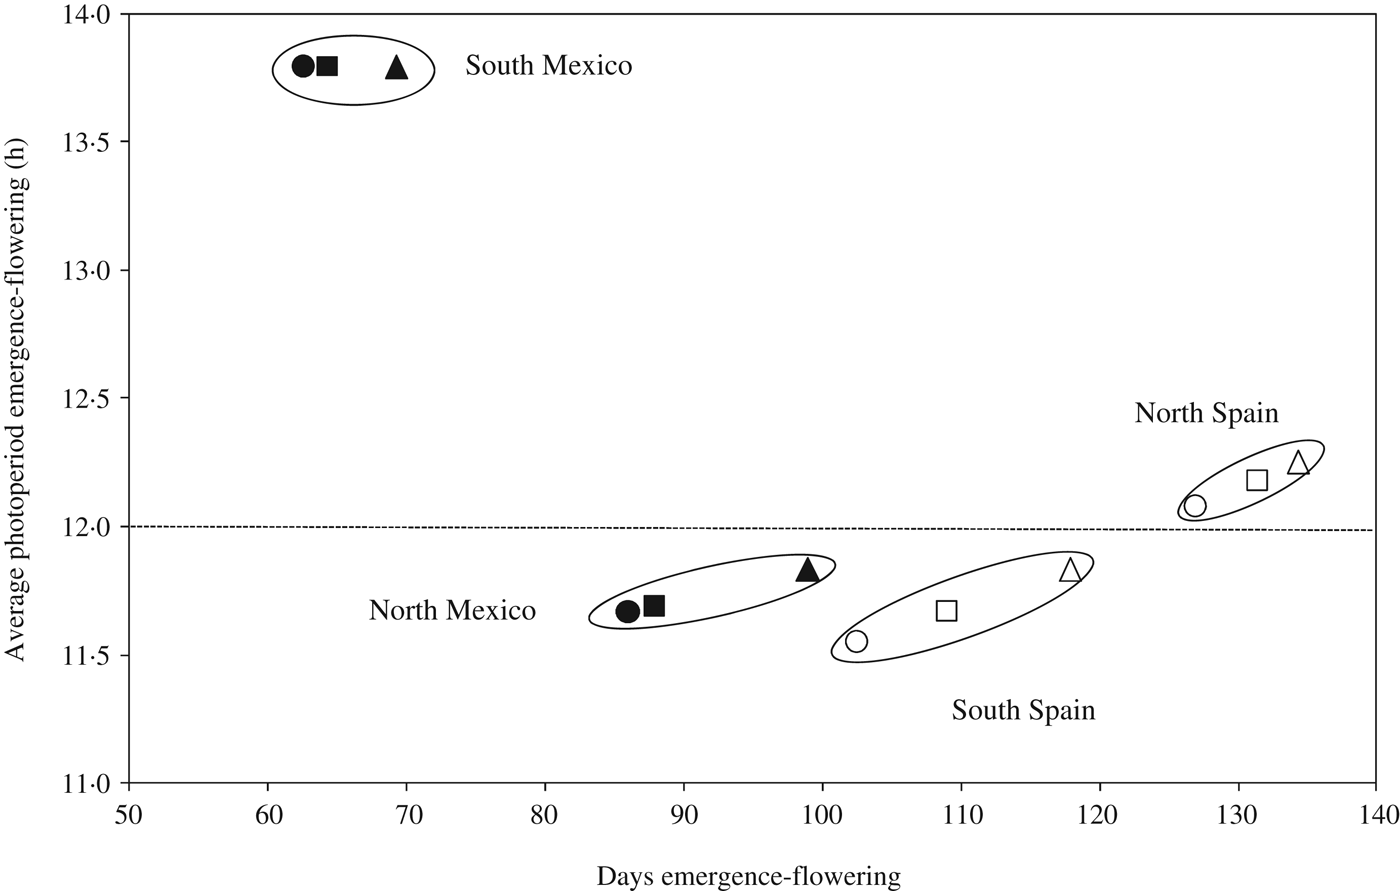
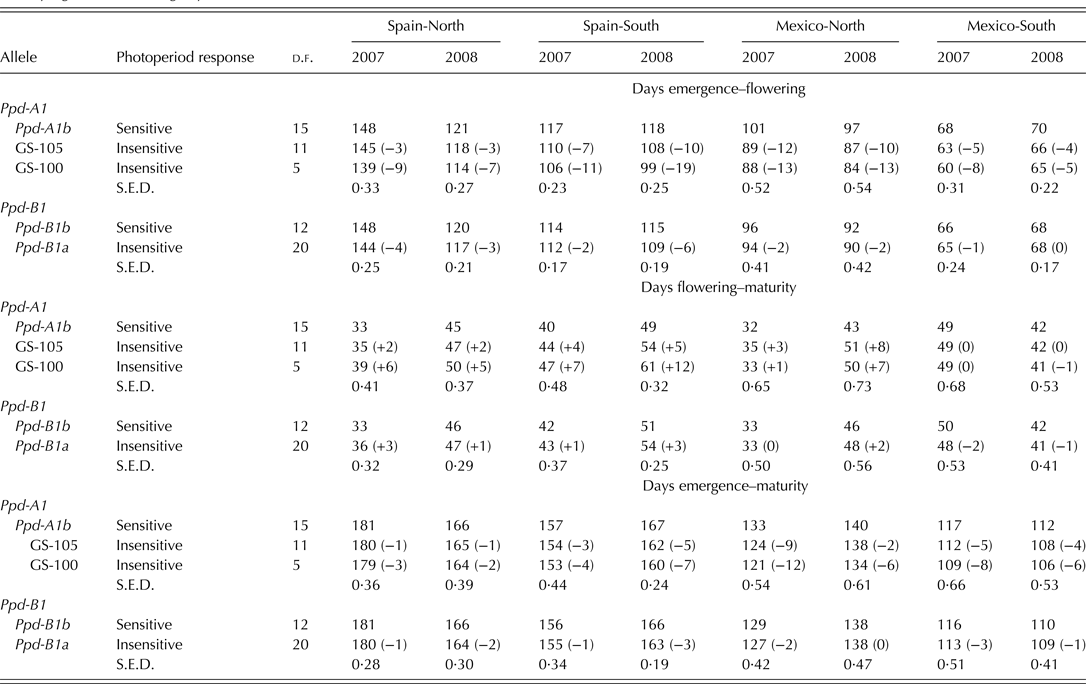
Genotypes carrying allele Ppd-A1b (conferring photoperiod-sensitivity) had on average a longer time to flowering than those carrying any of the two alleles conferring photoperiod insensitivity (Fig. 2a). Allelic variants at Ppd-A1a reduced the duration of the emergence-flowering period. This reduction was higher in Spain-South and Mexico-North than in Spain-North or Mexico-South (Table 5). Emergence-flowering time reductions from 7 to 12 days were observed in Spain-South and Mexico-North in the genotypes carrying allele GS-105 compared with those carrying the sensitive allele, while in Spain-North and Mexico-South the reductions ranged between 3 and 5 days. Similarly, the reduction in the duration of the emergence-flowering period caused by allele GS-100 at Ppd-A1a when compared with Ppd-A1b were more than double in Spain-South and Mexico-North (11–19 days) than in Spain-North and Mexico-South (5–9 days) (Table 5). In order to examine the divergences in the expression of Ppd-A1a alleles at contrasting sites during emergence-flowering, the relationship between the length of this period and the environmental variables recorded at each site were investigated. The results showed that differences in emergence-flowering caused by alleles at Ppd-A1a were larger at sites with an average photoperiod below 12 h, as shown in Fig. 3.

Fig. 2. Average number of days corresponding to different developmental stages of 34 durum wheat genotypes grown for 2 years at four sites at different latitudes: (a) contrast based on allelic composition at Ppd-A1; (b) contrast based on allelic composition at Ppd-B1 and (c) contrast based on allelic composition at both loci.

Fig. 3. Relationship between the number of days from emergence to flowering and average daily photoperiod in the same period. Each point represents the mean value of a set of durum wheat genotypes carrying the same allele at the Ppd-A1 locus grown in field experiments in 2007 and 2008 at four sites. Triangle = Ppd-A1b conferring photoperiod sensitivity; square = Ppd-A1a GS-105 and circle = Ppd-A1a GS-100 conferring photoperiod insensitivity. Open and solid symbols correspond to Spanish and Mexican sites, respectively.
Table 5. Main effects of alleles at Ppd-A1 and Ppd-B1 loci on the number of days of developmental periods of 34 durum wheat genotypes grown at four sites of varying latitude during 2 years

Numbers in parentheses are the difference from the sensitive allele within each period and locus.
The comparison of the reduction in flowering time associated with the two mutations at Ppd-A1 causing photoperiod insensitivity showed that allele GS-100 had a consistent stronger effect than allele GS-105 (Fig. 2a and Table 5). The effect of Ppd-A1 alleles on the duration of the flowering-maturity period was in the opposite direction and to a lesser extent than that observed for time to flowering (Fig. 2a). On average, alleles GS-105 and GS-100 extended the flowering-maturity period by 3 days and 4 days, respectively, when compared with the wild type, but their effect was not consistent across sites and years (Table 5). Given that the effect of Ppd-A1 alleles conferring photoperiod insensitivity was greater in shortening the time to flowering than extending the flowering-maturity period, their effect amounted to a net reduction of total cycle length (Fig. 2a). However, the intensity of their effect depended on the site × year interaction (Table 5).
Main effect of allelic variation at Ppd-B1
The comparison of the two allelic variants at Ppd-B1 revealed that, on average, the allele Ppd-B1a (conferring photoperiod insensitivity) reduced the duration of the emergence-flowering period by 2 days compared with the allele Ppd-B1b (Fig. 2b). This effect was consistent in all sites and years except in Mexico-South 2008 (Table 5).
Photoperiod insensitivity conferred by Ppd-B1a caused a slight lengthening of the mean flowering-maturity period across sites (Fig. 2b), but the effect was much more consistent in Spain than in Mexico (Table 5). Compared with the wild type, the presence of allele Ppd-B1a reduced total cycle length by 1 day on average consistently at all sites and years, except in Mexico-North 2008.
Allelic combinations at Ppd-A1 and Ppd-B1
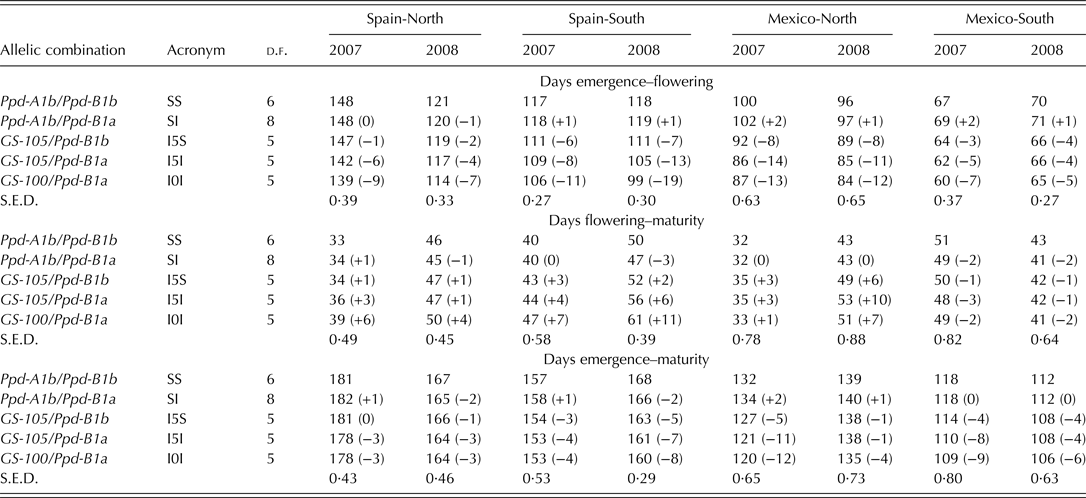
The comparison of the mean values of cycle length across sites showed that the genotypes carrying the allelic combination Ppd-A1b/Ppd-B1a (SI) had the longest emergence-flowering duration and the shortest flowering-maturity (Fig. 2c). However, when site × year interactions were considered, differences between combination SI and the wild type (SS) were not always statistically significant (Table 6).
Table 6. Interaction effects of the allelic combination at Ppd-A1 and Ppd-B1 loci on the number of days for developmental periods of 34 durum wheat genotypes grown at four sites of varying latitude during 2 years

For each site, year and period, numbers in parentheses are the differences from the combination of sensitive alleles at both loci (SS).
Combinations involving the non-wild type at Ppd-A1 (I5S, I5I, I0I) resulted in a significant reduction of the emergence-flowering period, a lengthening of the flowering-maturity period and a net shortening of the total cycle length, to extents that were dependent on the allelic composition at Ppd-B1 (Fig. 2c). However, in Mexico-South differences between combinations were low (Table 6). The effect of allele GS-105 depended on the allele present at Ppd-B1, as the flowering of genotypes carrying the sensitive allele at Ppd-B1 (I5S) were delayed 4 days, on average, compared with those carrying the insensitive allele (I5I) (Fig. 2c). This effect was consistent at all sites and years except Mexico-South in 2008 (Table 6). On the other hand, genotypes carrying the combination I5I slightly lengthened their grain filling period on average by 1 day when compared with those carrying combination I5S. Net total cycle length was decreased on average by 3 days in genotypes carrying the combination I5I in comparison with those carrying combination I5S (Fig. 2c).
The shortest time to flowering corresponded to the allelic combination I0I (Fig. 2c), but differences with combination I5I were not statistically significant in Mexico-North (Table 6. In addition, combination I0I resulted in a slightly longer grain filling period than combination I5I, and a slightly shorter total cycle length (Fig. 2c).
The relationship between ACP and the number of days before and after flowering is shown in Fig. 4. For the duration of the emergence-flowering period, the interaction between photoperiod and allelic combination was quantitative in nature, with all the site clusters showing the allelic combinations SS and SI with the highest ACP, and allelic combination I0I with the lowest ACP. The allelic combinations I5S and I5I had intermediate ACP values within clusters in most cases. As shown in Table 6, the spring sowing-time in Mexico-South resulted in reduced differences in time to flowering between the allelic combinations. A linear model (y = 0·0904x–10·374; R 2 = 0·97; P < 0·001) was properly fitted to the relationship between ACP and the number of days from emergence to flowering (n = 20, points shown on Fig. 4a). Figure 4b shows a substantial interaction between the flowering-maturity period and allelic combination groups at different sites. A negative relationship was found between the duration of the emergence-flowering and flowering-maturity periods (r = –0·77, P < 0·001).

Fig. 4. Relationships between accumulated photoperiod and (a) number of days from emergence to flowering, (b) number of days from flowering to maturity. Each value represents the mean of 34 durum wheat genotypes carrying the same allelic combination for the Ppd-A1 and Ppd-B1 genes grown in field experiments in 2007 and 2008 at four sites with contrasting latitude. * = SS, □ = SI, ▵ = I5S, + = I5I, ○ = I0I, see Table 1 for allelic combination acronyms.
Earliness per se
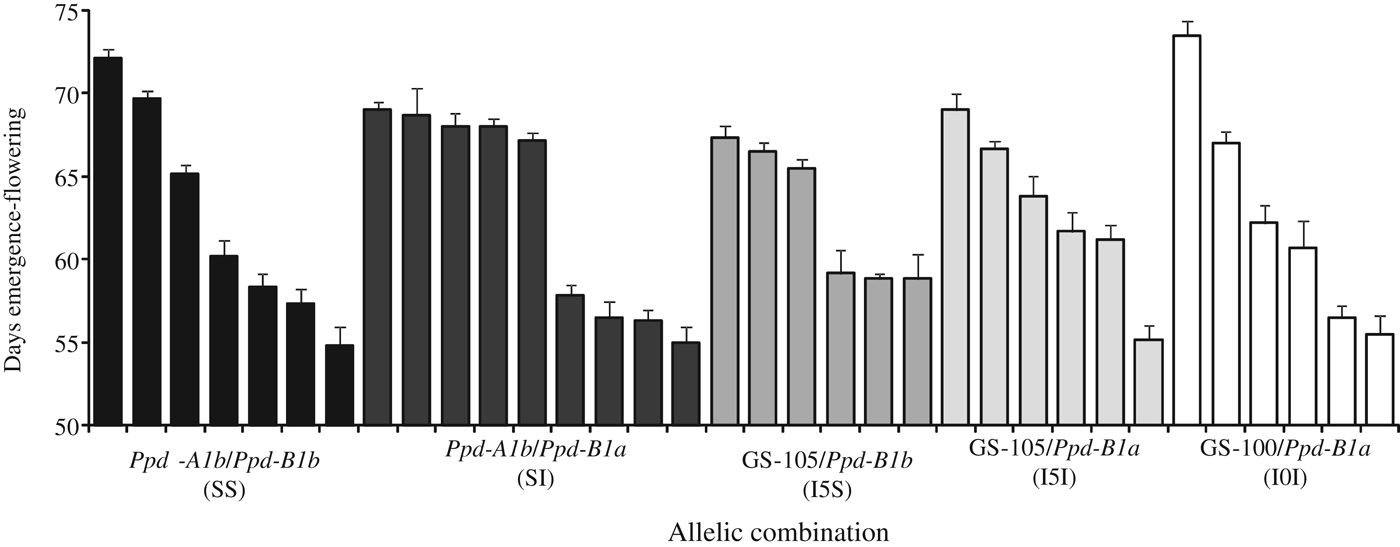
In the ANOVA (Table 3), the sums of squares for variation within allelic combinations were highly significant (P < 0·001), indicating an important source of variation in the duration of all developmental phases independently of the allelic composition at the Ppd-1 loci, and Vrn loci since the latter were fixed. This suggests the presence of Eps effects. Although significant in a few cases, Mexico-South had the smallest effects of allelic combinations at the Ppd-1 loci because the day length theoretically exceeded the photoperiod requirements for any spring wheat. At this site the average day length from emergence to flowering across genotypes was 13.8±0.01 h, and for the day of flowering it was 13.7±0.10 h. Under these conditions, a wide range of flowering times was observed within each allelic combination. Differences in flowering date between the earliest and the latest genotype were 17, 14, 8, 14 and 18 days for allelic combinations SS, SI, I5S, I5I and I0I, respectively (Fig. 5).

Fig. 5. Estimation of earliness per se (i.e. minimum duration of the emergence-flowering date) measured in days, for durum wheat genotypes carrying different allelic combinations at Ppd-A1 and Ppd-B1 genes. Data are means of experiments conducted in the South of Mexico during 2 years. Vertical bars indicate the s.e. of mean.
DISCUSSION
The current study focused on the effects of allelic variants for the photoperiod response genes Ppd-A1 and Ppd-B1 on flowering time and cycle duration in a set of 34 genotypes. All genotypes revealed the same spring growth habit at Vrn-1 based on published molecular markers. Differentiating interactions between Ppd-1 and Vrn-1 alleles, frequently mentioned in the literature (Casao et al. Reference Casao, Igartua, Karsai, Lasa, Gracia and Casas2011; Turner et al. Reference Turner, Faure, Zhang and Laurie2013), should not be expected in the present set of genotypes. Furthermore, the high synchrony in time to full emergence between the genotypes used provides confidence that the differences in phenology observed in the current study were not affected by variations in germination or crop establishment capacities.
The frequency of the insensitive allele GS-105 in the population was higher than that of allele GS-100 (34 and 20%, respectively), in agreement with the preponderance of allele GS-105 in advanced germplasm from Europe and CIMMYT reported by Bentley et al. (Reference Bentley, Turner, Gosman, Leigh, Maccaferri, Dreisigacker, Greenland and Laurie2011). It has been speculated that the mutation resulting in allele GS-105 preceded the one resulting in allele GS-100, with GS-105 being detected in old landraces, while GS-100 has been found only in a few modern varieties to date (Bentley et al. Reference Bentley, Turner, Gosman, Leigh, Maccaferri, Dreisigacker, Greenland and Laurie2011). Mutations within the gene sequence of Ppd-B1 have been reported (Beales et al. Reference Beales, Turner, Griffiths, Snape and Laurie2007; Shaw et al. Reference Shaw, Turner and Laurie2012), but none corresponded to photoperiodic response, implying that the critical mutation causing the allelic difference of the Ppd-B1 gene has not been found. The role of copy number variation of Ppd-B1 has been described recently in bread wheat (Diaz et al. Reference Diaz, Zikhali, Turner, Isaac and Laurie2012) and Nishida et al. (Reference Nishida, Yoshida, Kawakami, Fujita, Long, Akashi, Laurie and Kato2013) reported a novel mutation in the 5′ upstream region of Ppd-B1.
The mutations described by Nishida et al. (Reference Nishida, Yoshida, Kawakami, Fujita, Long, Akashi, Laurie and Kato2013) and allelic variants found in the bread wheat varieties were not found in the current study using durum wheat elite germplasm. However, the overall number of parents in the current study was low. A more extensive allele mining study in durum wheat of Ppd-A1 and Ppd-B1 is therefore warranted. The marker gwm148 linked to Ppd-B1 in several studies including durum wheat (Hanocq et al. Reference Hanocq, Niarquin, Heumez, Rousset and Le Gouis2004; Mohler et al. Reference Mohler, Lukman, Ortiz-Islas, William, Worland, Van Beem and Wenzel2004; Maccaferri et al. Reference Maccaferri, Sanguineti, Corneti, Ortega, Araus, Ben Salem, Bort, DeAmbrogio, Garcia Del Moral, Demontis, El-Ahmed, Maalouf, Machlab, Martos, Moragues, Motawaj, Nachit, Nserallah, Ouabbou, Royo, Slama and Tuberosa2008) showed polymorphism in the current study. Cane et al. (Reference Cane, Eagles, Laurie, Trevaskis, Vallance, Eastwood, Gororo, Kuchel and Martin2013) reported the relationship of gwm148 with the one-copy and two-copy alleles in bread wheat. However, quantitative techniques to identify copy number variants of the Ppd-B1 alleles will be investigated further.
The previously published allelic combinations in durum wheat at Ppd-A1 and Ppd-B1 were present in the current collection. The relatively balanced representation of alleles conferring photoperiod sensitivity (46% at Ppd-A1 and 40% and Ppd-B1) and their variants conferring photoperiod insensitivity confirm the suitability of the present germplasm collection for addressing the objectives of the study.
Photoperiod, or period of daylight every 24 h, is dependent on latitude and season (Lee Reference Lee1970). Previous papers have shown that latitude integrates a number of variables affecting wheat development, among which the most important are photoperiod (Laurie et al. Reference Laurie, Pratchett, Bezant and Snape1995), temperature (Craufurd & Wheeler Reference Craufurd and Wheeler2009) and their interaction (Hemming et al. Reference Hemming, Walford, Fieg, Dennis and Trevaskis2012). With the aim of testing the current germplasm under field conditions and a wide range of photoperiods, experiments were conducted at four sites with latitudes ranging from 19° to 41°N, and average day length from sowing to flowering between 11.8 and 14.2 h, and from flowering to maturity between 13.3 and 15.8 h Villegas et al. (Reference Villegas, Alfaro, Ammar, Cátedra, Crossa, García del Mora and Royo2015). Although each site corresponded to a different latitude, the site effect in the current study involved not only differences in day length, but also other environmental (e.g. temperature, water input and soil type) and agronomic (e.g. dose and type of fertilizers and sowing dates) variations, which should provide more robustness to the average differences in phenology observed between Ppd-1 allelic combinations.
The results of the ANOVA showed that the site effect was the most important factor explaining variability in time to flowering and total cycle length. The year effect, which included seasonal differences in environmental variables and small variations in agronomic conditions, and the site × year interaction had a much smaller effect than the site itself. This result suggests that differences between sites in photoperiod and temperature (associated with the latitude) were probably the most important variables in explaining phenological differences between sites. This statement is supported by the results of a recent study involving the same experiments, which showed that photoperiod and temperature jointly explained c. 77% of environmental variation between sites, and that day length from sowing to flowering steadily increased from north to south, while day length from flowering to maturity followed the opposite trend Villegas et al. (Reference Villegas, Alfaro, Ammar, Cátedra, Crossa, García del Mora and Royo2015). The spring planting in Mexico-South had important implications on the results obtained, as discussed below.
The ANOVA results also showed that grain filling duration depended largely on the year and the site × year interaction. This observation is in accordance with the reported relatively low heritability of grain filling duration, and the large environmental influence on this trait (Egli Reference Egli2004; Royo et al. Reference Royo, Villegas, Rharrabti, Blanco, Martos and García Del Moral2006).
The strong linear relationship between ACP and number of days from emergence to flowering shown in Fig. 4a demonstrated a consistent trend of flowering time regulation associated with the different allelic combinations. Within the range of latitudes and with the genotypes used in the current study, time from emergence to flowering ranged from 63 to 134 days and accumulated photoperiod until flowering from 863 to 1642 h.
The fraction of the genotype effect explained by differences between allelic combinations was c. 66%. As all genotypes studied had a spring growth habit and no significant interaction with vernalization requirement was expected, this result provided a quantitative estimate of the relative effect of allelic variation at the Ppd-1 loci in explaining genotypic variance for time to flowering. However, it also suggested that other genetic factors determined c. 34% of the genotypic variance and also interacted significantly with the site. This non-Ppd-1 related variation is supported by the fact that there were statistically significant differences in all traits within all allelic combinations, suggesting the involvement of Eps, in accordance with previous studies reporting the influence of minor genes on bread wheat flowering time (Griffiths et al. Reference Griffiths, Simmonds, Leverington, Wang, Fish, Sayers, Alibert, Orford, Wingen, Herry, Faure, Laurie, Bilham and Snape2009; García et al. Reference García, Serrago, Appendino, Lombardo, Vanzetti and Miralles2011).
Genotype variability for the emergence-flowering period was greater in the presence of the Ppd-A1b allele. It may be hypothesized that, within genotypes carrying the sensitive allele, other genes implied in regulation of flowering time have a higher phenotypic expression than when they are present in combination with the insensitive allele. Shaw et al. (Reference Shaw, Turner and Laurie2012) reported that bread wheat genotypes with three mutations had a phenology similar to that of genotypes with the two mutations with the strongest effect. In the current study, it was hypothesized that the Ppd-A1 gene was powerful enough to cause a rate of earliness close to the maximum in durum wheat. This could be an evolutionary effect based on polyploidization that could explain the small differences observed between genotypes with Ppd-A1a.
In the current study, the longest time to flowering was recorded consistently in allelic combinations carrying the wild-type allele Ppd-A1b, which resulted in an average delay of flowering of 3 days compared with allelic combinations involving the wild-type allele at the other locus, Ppd-B1b. These results suggest a stronger effect of the alleles conferring photoperiod sensitivity at Ppd-A1 than that at Ppd-B1 (Ppd-A1b > Ppd-B1b). Similarly, alleles causing insensitivity at Ppd-A1 (GS-105 and GS-100) had a stronger effect in reducing flowering time than the allele at Ppd-B1 (Ppd-A1a > Ppd-B1a). The current results are in agreement with those recently reported in hexaploid wheat by Shaw et al. (Reference Shaw, Turner and Laurie2012), who classified the photoperiod insensitivity alleles according to their effect on flowering date as Ppd-D1a > Ppd-A1a > Ppd-B1a, when Ppd-A1a is the GS-100 durum wheat variant. Other studies in bread wheat ranked the relative strength of these genes differently. Scarth & Law (Reference Scarth and Law1984) speculated that Ppd-B1a may have a stronger effect than Ppd-A1a, and this in turn would be stronger than Ppd-D1. Worland et al. (Reference Worland, Börner, Korzun, Li, Petrovíc and Sayers1998) suggested that Ppd-D1 confers greater precocity, followed by Ppd-B1, with the Ppd-A1 gene having a smaller effect. A greater effect of Ppd-B1a than Ppd-D1a of hexaploid wheat was reported by Tanio & Kato (Reference Tanio and Kato2007), who suggested that there may be different alleles conferring insensitivity in the B genome, with different effects on earliness. A recent study suggests that copy number in addition of diverse mutations have different effects on the date of anthesis (Diaz et al. Reference Diaz, Zikhali, Turner, Isaac and Laurie2012).
The current results suggest that the effect of allele Ppd-B1a depended on the allele present at Ppd-A1. In presence of allele Ppd-A1b the effect of the Ppd-B1a gene was minor. However, in the presence of Ppd-A1a, Ppd-B1a reduced flowering time by 4 days in comparison with the wild-type allele at the same locus. This tendency was observed in all the experiments except that carried out at Mexico-South in 2008, where differences were not statistically significant. These results point out the interaction between genes Ppd-A1 and Ppd-B1. Tanio & Kato (Reference Tanio and Kato2007) described an incomplete dominance and interaction between genes Ppd-B1 and Ppd-D1 similar to that observed in the current study between genes Ppd-A1 and Ppd-B1.
Among the two allelic combinations causing photoperiod insensitivity at Ppd-A1, GS-105/Ppd-B1a and GS-100/Ppd-B1a, the latter resulted in average genotypes flowering 2 days earlier on average. Moreover, genotypes carrying allele GS-100 independent of the allele at Ppd-B1 flowered, on average, 4 days before those carrying allele GS-105. However, the latter group included different alleles at Ppd-B1 and the former only those carrying allele Ppd-B1a. The tendency was consistent in all experiments, suggesting that allele GS-100 had a stronger effect than GS-105. These results are in agreement with those reported by Bentley et al. (Reference Bentley, Turner, Gosman, Leigh, Maccaferri, Dreisigacker, Greenland and Laurie2011), who found that allele GS-100 conferred earlier flowering than GS-105, and are also consistent with previous observations in durum wheat (Clarke et al. Reference Clarke, DePauw and Thiessen1998; Maccaferri et al. Reference Maccaferri, Sanguineti, Corneti, Ortega, Araus, Ben Salem, Bort, DeAmbrogio, Garcia Del Moral, Demontis, El-Ahmed, Maalouf, Machlab, Martos, Moragues, Motawaj, Nachit, Nserallah, Ouabbou, Royo, Slama and Tuberosa2008; Wilhelm et al. Reference Wilhelm, Turner and Laurie2009).
Allelic variants at Ppd-1 genes causing photoperiod insensitivity had an opposite, but more modest effect on grain filling period when compared with their effect on flowering time. Consequently, a consistent negative relationship was found between time to flowering and grain filling duration. This relationship could be attributed to the environmental conditions prevailing at the end of the growth cycle (acceleration of senescence due to heat), but also to the presence of genetic factors inducing earlier flowering in combination with elongating grain filling duration, such as the QTL regulating Eps (QFlt.dms-5B.1) recently identified by Kamran et al. (Reference Kamran, Iqbal, Navabi, Randhawa, Pozniak and Spaner2013). Bogard et al. (Reference Bogard, Jourdan, Allard, Martre, Perretant, Ravel, Heumez, Orford, Snape, Griffiths, Gaju, Foulkes and Le Gouis2011) also found co-location of QTLs responsible for grain filling duration and anthesis date in bread wheat. As a result, total cycle length was reduced slightly, following the same general trends observed for time to flowering. Early-flowering genotypes have their spike growth phase under lower temperatures, resulting in a higher grain number per unit of land (Ratjen et al. Reference Ratjen, Böttcher and Kage2012). This represents a stronger sink force, which has been associated with accelerated senescence (Gan Reference Gan and Gan2007; Fois et al. Reference Fois, Motzo and Giunta2009), as could be the case of the earliest genotypes in the current study.
The current results showed that photoperiod affected the expression of alleles at Ppd-A1. At the Spain-North site, where mean photoperiod from emergence to flowering was 12.2 h, differences in flowering time between genotypes carrying different allelic combinations were statistically significant but small. In Spain-South and Mexico-North, where photoperiod from emergence to flowering averaged 11.7 h, these differences increased. In Mexico-South, with decreasing photoperiod from emergence to flowering and a 13.79 h average day-length, total cycle length was greatly shortened, and average differences between allelic combinations groups were reduced. Based on the current results, it appears that the phenotypic expression of Ppd increases at sites with average pre-flowering day length lower than 12 h, which is in agreement with the results of Kumar et al. (Reference Kumar, Sharma, Chaudhary, Tyagi, Mishra, Priyadarshini and Singh2012), who reported a critical photoperiod of 12 h for bread wheat phenotypes to manifest the genetic contribution of Ppd-D1. Wilhelm et al. (Reference Wilhelm, Turner and Laurie2009) also reported that the expression of Ppd-A1a increases under short days.
Earliness per se genes have been reported to be strong enough to induce earlier flowering, even in the presence of Vrn and Ppd genes (Van Beem et al. Reference Van Beem, Mohler, Lukman, Van Ginkel, William, Crossa and Worland2005). It can be assessed only in conditions which minimize the effects of Vrn/Ppd related variations. The Mexico-South site, with its spring planting and 14 h day length during the whole pre-flowering period, provided such an environment and the opportunity to assess Eps within the current collection. Since Ppd effects were still significant at this site, they were properly deducted for Eps calculations, according to Ortiz Ferrara et al. (Reference Ortiz Ferrara, Mosaad, Mahalakshmi and Rajaram1998). The significance of Ppd effects in Mexico-South is not surprising given that plants carrying the allele GS-100 have been recently reported to be still photoperiod-sensitive (Chen et al. Reference Chen, Li, Hu, Lau, Lin, Rockwell, Martin, Jernstedt, Lagarias and Dubcovsky2014).
Effectively, a wide range of Eps effect was recorded, given that differences between the latest and the earliest genotypes reached at that site 19 days from emergence to flowering. This was the same effect than the one between allelic combinations recorded in Spain-South in 2008, where Ppd effects were maximized. These results suggest an important role of Eps in the germplasm used in the current study. In addition, no relationship was found between allelic combination and the effect of Eps, as all the allelic combination groups showed a wide range of time to flowering. These results are consistent with those reported by Gomez et al. (Reference Gomez, Vanzetti, Helguera, Lombardo, Fraschina and Miralles2014) in Argentinean bread wheat cultivars, and those for heading time reported by Gawronski & Schnurbusch (Reference Gawronski and Schnurbusch2012) describing the effect of the Eps-3A m under glasshouse conditions. Miura & Worland (Reference Miura and Worland1994) found that the effect of Eps in reducing heading date was independent of environmental stimuli, but Lewis et al. (Reference Lewis, Faricelli, Appendino, Valarik and Dubcovsky2008) reported significant interactions between Eps-Am1 alleles and temperature, suggesting that the effect of some Eps genes may vary depending on the environment. It has been reported recently that natural variation for the Phytochrome C gene (a light-responsive activator of Ppd-1 genes) may also be associated with wheat adaptation to different latitudes (Chen et al. Reference Chen, Li, Hu, Lau, Lin, Rockwell, Martin, Jernstedt, Lagarias and Dubcovsky2014). The findings of the current study open further approaches for the identification and study of new genes regulating Eps in durum wheat.
CONCLUSION
The results obtained in the current study lead to the conclusion that in durum wheat: (i) Ppd-A1a, conferring photoperiod insensitivity, had a stronger effect on flowering time than Ppd-B1a; (ii) allele GS-100 had a stronger effect than GS-105, so according to their effect on flowering date the effect of photoperiod insensitivity alleles could be classified as Ppd-A1a (GS-100) > Ppd-A1a (GS-105) > Ppd-B1a; (iii) interaction existed between genes Ppd-A1 and Ppd-B1; (iv) the phenotypic expression of photoperiod genes increased at sites with mean day length from emergence to flowering lower than 12 h; (v) the effect of Ppd-A1 alleles on flowering date was greater than the effect on grain filling period but this differed among alleles; and (vi) estimation of Eps effects revealed great variation in time to flowering independent of allele variants at Ppd-1.
The current study is the first one showing the phenotypic effect of Ppd-1 genes in durum wheat under field conditions at a range of latitudes, thus being a significant contribution to the elucidation of the phenotypic expression of genetic factors controlling flowering time in durum wheat.
This study was partially funded by INIA (Instituto Nacional de Investigación y Tecnología Agraria y Alimentaria) Spain under projects RTA2009-00085 and RTA2012-00011, and project AGL2012-37217. C Alfaro was recipient of a PhD grant from INIA (Instituto de Investigaciones Agropecuarias) Chile. We thank the contribution of Dr Luis F. García del Moral (University of Granada), Dr María del Mar Cátedra (Consejería de Agricultura, Pesca y Medio Ambiente, Spain) and Mr. Chafik Harrathi. Thanks are also given to Dr Kling from Hohenheim University and to Dr Wolfgang Pfeiffer (formerly durum breeder at CIMMYT, now at CIAT-Columbia) for providing parental germplasm and resulting segregating populations for the current study.


