INTRODUCTION
The number of dengue cases in Singapore in 2005, as reported by the Ministry of Health [1] was 13817, peaking at 697 cases in the last week of September. This 2005 outbreak exceeded all previous records of annual dengue incidence [Reference Burattini2]. As a result, the local health authorities decided to implement strict control measures that combined a search-and-destroy of the mosquitoes' breeding places and the spreading of adulticides; within a few weeks the outbreak had subsided.
The dengue epidemics of 2003–2005 have been analysed in detail in Burattini et al. [Reference Burattini2], where a mathematical model was presented that not only reproduced the natural course of the outbreaks but also helped to design the control measures and tallied the impact of such measures with very good accuracy. The model predicted a reasonable outbreak in 2006 of about 6500 cases and a very mild outbreak for 2007 with around 2000 cases. However, only 3051 cases were reported in 2006 while more than 7800 were reported in the first 44 weeks of 2007. What occurred in 2006 and 2007 that made our predictions inaccurate? The aim of this paper is to propose a hypothesis that could explain both the low number of dengue cases in 2006 and the unexpectedly high number of cases in 2007.
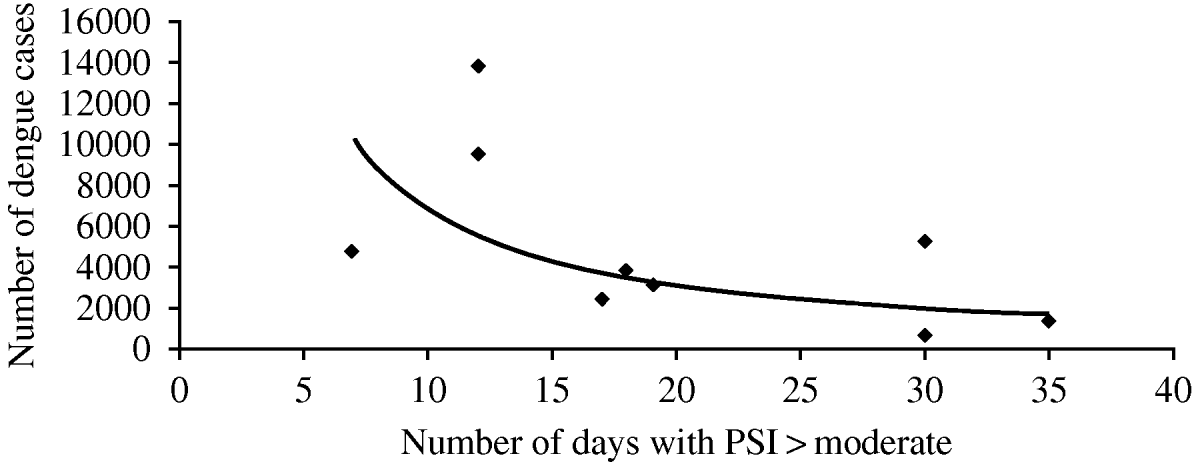
Due to its geographical location Singapore suffers almost every year from hazes caused by wildfires from its neighbour Indonesia. The significant impact of such hazes on pollution indexes are frequently seen in some periods of the year, with particularly important episodes in 1997 and 2006 [3]. These haze episodes, along with local sources of particulate matter and other air pollutants are significantly correlated with the number of dengue cases, as can be observed in Fig. 1. Figure 1 correlates the annual number of days that pollutant indexes are equal to or greater than ‘moderate’ with the annual number of dengue cases.

Fig. 1. Correlation between annual number of days pollutant indexes (PSI) equal to or greater than ‘moderate’ and annual number of dengue cases [3]. (y=94662x −1·416, R 2=0·4126.)
The hypothesis
We therefore hypothesize that the combination of haze with other local sources of particulate matter had a significant impact on mosquito life expectancy, significantly increasing their mortality rate. Clearly it can be argued that the strict control measures implemented in 2005 were still in action in 2006 and contributed to the low number of cases observed that year. However, several of the stringent measures adopted in 2005 were relaxed in the following years, therefore both the expected outbreak in 2006 that did not occur, and the recrudescence in the number of cases observed in 2007 still require explanation. We hypothesize that the unusually intense 2006 haze caused a great increase in mosquito mortality. This could explain the unexpectedly very low number of dengue cases in 2006, causing an accumulated number of susceptible individuals. A particularly favourable environmental condition in 2007 could have reduced mosquito mortality (in accord with the range of mosquito mortality reported in the literature [Reference Rodhain, Rosen, Gubler and Kuno4]) or, alternatively, increased the carrying capacity of mosquitoes. This association of favourable environmental conditions with a greater number of susceptible individuals is sufficient to explain the subsequent outbreak in 2007.
Whether or not the unusually intense haze of 2006 caused a great increase in mosquito mortality, an explanation of the unexpectedly very low number of dengue cases in 2006 should be considered for debate.
MATERIAL AND METHODS
The predictive model
The model's dynamics presented in [Reference Burattini2] are a modified version of previous models [Reference Coutinho5, Reference Coutinho6]. The structure, i.e. the number of compartments, transition rates, etc., is the same as the previous models [Reference Coutinho5, Reference Coutinho6]. However, there is a very important difference. In [Reference Burattini2], the average mosquito population was allowed to increase slowly with time. This included a new variable, which made the system in [Reference Burattini2] non-autonomous in addition to the non-autonomous terms that simulated seasonality presented in the models in [Reference Coutinho5] and [Reference Coutinho6]. This is discussed in more detail in [Reference Burattini2]. We applied this model to test the hypothesis proposed to explain both the low number of dengue cases in 2006 and the high number of cases observed so far in 2007.
The populations involved in the transmission are human hosts, mosquitoes, and their eggs (the latter includes the intermediate stages, e.g. larvae and pupae). The population densities, therefore, are divided in the following compartments: susceptible humans, denoted S H; infected humans, I H; recovered (and immune) humans, R H; total humans, N H; susceptible mosquitoes, S M; infected and latent mosquitoes, L M; infected and infectious mosquitoes, I M; non-infected eggs, S E; and infected eggs, I E.
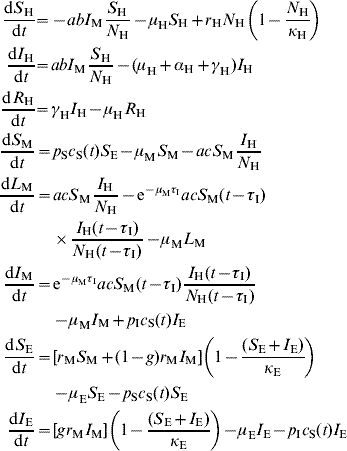
The model's equations are:

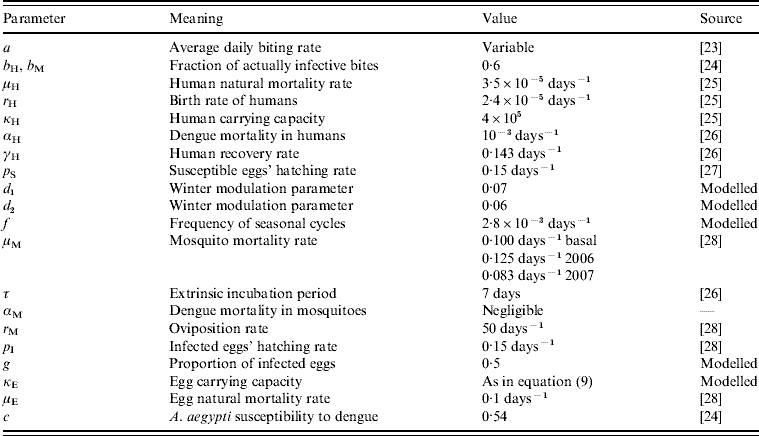
where c S(t)=(d 1 – d 2 sin(2πft+ϕ))θ(d 1 – d 2 sin(2πft+ϕ)) is a climatic factor mimicking seasonal influences in the mosquito population (see below and references [Reference Burattini2, Reference Coutinho6]) and θ is the Heaviside function [Reference Coutinho6]. Those and the remaining parameters are explained in Table 1.
Table 1. The parameters notation, biological meaning and values applied in the simulations

Briefly, we describe some features of the model.
Susceptible humans grow at the rate {r HN H[1−(N H/κH)] – μHS H}, where r H is the birth rate, μH is the natural mortality and κH is related to the human carrying capacity as explained below.
Humans are subject to a density-dependent birth rate and a linear mortality rate. The population dynamics in the absence of disease is
where r H is the birth rate of humans, N H is the total human population, κH is a constant and the human carrying capacity is [(r H – μH)/r H]κH.
Note that we are assuming that close to the carrying capacity the human population growth is checked by a reduction in the birth rate. Alternatively, the control of the population could be done by a term including density dependence in the mortality rate and equation (2) could be written as
which can be interpreted as density dependence in the mortality rate. However, the net result would be qualitatively the same.
Those susceptible humans who acquire the infection do so at the rate [abI M(S H/N H)], where a is the average daily biting rates of mosquitoes and b H is the fraction of actually infective bites inflicted by infected mosquitoes, I M.
The second equation of model 1 describes infected humans, I H, who may either recover, at rate γ, or die from the disease, at rate (μH+αH).
The third equation of system 1 describes recovered humans, who remain recovered for the rest of their lives.
The fourth, fifth and the sixth equations of system 1 represent the susceptible, latent and infected mosquito population densities, respectively. Susceptible mosquitoes vary in size with a time-dependent rate
The term μM is the natural mortality rate of mosquitoes. The term p SS E is the number of eggs hatching per unit time, and which survive beyond the intermediate stages (larvae and pupae). The term c S(t) simulates the seasonal variation in mosquito production from eggs (see below).
Those susceptible mosquitoes that acquire the infection do so at the rate [acS M(I H/N H)], where a is the average daily biting rates of mosquitoes and c is the fraction of bites inflicted by susceptible mosquitoes on infected humans that result in infected mosquitoes. Infected mosquitoes acquire the infection after biting infected humans at a rate [acS M(I H/N H)], spending some time in a latent period, called the extrinsic incubation period. The fraction of those latent mosquitoes that survive the extrinsic incubation period, with a given probability [exp(–μMτI] become infective. Therefore, the rate of mosquitoes becoming infective per unit time is
The term p II E is the number of infected eggs hatching per unit time, and which survive beyond the intermediate stages (larvae and pupae).
The seventh and the eight equations represent the dynamics of susceptible and infected eggs, respectively.
In the seventh equation, the term
represents the oviposition rate of susceptible eggs born from susceptible mosquitoes at rate
and from a fraction (1 – g) of infected mosquitoes at rate
The parameter g, therefore, represents the proportion of infected eggs laid by infected female mosquitoes.
The term r MS M represents the maximum oviposition rate of female mosquitoes with the number of viable eggs being checked by the availability of breeding places by the term {1 – [(S E+I E)/κE]}. As in the case of humans, the eggs' carrying capacity is [(r E – μE)/r E]κE, where κE varies with time. Once again we choose a density dependent on birth rather than on death. Again, control of the population could be done by a term including density dependence in the mortality rate, but the net result would be qualitatively the same.
Finally, in the last equation the term
represents the net rate by which infected eggs are produced by infected adult females, i.e. vertical transmission of dengue virus.
RESULTS
Both the hypothesis related to the higher mortality of adult mosquitoes in 2006 and the hypothesis related to lower mortality of adult mosquitoes in 2007 were tested with the proposed model. This was done by simulating a sudden increase in the mosquito mortality rate in the model, followed by a sudden decrease in the same parameter after a period corresponding to 1 year. The model permits this since no regulatory mechanism (e.g. carrying capacity) was introduced for the adult mosquito population, in contrast with larval stages or human individuals, where there is an explicit regulation (carrying capacity) in the model. This was done deliberately because of the great variability reported in the literature for the life expectancy of adult mosquitoes.
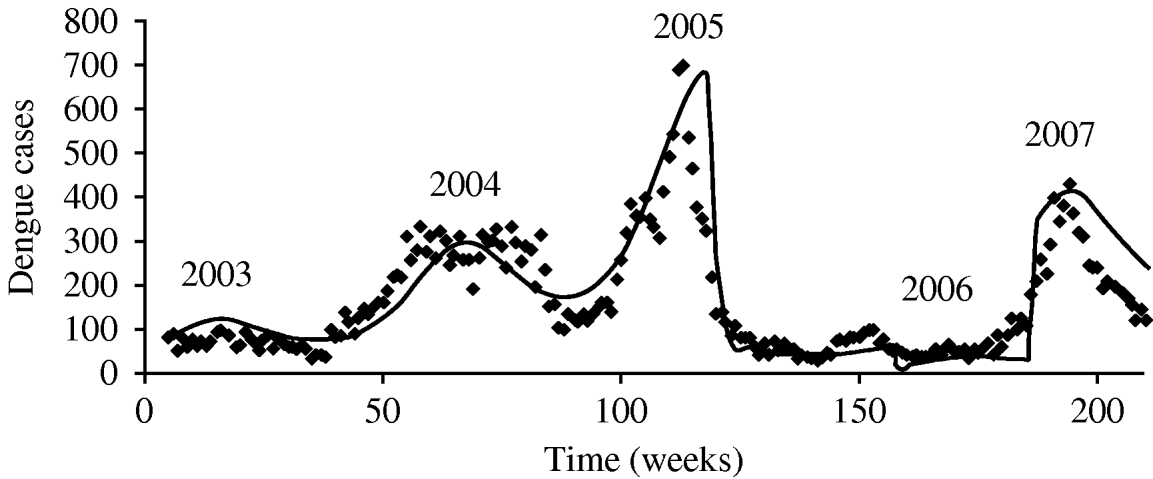
The parameter notation, biological meaning and values applied in the simulations are shown in Table 1. The result of such simulation can be observed in Fig. 2.

Fig. 2. Test of the proposed hypotheses with the model described in Burattini et al. [Reference Burattini2].
Figure 2 shows the model's accuracy in reproducing the outbreaks of 2003–2005. Around week 150 we increased the mosquito mortality rate by 15%, keeping it in those levels for some weeks, reducing it to a level 2% lower than that used to simulate the 2005 outbreak. Using these measures we simulated the sudden reduction in mosquito mortality rate that we believed occurred in 2006, with selection of more resistant mosquitoes that could explain the 2007 outbreak. The model-derived mosquito population curve is similar in shape as that for human cases with a small delay. It is not included here because of a lack of real data to compare it with.
DISCUSSION
Several mathematical and statistical efforts have been used together with time series of dengue in other parts of the world [Reference Chowell7, Reference Chowell8]. In a previous paper [Reference Burattini2] we provide expressions and estimations for the basic reproduction number for dengue in Singapore. We found values around 1·5, which is in accord with estimates from reports from other parts of the world [Reference Chowell7–Reference Coelho10].
Bushfire is an important tool for limiting woody plant invasions, but using fire to maintain grassland plant community reduces arthropod diversity [Reference Hartley11]. We understand that haze is smoke plus other climatic factors and that we can have smoke without haze but not the opposite.
Smoke is anecdotally claimed to repel biting insects [Reference Davis and Bowen12–Reference Biran14]. Burning plant tissue to generate smoke is a common practice to avoid mosquito bites [Reference Tabuti15]. In support of this several authors have demonstrated the repellent action of burning plants and plant products. Dulhunty et al. [Reference Dulhunty16] interviewed 124 individuals in central Malaita, and the Solomon Islands where 52% of respondents reported using fire to protect themselves from mosquitoes. In addition, Pålsson & Jaenson [Reference Pålsson and Jaenson17] investigated the plant species and plant-derived products used by people to reduce mosquito-biting activity in 23 rural villages of Guinea–Bissau. The authors concluded that smoke from the bark of Daniellia oliveri Rolfe (Caesalpiniaceae), smoke from the infructescence of Elaeis guineensis Jacq. (Arecaceae), smoke from the seed capsules of Parkia biglobosa (Jacq.) Benth. (Mimosaceae), smoke from the leaves of Azadirachta indica [A. Juss (Meliaceae)] and Eucalyptus sp. (Myrtaceae) were significantly more effective in their repellent activity than negative control.
Therefore, it seems to be a well-documented fact that smoke acts in successfully reducing contact between people and disease vectors.
Several confounding variables not analysed here could explain the reduction in the expected number of cases in 2006, the most important of which is the set of actions implemented by local health and environmental authorities aimed at reducing the mosquito population. Those same control measures might select for more resistant mosquitoes, although this has not been reported so far, which could explain the recrudescence of dengue in 2007. However, this would imply that those measures were relaxed in 2007 and we know that they are still in place. Another hypothesis would be that, as a consequence of the reduction of dengue cases observed in 2006, the proportion of remaining susceptible individuals would be higher than expected for 2007, triggering the observed outbreak to be more severe than predicted. However, the difference of 3500 dengue cases between the expected and the actual figures for 2006 would not be enough to significantly modify the remaining number of susceptibles in Singapore.
Therefore, another explanation for both the sudden reduction in the number of cases in 2006 and its increase in 2007 is needed. We believe that our hypotheses can cope with both the 2006 and 2007 outbreaks.
In fact, it should be mentioned that periods of severe drought would both increase the frequency and severity of hazes and reduce mosquito viability [Reference Luz18–Reference Forattini20], causing an important confounding effect.
In addition, if transmission of dengue in Singapore occurs predominantly outside the home, as is currently believed [21], then a severe haze as that of 2006, which kept people inside their homes could also indirectly reduce exposure to mosquito bites. Moreover, haze could significantly reduce local temperature, thereby increasing mosquito mortality. However, these are other hypotheses that should be explored in a different way.
We understand that haze has deleterious effects on health and therefore we are not suggesting that haze could be artificially created to reduce dengue transmission.
The possibility of an invasion of a new dengue virus strain in 2007 should be mentioned, to which a substantial proportion of the population would be susceptible. This would eventually explain the 2007 outbreak, although the Singapore population has long been subjected to the circulation of four dengue serotypes [Reference Wilder-Smith22].
Ideally we should include studies showing shorter longevity of the vector under haze conditions. However, no such studies are available in the current literature. In fact, one of the objectives of this work was to raise issues and promote future studies, by proposing haze as a possible factor influencing dengue transmission. In conclusion, our hypothesis should be tested by entomologists, who could provide experimental evidence for the eventual role of haze on mosquito mortality.
Finally, we emphasize that all models are more or less crude speculations and our intention with this proposal is only to submit a hypothesis to explain the unexpectedly low number of dengue cases in 2006. Its plausibility is open for debate.
ACKNOWLEDGEMENTS
This work was supported by LIM01-HCFMUSP, CNPq, FAPESP and the Courage Fund for Infectious Diseases.


