


Introduction
In recent years, there has been a global push to transition from fossil fuels to renewable sources of energy. This process often requires energy transmission over long distances, i.e. from the location of origin (e.g. offshore wind parks or hydroelectric power plants) to existing consumers (e.g. urban agglomerations or industries). To achieve this goal, the German power transmission grid is currently undergoing significant expansion, with dozens of individual projects planned or already under construction, either as subsurface or overhead powerlines. Many of these powerlines are projected to reach a length of several hundred kilometres. This means that even small effects on the environment may potentially add up to a considerable impact. One possible effect of overhead transmission lines is the avoidance of powerlines by the Eurasian Skylark Alauda arvensis (hereafter Skylark), which may result in diminishing habitat availability. While evidence of this effect is hitherto inconclusive, the assumed impact on Skylarks currently influences decision-making in infrastructure planning and licensing, at least in Germany.
The Skylark was originally adapted to open plains but also found optimal habitats in extensively used agricultural landscapes of central Europe (Erdős et al. Reference Erdős, Báldi and Batáry2009; Gedeon et al. Reference Gedeon, Grüneberg, Mitschke, Sudfeldt, Eickhorst and Fischer2014), particularly before the intensification and industrialisation of agriculture since the mid-twentieth century. This species naturally avoids forests and comparable vertical structures (e.g. settlements), possibly to avoid forest-dwelling predators and predatory birds that use vertical structures as raised stands, respectively (Chamberlain and Gregory Reference Chamberlain and Gregory1999; Csikós and Szilassi Reference Csikós and Szilassi2021; Piha et al. Reference Piha, Pakkala and Tiainen2003; Renfrew et al. Reference Renfrew, Ribic and Nack2005). According to a foundational study by Oelke (Reference Oelke1968), natural avoidance occurs within a 160–220 m radius around vertical structures. This distance correlates with the structure’s footprint, whereas single standalone trees or buildings do not elicit avoidance (Glesener et al. Reference Glesener, Gräser and Schneider2023; Oelke Reference Oelke1968).
In a study specific to Germany, overhead powerlines are believed to have an effect on the Skylark that is analogous to that of forest edges, potentially leading to a loss of breeding territories. Oelke (Reference Oelke1985) reports a complete absence of Skylark territories within 100–200 m of high voltage powerlines. Avoidance of powerlines was also reported by Dreesmann (Reference Dreesmann1995) and Altemüller and Reich (Reference Altemüller and Reich1997). Dreesmann (Reference Dreesmann1995) described a significant negative correlation between territory density and presence of powerlines on surveyed plots, while Altemüller and Reich (Reference Altemüller and Reich1997) observed a higher density of singing males on agricultural plots not crossed by powerlines, as well as an inverse relationship between higher frequency of singing males and distance from a powerline.
Despite reports of avoidance of overhead powerlines, a clear understanding of the strength and range of this putative effect is lacking. Moreover, we lack knowledge of underlying mechanisms because previous studies could not ascertain if avoidance behaviour may be elicited by the powerlines (to avoid powerline collision) or their pylons (that potentially serve as raptor stands). This knowledge gap has led to speculative assumptions in conservation and infrastructure planning, but adherence to overtly conservative standards concerning the required distance between powerlines and conservation measures (e.g. flower strips; see MULNV 2021; StMUV 2023) can be problematic in an anthropogenic-dominated landscape where areas for such conservation measures that are both available and suitable can be difficult to find.
Here, we investigated powerline avoidance by the Skylark in a central European agricultural landscape with a total survey area of 1,230 ha, including a total powerline length of c.26.5 km. Specifically, we asked whether Skylarks display avoidance behaviour around powerlines, and if yes, if this can be attributed to either the pylons or the actual powerlines.
Methods
Study area
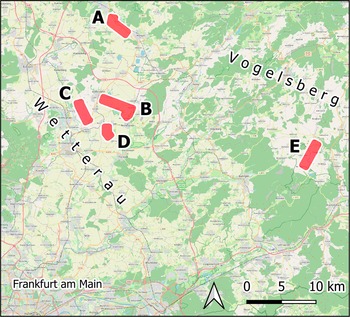
We surveyed five separate plots in 2020 within the agrarian landscapes of the Wetterau and Vogelsberg, north and north-east of Frankfurt am Main, Germany, respectively (Figure 1). This region was chosen because it comprises generally suitable habitats for Skylarks with >50% of the area classified as open landscape.

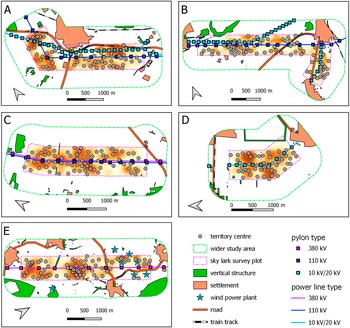
Figure 1. The five survey plots in the agricultural landscapes of Wetterau and Vogelsberg in central Germany. A: Hungen; B: Wölfersheim; C: Dorheim; D: Weckesheim; E: Waldensberg. (Basemap: Open Street Map 2024)
The survey plots had a length of 1.6–3.8 km and a general width of 700 m with one centrally situated powerline of 20–380 kV, or two powerlines in parallel. In some cases, minor powerlines (10 kV/20 kV) also run through the surveyed plots. The pylon heights varied between 60–70 m (Dorheim) and 50–60 m (Waldensberg) for the 380 kV powerlines, 28–32 m for the 110 kV powerlines, and were c.11 m for the 20 kV powerlines. See Figure 2 for pylon configurations.
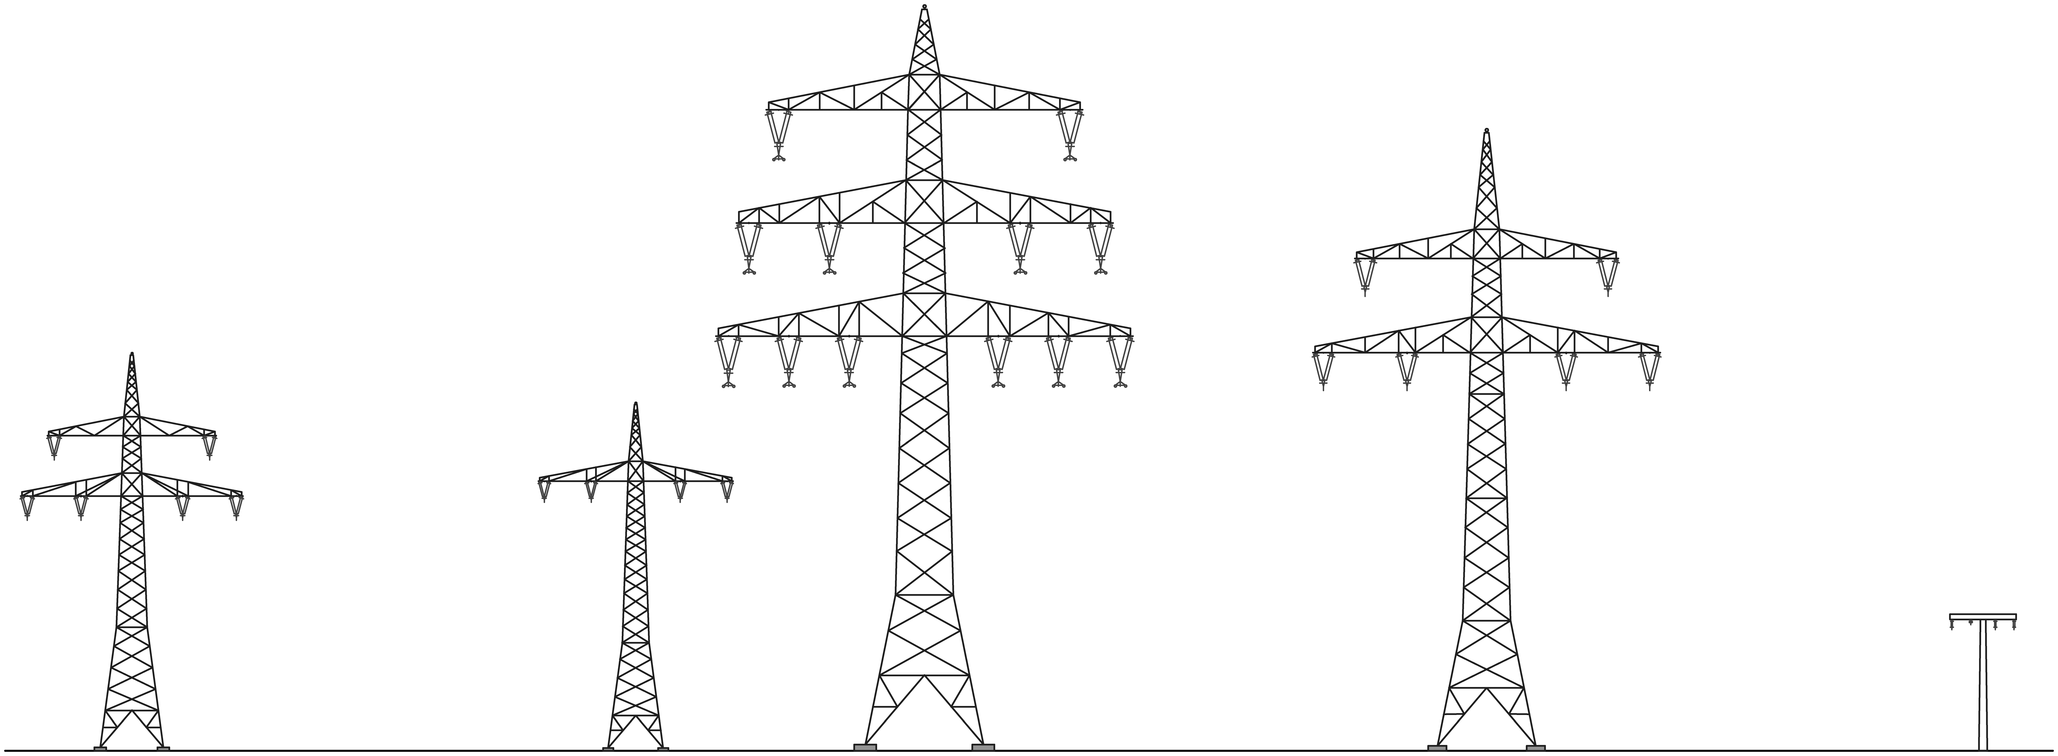
Figure 2. Examples of pylon configurations. From left to right: 110 kV pylon (survey plot Hungen; Figures 1A and 4A), pylons of parallel running 110 kV and 380 kV powerlines (survey plot Dorheim, distance between pylons not to scale; Figures 1C and 5C); 380 kV pylon (survey plot Waldensberg; Figures 1E and 4E), and 20 kV concrete pylon (survey plot Weckesheim; Figures 1D and 4D). Pylon height only approximately drawn to scale, as heights can vary along the same powerline.
During the surveys (Table 1) we also mapped vegetation type in the survey area. These were classified in the following categories: meadow; wildflower strips; pastures; winter grain; rapeseed; legumes; fresh sowing; fallow ground; rose cultivation. Additionally, we mapped structures that could potentially influence Skylark density (i.e. hedges, trees, forests, farm buildings, settlements, roads, wind and solar power units) in the wider study area up to c.500 m around each survey plot. We did this using aerial photography (Google maps 2020) and field verification. Train tracks running parallel to roads were not considered separately in the analysis.
Table 1. Survey dates in 2020 for the five surveyed plots. Additionally, land cover was mapped on the second date (in bold)

Mapping of territories
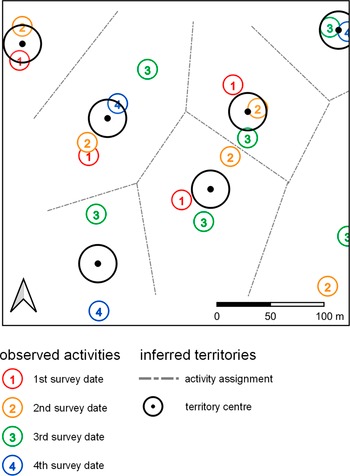
Mapping of Skylark territories was conducted on four consecutive survey dates between the end of March and the end of June 2020 (Table 1), thus covering the duration between initial territory formation to secondary breeding (following the approach outlined by Andretzke et al. Reference Andretzke, Schikore, Schröder, Südbeck, Andretzke, Fischer, Gedeon, Pertl and Linke2005 and Fischer et al. Reference Fischer, Flade, Schwarz, Südbeck, Andretzke, Fischer, Gedeon, Pertl and Linke2005). We observed singing males and mapped landing points as indicators of “activity” (Figure 3). To supplement this, further observations were noted as “activities”, including territorial fights, identified nesting sites, alert calls or presence of feeding adults. Territory centres were identified manually as approximate mid-points of activities observed on different survey dates (based on an overlay of activity maps from at least three survey dates). Activities were assigned to a specific territory when in spatial relation and were not situated more than 100 m from each other (Figure 3). Additionally, specific observations were considered, such as simultaneous sightings of nest building individuals. In a few cases, two activity points were considered sufficient to locate the centre of a territory, specifically when activity points were only a few metres apart and/or additional observations allowed the identification of a nesting site.
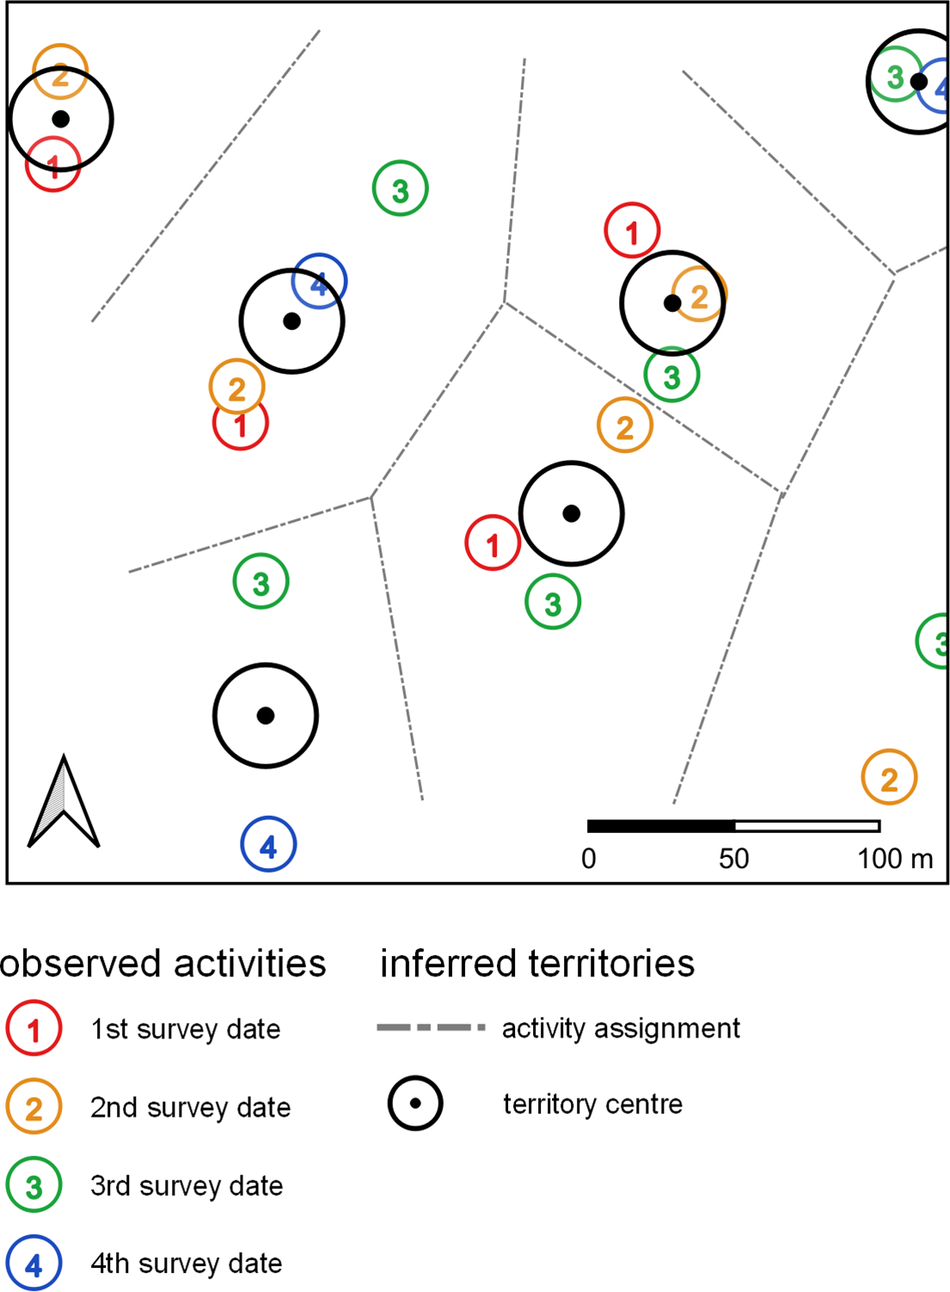
Figure 3. An example of territory centre inference from consecutive observed activities. Note that we did not infer territory boundaries.
To better visualise areas generally preferred by Skylarks we ran a kernel density estimation in QGIS v3.24 using the location of territory centres. We set a kernel bandwidth of 200 m (specifying the distance around a point at which the influence of the point will be felt) and a quartic kernel shape (controlling the rate at which the influence of a point decreases as the distance from the point increases) (see Figure 4).
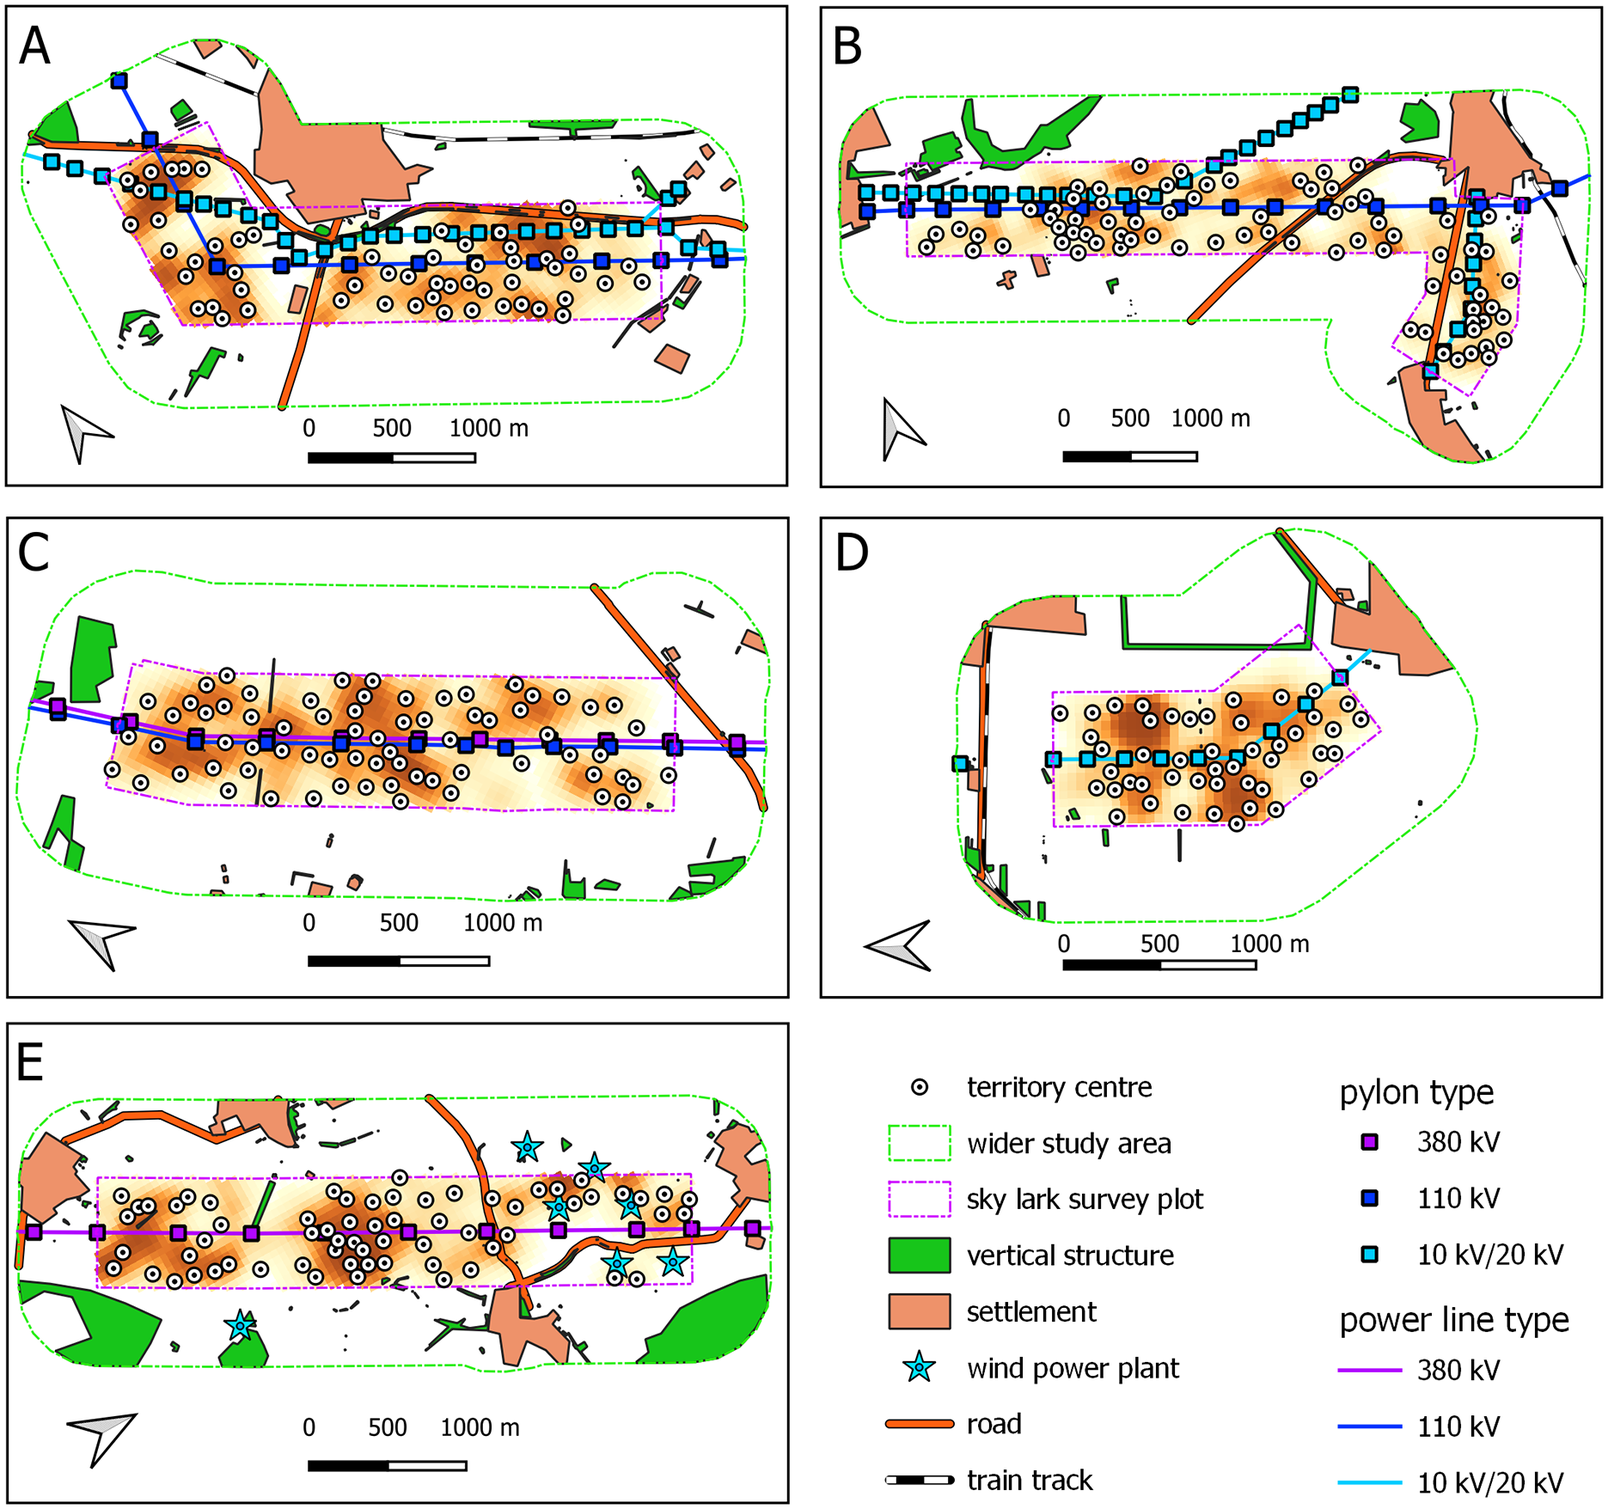
Figure 4. Territory centres and modelled territory density within the five surveyed plots. A: Hungen; B: Wölfersheim; C: Dorheim; D: Weckesheim; E: Waldensberg.
Geospatial and statistical analysis
We quantified the relationship between the distribution of Skylark territories (represented by territory centres, see above), by dividing survey plots into equal-sized cells measuring 50 × 50 m. This yielded a total of 6,299 cells, amongst which, 314 overlapped with territory centres (see Supplementary material). Cells overlapping with territory centres were assigned values of 1, while cells that do not overlap with territory centres were assigned a value of 0. These constitute a binary response variable that is reflective of territory distribution across the survey area.
In addition, we recorded potential predictors from each cell, comprising: (1) distance from the nearest powerline; (2) distance from the nearest pylon; (3) distance from the nearest road; (4) distance from the nearest vertical structure; (5) distance from the nearest wind energy plant; (6) distance from the nearest settlement; (7) nearest pylon type (categorised according to corresponding powerline voltage as proxy of pylon dimension, i.e. 10 kV/20 kV, 110 kV, and 380 kV); (8) vegetation type. For vegetation type, we assessed each of the nine categories separately as dummy binary variables (i.e. wildflower strip, fallow/uncultivated land, legumes, unidentified fresh-sowed cereal/spring cereal, rapeseed, cultivated roses, pasture, unidentified winter grain, and meadow). For example, in a cell where winter grain was present, a value of 1 was scored under the winter grain dummy variable, and values of 0 were attributed to all other vegetation types. Pylon type was similarly assessed as three separate dummy binary variables.
We tested potential predictors of Skylark territory presence by parameterising the following binary logistic regression models:
 $$ Log\left(\frac{p_i}{1-{p}_i}\right)={\beta}_0+{\beta}_1{lon}_{\mathrm{i}}+{\beta}_2{lat}_i+{\beta}_3{X}_{\mathrm{i}} $$
where pi represents the probability of Skylark territory occurring in the i-th cell, while loni and lati represent the respective coordinates, and Xi represents values of predictors (1) to (8) measured at i. Here, we are interested in parameterising β3, which describes the statistical relationship between p and X. A non-zero β3 suggests “statistical significance”. We adopted a Bayesian approach to model parameterisation, and attributed “statistical significance” to parameters with posterior distributions that have 95% credible intervals that do not overlap with zero. To simplify matters, we will henceforth adopt the frequentist terminology of “statistically significant” in the text. In these models, we included coordinates as covariates to account for possible spatial autocorrelation, which is when patterns in the distribution of territory centres are not independent of their relative distances to each other, potentially leading to spurious outcomes.
We compared these models against the following “null” model parameterised only by spatial coordinates:
 $$ Log\left(\frac{{\mathrm{p}}_i}{1-{\mathrm{p}}_i}\right)={\beta}_0+{\beta}_1{lon}_i+{\beta}_2{lat}_{\mathrm{i}} $$
We identified useful predictors of Skylark territory centres’ occurrence by shortlisting predictive models (Eq 1) that perform better than the “null” model (Eq 2) for further scrutiny. Model performances were assessed using the efficient approximate leave-one-out (LOO) score (Vehtari et al. Reference Vehtari, Gelman and Gabry2017), with lower scores indicating better model performance.
Results
The mapping resulted in the inference of 314 territory centres within surveyed plots, and an additional 37 territory centres close to, but outside the survey plots’ borders that were not included in subsequent analyses. The overall mean was 2.55 territory centres per 10 ha (SD = 0.83) and is thus in line with a previous study that reported territory densities for the Skylark in Wetterau and Vogelsberg of between 1.5 and 3.0 territories per 10 ha (Bernshausen et al. Reference Bernshausen, Kreuziger, Schreiben, Stübing, Korn and Richarz2010).
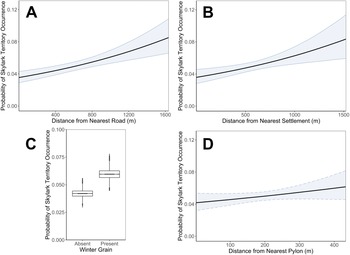
Of the eight predictors for Skylark territory occurrence tested, only four were useful, i.e. distance from the nearest road, distance from the nearest settlement, distance from the nearest pylon, and vegetation type. Among the informative predictors, we found that distances from the nearest roads and settlements were positively correlated with probability of territory centre occurrence, and this relationship was statistically significant with 95% credible intervals for slope parameters of 3.08 × 10˗4<β3(road)<8.33 × 10˗4, and 1.79 × 10˗4<β3(settlement)<9.02 × 10˗4, respectively. This suggest that Skylarks were more likely to establish territories further from roads and settlements (Figure 5A and B). On the other hand, distance from the nearest pylon improves model performance relative to the “null” model, but correlations with the probability of territory centre occurrence is statistically indistinguishable from zero (˗3.27 × 10˗4<β3(pylon)<2.13 × 10˗3; Figure 5D). This suggests that pylons do not have a detectible effect, positive or negative, on the occurrence of Skylark territories.

Figure 5. A, B, and D: logistic regression models describing the relationship between probability of Skylark territory centre occurrence and distances from the nearest road (A), settlement (B), and pylon (D), respectively, while keeping spatial coordinates constant. Solid blue lines (in A and B) are indicative of the upper and lower boundaries of 95% credible intervals in statistically significant outcomes (i.e. 95% credible intervals of slope parameters do not overlap with zero), while dashed blue lines (in D) represent 95% credible intervals of non-statistically significant outcomes. Solid black lines represent the models’ median slope. C: posterior distributions of the probability of territory centre occurrence in areas where winter grain is absent and present, respectively.
While our data showed that vegetation type improves model performance for all categories apart from legumes, rapeseed, and cultivated roses, only winter grain presence was a statistically significant predictor of territory occurrence (1.39 × 10˗1<β3(winter grain)<6.09 × 10˗1). A positive slope parameter estimate suggests that Skylarks are more likely to establish territories in areas where winter grain is present (Figure 5C).
Discussion
There is extensive literature available on the habitat requirements of the Skylark. For instance, published evidence suggests that Skylarks prefer small agricultural plots (Eraud and Boutin Reference Eraud and Boutin2002; Schläpfer Reference Schläpfer1988), and/or areas with greater crop diversity (Chamberlain et al. Reference Chamberlain, Vickery and Gough2000). Studies on the effect of winter grain on the number of Skylark territories are contradictory (Chamberlain et al. Reference Chamberlain, Vickery and Gough2000; Donald and Vickery Reference Donald, Vickery, Aebischer, Evans, Grice and Vickery2000). For instance, winter grain had been associated with higher densities of territories, but the crop can also be disadvantageous, contributing to lower numbers of secondary broods (Donald and Vickery Reference Donald, Vickery, Aebischer, Evans, Grice and Vickery2000; Jenny Reference Jenny1990), or the abandoning of broods altogether.
Our findings indicate Skylark preference for areas with winter grain. This pattern confirms the general preference for areas that are sparsely covered by vegetation during the early stages of the bird’s reproductive season (Jenny Reference Jenny1990; Töpfer and Stubbe Reference Töpfer and Stubbe2001). We did not monitor reproductive success within territories, so we do not exclude the possibility that winter grain – in contrast to spring-sown cereals – may ultimately be detrimental to brood numbers and brood survival that is most likely determined by final height and density of the vegetation at nesting sites (Jenny Reference Jenny1990; Stöckli et al. Reference Stöckli, Jenny and Spaar2006). Also, we did not differentiate between types of winter grain (e.g. wheat, barley, etc.) that may have different effects on breeding success.
We did not find a correlation between distance to vertical structures and territory centre occurrence. Probably, relevant structures are mostly situated too far from the surveyed area, such that corresponding avoidance behaviour cannot be captured within our study design. Considering an estimated avoidance of vertical structures up to a distance of c.100–230 m (Oelke Reference Oelke1968) or 300 m (Glesener et al. Reference Glesener, Gräser and Schneider2023), most larger vertical structures are further away from the present survey areas (Figure 3). Also, the strength of avoidance of vertical structures is considered to be dependent on the structure’s extent (Oelke Reference Oelke1968), with strong effects towards structures that exceed 5,000 m2 (Glesener et al. Reference Glesener, Gräser and Schneider2023). As we also included vertical structures smaller than forest edges (e.g. larger hedges, tree groupings), there might have been too much noise in the data to capture avoidance.
Powerlines have been shown to impact birds in open landscapes, resulting in the alteration of their movement, avoidance behaviour, and consequently the size of suitable habitats (Pruett et al. Reference Pruett, Patten and Wolfe2009). However, based on the present empirical data, these effects are not applicable to the Skylark. We could not detect any comparable avoidance behaviour towards transmission powerlines, nor the pylons. These results corroborate previous observations of territories directly beneath powerlines (Bräuning Reference Bräuning1999; present data), with nesting sites located even within pylon squares when the surrounding habitat was otherwise unsuitable (personal observation BJ).
Our findings are in contrast with earlier interpretations of observed Skylark territory distribution in the presence of powerlines (Altemüller and Reich 1997; Dreesmann Reference Dreesmann1995; Oelke Reference Oelke1985). The differing results may be explained, at least in part, by differences in study design, analysis, and interpretation of data. Oelke (Reference Oelke1985) surveyed c.1,600 ha in 1961 and 1985. The 1985 study reported an absence of Skylark territories within a 100–200 m distance of a 220 kV powerline (already present in 1961) and a 380 kV powerline built between the 1961 and 1985 surveys. As there was a strong and uniform loss of territories across the entire survey area between both occasions (Oelke Reference Oelke1985), it is difficult to attribute this specific absence of territories to avoidance behaviour towards the powerlines. Moreover, the length of time between surveys was considerable (24 years) during which other environmental changes occurred that may have resulted in the loss of territories. For instance, there was a steady expansion of settlements as well as a 410% increase in paved roads within the surveyed plot between 1961 and 1985 (Oelke Reference Oelke1985), both of which we found to have a negative association with Skylark territories.
Dreesmann (Reference Dreesmann1995) did not report details of the survey conducted (exact location of surveyed plots, mapped territories and powerlines) in sufficient detail to allow us to reproduce the analysis, which is unfortunate given the vast area surveyed (c.10,000 ha). Based on the information available, we found some aspects of the study design to be potentially incompatible with a robust test of avoidance behaviour. Firstly, the individual surveyed plots were large (c.250 ha) compared with our study, chosen randomly, and were not designed to specifically explore powerline avoidance, so it is possible that most of the surveyed area may be too far from powerlines, or was only intersected by the lines marginally. Additionally, the interpretation of the data may be confounded by the disproportionally high presence of powerlines in surveyed plots that according to Dreesmann (Reference Dreesmann1995) already showed significantly lower territory density due to larger land parcels (a negative correlation of agricultural plot size and territory density being in line with the findings of Eraud and Boutin Reference Eraud and Boutin2002; Schläpfer Reference Schläpfer1988; Schön Reference Schön2004).
A more systematic approach was applied by Altemüller and Reich (Reference Altemüller and Reich1997), explicitly investigating powerline avoidance behaviour by the Skylark. The authors investigated potential avoidance on a 400-ha plot of open landscape in northern Germany which was 3.6 km in length and centrally traversed by a 110 kV powerline. They observed a significantly higher frequency of singing males in areas more distant to the powerline (>100 m) and a significantly higher density of singing males on agricultural plots not crossed by the powerline. However, the data set of Altemüller and Reich (Reference Altemüller and Reich1997) is based on the initial mapping of singing males (i.e. activity points in the present study) instead of inferred territory centres, which can be more challenging to interpret under certain conditions. For example, it is unclear if the sightings of singing males were mapped over the course of several surveys or a single survey. If singing males were mapped over multiple surveys, the data may be pseudoreplicated if individuals were represented more than once in the data set. On the other hand, data from a single survey would only be representative of a snapshot of a highly dynamic process of territory formation and/or of the spatial variability among singing males within their territories. Consequently, there may be considerable noise in the data which is less than ideal for detecting statistical signals that are indicative of avoidance behaviour. This work also excludes other factors that may influence the distribution of Skylark territories (e.g. roads and settlements that we confirmed as being significant predictors of territory distribution).
Our findings suggest that powerlines are unlikely to lead to significant loss of Skylark habitat. However, we note that our study area represents a suitable habitat with a comparably high population density (Bernshausen et al. Reference Bernshausen, Kreuziger, Schreiben, Stübing, Korn and Richarz2010), so we do not exclude the possibility that in landscapes with lower population densities, male birds may potentially establish territories further away from powerlines that may present a possible obstacle to the male birds’ song flights. Nevertheless, this pattern would be rather a consequence of lower territory numbers, and not its cause.
In infrastructure planning, it is often assumed that 50–100% of Skylark territories are completely lost within a 100-m distance of overhead powerlines (Runge et al. Reference Runge, Baum, Meister and Roogardt2012), although neither Dreesmann (Reference Dreesmann1995) nor Altemüller and Reich (Reference Altemüller and Reich1997) report a complete absence of territories adjacent to, or directly beneath powerlines. Consequently, German licensing authorities demand that Skylark-specific conservation measures, like wildflower strips, are kept at a minimum distance of 100 m from powerlines, or even >200 m where pylons are taller than 60 m, despite the assumption that these strips are preferred habitats (LBM 2021; MULNV 2021; StMUV 2023). Such worst-case assumptions (in the absence of a sound empirical basis) can make it difficult to find suitable areas to implement conservation measures (e.g. establishing habitat area), especially in a landscape that is already characterised by an abundance of infrastructure and settlements. Based on our present data, we propose that the consideration of such arbitrary minimum distances between conservation measures and powerlines should be abandoned because powerlines do not have a significant effect on the probability of territory occurrence. On the other hand, the present data indicate that conservation measures should be established distant to roads and settlements. However, our study was not designed to draw conclusions on possible threshold values.
In fact, it is generally agreed that the intensification of agriculture is the main driver of the dramatic declines in the Skylark in central Europe since the second half of the twentieth century as habitats are degraded by land consolidation, intensive use of nitrogen fertilizer and pesticides, monocropping, as well as a reduction in fallow land due to continuous crop rotation (Chamberlain and Crick Reference Chamberlain and Crick1999; Glesener et al. Reference Glesener, Gräser and Schneider2023). These led to an estimated 50–90% reduction of the Skylark population in western and central Europe between the 1970s and 1990s of the previous century (Bauer and Berthold Reference H.-G and Berthold1996), with a continued decline of 60% in the whole of Europe from 1980 to 2022 (PECBMS 2024). Notably, Skylarks are still present throughout German open land habitats (Gedeon et al. Reference Gedeon, Grüneberg, Mitschke, Sudfeldt, Eickhorst and Fischer2014; Gerlach et al. Reference Gerlach, Dröschmeister, Langgemach, Borkenhagen, Busch and Hauswirth2019). The population in these areas, however, was estimated to have suffered a reduction of c.38% between 1990 and 2015 resulting in an average density of only 0.6–1.0 territories/10 ha (Gerlach et al. Reference Gerlach, Dröschmeister, Langgemach, Borkenhagen, Busch and Hauswirth2019).
In the long-term, the persistence of Skylarks in central European open landscapes would likely require a fundamental change in industrial agricultural practices. Unfortunately, this may be impossible to achieve on a large scale in the near future because of the apparently irreconcilable differences between conservation and economic interests, at least in the short term. Nevertheless, specific conservation measures in priority areas, including those supporting extensified agriculture, flower strips or fallow areas, are promising for stabilising Skylark populations (Glesener et al. Reference Glesener, Gräser and Schneider2023). Importantly, the planning and implementation of these measures should not be hampered by constraints imposed because of hypothetical, and likely inaccurate assumptions about Skylark avoidance of powerlines.
Supplementary material
The supplementary material for this article can be found at http://doi.org/10.1017/S0959270925000036.
Acknowledgements
The data for this study were collected as part of CM’s master’s thesis. We thank Nico Blüthgen, Technical University of Darmstadt, Germany, for co-supervision.
Competing interest
SK works as an environmental adviser for TenneT TSO GmbH. However, TenneT was not involved in any stage of this project, and did not provide any funding.


 Open access