

The Chairman (Mr M. I. Aitchison, F.F.A.): I am a member of the Risk Management Practice Board of the IFoA.
The paper we are discussing has been prepared by the Joint Risk Reporting Working Party. They are going to take us through the paper and some associated insights in the area of incentives facing UK-listed companies to comply with the risk reporting provisions of the UK corporate governance code.
Following, we will have a question and answer session. We have two panel members, one from the life industry and one from pensions, to give us some perspectives on the issues.
The chair of the Working Party is with us, Professor Paul Klumpes. Paul is Professor of Financial and Risk Accounting at Nottingham Business School, Nottingham Trent University. Previously he was Professor of Accounting at EDHEC Business School, Roubaix, France. Before that he was Professor of Accounting at Imperial College London, and Professor of Risk Accounting at Nottingham University Business School. He holds an LLB (Hons) from the Open University, a BCom (Hons), MCom (Hons) and PhD in Accounting from the University of New South Wales. Paul has prior professional experience as an accountant, and as a consultant to investor and government organisations and is associate editor of Geneva Papers and International Journal of Banking Finance and Auditing. He is also a Fellow of the Australian CPA Society and Honorary Fellow of the IFoA, and an Affiliate of the Institute of Risk Management.
His research interests cover the inter-relationship of public policy and voluntary reporting, regulation, financial management and control of financial services, particularly related to pensions and life insurance. His recent publications include Journal of European Law and Economics, Journal of Business, Journal of Banking and Finance and Journal of Business Finance and Accounting.
Paul is currently undertaking a Masters Law Degree at the Open University on the area of cyber security and environmental responsibility.
We also have Working Party member Sonia Styles with us. Sonia is a senior risk management professional with over 20 years of experience in the financial services industry. At Grant Thornton, Sonia leads risk management within the actuarial and risk practice area.
Sonia has extensive risk and capital management experience, including development and improvement of risk management frameworks and risk functions, management and implementation of regulatory change projects and the development of regulatory risk reporting processes.
Sonia has held a number of financial, risk and capital management roles, including capital management and ratings leader for the European Group of Genworth Financial, chief risk officer for the lifestyle protection business of Genworth Financial, group capital manager at Royal & Sun Alliance and senior manager in the risk consulting team at KPMG in London. She is a Fellow of the Association of Chartered Certified Accountants.
Our first panel member is Alex Waite. Alex has a wide variety of experience of UK and international retirement benefit schemes, and is regularly quoted in the media regarding such issues. He is chair of the Association of Consulting Actuaries International Committee, and approximately half of his time is spent working on international plans, including corporate transactions and accounting calculations under international and US Generally Accepted Accounting Principles.
A number of notable projects with some of the UK’s largest companies have seen Alex help clients to reduce costs and risk as part of a long-term strategy. His work includes designing sustainable employee benefit plans, negotiating sensible funding plans with trustees and implementing targeted projects to adapt existing pension arrangements to companies’ changing needs. This includes working with a number of international insurance companies which measure and manage their risk in accordance with Solvency II.
Having graduated from Oxford, Alex started working in the pensions industry in 1991. His experience includes serving on the controlling boards of Lane Clark and Peacock (LCP)’s UK and European businesses, as well as serving as an external non-executive director.
Our second panel member is Christopher Chappell. Chris is an actuary and risk management professional with over 20 years service in the financial services industry. He has significant experience in risk management through responsibilities as a group chief actuary and chief risk officer. Chris has worked with boards to design and embed enterprise risk management frameworks that provide strategic value, insight and solutions for the business. He is a Fellow and a Chartered Enterprise Risk Analyst.
Professor P. J. M. Klumpes, H.F.I.A. (introducing the paper): First, we are going to give you a quick overview of why we wanted to investigate the topic of early adoption of the new Financial Reporting Council (FRC) code. We will talk about the background to the committee and how it was set up. We will give a high-level summary of the main features of the code that we examined. Then we will go into the two research approaches we used. One was a quantitative approach. The other was a qualitative case study approach.
Finally, we will outline our conclusions and recommendations in terms of opportunities for actuaries arising from this research.
In terms of the background to this work, I have lead for some years a risk reporting working party looking originally at insurance. We produced a report back in 2014–2015. Since that time, we have been looking to extend the work.
In the meantime, Colin Ledlie was chairing and leading a separate working party, with the same name, which focussed much more directly on the latest developments, in particular the corporate code changes. Colin (Ledlie) has drawn people together and highlighted to the profession some of the new developments.
We have come together, combining the two approaches. We decided to look at the UK specifically and received research funding from the IFoA.
I will now introduce the technical background. I will highlight some of the areas that were involved in the new FRC guidelines which were effective from September last year.
One issue is defining and identifying the “principal risks” mentioned in the guidelines. Secondly, there is a responsibility on the directors to have a reasonable expectation that the company will continue its operation into the future. This is a very intriguing concept as a researcher because it is quite important to come up with what is called a viability statement, which is a major challenge for many companies. There are also the issues related to the “going concern” concept. Going concern is a big issue for auditors, who are concerned about firms taking responsibility to demonstrate that they are a going concern.
The last point, which is particularly relevant to actuaries and other risk management professionals, is having to be more transparent about the processes, the risk management internal control system and how they are recorded. This is in a very UK context where the legal culture is about complying or explaining. This contrasts to the US where the Security and Exchange Commission (SEC) has already got equivalent requirements, but which are much stricter about supplying information in a particular form, and if necessary chasing it up. In the UK, the system is not so driven by form and there is more emphasis on the context.
There is limited research. For example, in the generic area of risk reporting, there is a lack of distinction in the literature between what you might call, risk communication and specific, concrete disclosures.
The latter has been the main focus of risk management. Certainly from an accounting perspective we have many standards, IFRS 9, and so forth, on financial instruments, which mostly focus on quantitative disclosures and perhaps less on the more generic soft risks.
In terms of research, the only published research in the BAJ besides our own working party’s work was the study by Grundl and Horing 2011. This was the first study, of which I am aware, which looked at risk reporting in the insurance industry across Europe. It was a German approach and limited in scope. The authors were concerned about value at risk (VAR) and how firms were quantifying VAR.
The research that we have done to date, and previously reported, aimed to extend that work, still looking at insurance, but trying to expand the concept of risk. It did not just focus on what was being measured, which was VAR or risk processes, but thought about risk from a more functional view. We took a broader holistic view of risk than was used by Grundl and Horing. We consider a risk classification approach that actuaries would use similar to that of Patrick Kelliher et al. This involves thinking about the nature of risk: is it equity risk? Is it debt risk? Is it frictional risk?
The concern with the research to date is that it is has not tried to think about risk management as a process rather simply identifying what is being done. That is important for future compliance with Solvency II.
We were trying to accomplish a number of things. We wanted to get beyond insurance and banks and look at a broader set of firms. We were also somewhat constrained because the implementation of the revised code is very much focussed on the UK.
In looking at the world of opportunities for exploiting this research for the actuarial community, we also were prepared to go beyond the large-CAP companies (FTSE 100) and look at some mid-CAP (FTSE 250) and small-CAP companies.
In extending the research beyond pensions and insurance I took the academic role being concerned about getting measurements of readability and disclosure quality, which were consistent with the academic literature. This approach caused some discomfort within the working party where people were not necessarily happy with the idea of somehow being able to measure these things.
We took several approaches to measurement. The first is using a generic score called the FOG score. That is a way of evaluating the quality of readability, which is mostly used in the linguistics area, but also being exploited by many hedge funds and others trying to track behavioural traits in narratives in annual reports.
Second, we designed our own specific risk management disclosure indices. We captured the relevant International Standard for Organization requirements in terms of looking at the different stages of risk. We did not just look at whether there was a risk or an exposure, but whether there are any specific measurement processes or tools that are being used to monitor those risks.
Thirdly, Stage III is considering whether there is some process, procedure or policy that the firm is using at the board level to ensure quality through the relevant oversight and whether these are effective.
In addition to the foregoing three stages of disclosure, we used the generic disclosure index, courtesy of Lancaster University. We used their software to determine the generic readability and then we also developed our bespoke approach (BAJ paper 2014 Klumpes et al.).
Essentially, we did not randomise when we collected our sample. We were doing stratified sampling. We wanted to capture size so we had 20 firms which were large-CAP, 20 mid-CAP and 20 small-CAP. We wanted to have a fair mix of financial, regulated and unregulated industrial firms. We even went out to retail firms and firms that you would not normally consider to be at the leading edge of risk expertise. We looked at 3 years of data, which led to quite a lot of work trying to capture the reporting trends.
Figure 1 sets out a list of some of the company names. Some of them will be more familiar than others. Also, some of these firms were not in existence for the whole time. Tesco, which has had quite a lot of problems recently, provided quite an interesting case of how its reporting evolved as it faced various crises.

Figure 1 Firms included in sample
Under the first three headings there are household names such as HSBC, Prudential and Aviva. But also less familiar companies such as industrial engineering firms like Johnson Press, Carrs Milling and even a shipping company. Different companies will have different ideas of what they think risk reporting is and what it involves.
Figure 2 sets out some of the keywords that we were looking for in annual reports. We look for various features: is there narrative in the report? What is the risk exposure in various areas? Are there any tools and processes that suggest that the firm is doing something about the issues? What are some of the board issues? What are the softer risks? How are the questions of risk culture, risk tolerance and risk capacity dealt with? They are important incentives to consider as well (Figure 3).

Figure 2 Risk management specific Disclosure Indices

Figure 3 Average Disclosure Scores - stage 1
In terms of the bespoke approach, the FTSE 100 companies tended to score high as they are more complex firms: there are normally more relevant risks and more issues relating to incentives, so you would expect a high score compared to smaller firms (Figure 4).

Figure 4 Average Disclosure Scores - stage 2
In terms of stage II, the scores are a lot lower although the trends are more or less similar, in that there seems to be more emphasis on outlining the risks that they are exposed to. There is a lot less discussion about how they actually go about managing those risks (Figure 5).

Figure 5 Average Disclosure Scores - stage 3
Finally, Stage III deals with board level oversight which involves much softer level high-level risk policies. The scores are slightly bigger, but there is less deviation across the whole sample. In other words, at the board level smaller firms are as much concerned about the monitoring as large firms.
In Figure 6 we show the breakdown of the findings in terms of the different areas between early and late adopters. We see a substantial difference between early and late adopters for Stage I, but a lot less variance for Stage II and Stage III.

Figure 6 Determinants of risk reporting quality - Specific Risk Disclosures
Figure 7 shows a summary by sector; on the left the financial sector, where most actuaries are populated in terms of risk management advice. As expected that has the highest score, given that it is regulated. Actuaries are worried about Solvency II so there is capital modelling. After that the manufacturers come in, and that is intriguing because obviously engineers also have concerns about risk, albeit a different view about risk, there is the Risk Analysis and Management for Projects framework and the various eminent work that the engineers have done, so engineering firms also tend to do well. Then it drops down to the other firms, but there is not as much variation as you might have expected (Figure 8).

Figure 7 Risk Disclosure Results - Sector Summary

Figure 8 Determinants of disclosure - multivariate analysis
We did some basic regression analysis which was necessarily very limited in scope given the limited sample size. The typical explanations for the quality disclosures were related to either political visibility or size, which you would expect to be important for a regulated industry such as the financial industry. Then you have economic reasons. The more risk a firm has as a business, the more you would expect it to want to disclose about risk. Book to market, which is capturing growth options is relevant to economic factors. Then we determined whether the firm complying early or late was a factor.
We found that for stages I and III political visibility was a major consideration. So, obviously, size was a major factor.
Whether firms take a lead in complying as opposed to waiting for others to take a lead seems to explain what was going on as well as the book to market. But the book to market was really only capturing that in terms of the risk management side.
In the next phase of the research we looked at outliers. We were interested in the poor firms at Stage I, Stage II and Stage III. I have left out the names of the firms here to avoid causing offence.
In terms of the good practices, with the exception of oil and gas, the financial firms tend to be leaders, whereas, as expected, transport firms and firms which are not so much into IT or engineering tend to be the laggards.
Sonia (Styles) and Fiona (Fahey) spent time going through some of these outliers to find examples of good and bad practice. For example, Chesnara, which is a small-CAP firm (Figure 9).

Figure 9 Good practice examples
The example here shows that the firm gave an overview of what it considered to be the principal risks and set out some of the impacts that each of those risks has on the business and the relevant controls.
For stage II, you have to go to the more regulated firms (Figure 10).

Figure 10 Good practice examples
HSBC had lots of pictorial representations of how they looked at managing risk. The example here is their risk management framework. They start with the board at the top where they explicate risk appetite issues. They have a risk governance that connects to that, and then at the bottom they have the various tools and procedures that they use to monitor those risks and try to manage them. That could be considered a constructive way of mapping the different kinds of risks (Figure 11).
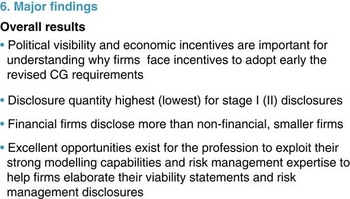
Figure 11 Major findings
So the bottom line of the findings is that political elements, size and some economic factors seem to explain why firms would choose to adopt risk management approaches earlier than later. It seems a lot of firms define the risks but far fewer are explaining how they go about measuring and managing those risks on a day-to-day basis.
Clearly, financial firms are the leaders in this area, but perhaps not as much as one might have expected, particularly compared to the engineers. In our paper we try to document the kind of opportunities in terms of the modelling capabilities and risk management expertise that actuaries would need to help facilitate the communication and the explication by boards not just to stakeholders and shareholders, but even perhaps inside their organisations.
In terms of further research one of the areas that we would like to explore is international practice in other jurisdictions beyond that governed by the corporate governance code in the UK.
Another important area is sustainability reporting. As well as having an integrated report, it should be disseminated to the stakeholders, not just shareholders. This practice might affect the communication of what the risks are and how they are managed. Also, the issue of narrative versus quantitative reporting, is an area in which we have taken initiatives and that could be further developed.
We would like to get some input on further work comparing the different trends and looking at some industry-specific issues at a more granular level, for example, focussing on general insurers as opposed to life or investment firms. In addition, investigating soft factors is quite important particularly when considering stakeholders as opposed to shareholders.
I also suspect issues like IT risk and the big data cyber risk issues need further explication.
In terms of recommendations one area which I have not touched on is the viability statement: this is about the future prospects of the company. We found very little evidence that these were being done. This is an area in which there seem to be lots of opportunities for actuaries.
Other opportunities might be related to explicating the benefits of the risk management processes. There are benefits of pushing Solvency II out to other applications and also really helping firms understand the connections between risk culture, risk tolerance and risk capacity and deal with them and then communicate them to the stakeholders.
There are some areas where the profession could also be involved such as providing more general guidance for actuaries in the area. Perhaps also some of the ethical conduct incentive issues could be quite useful for explication purposes. The CFA have already done this in connection with investment professionals.
Ms S. Styles (introducing the paper): My role on the Working Party was working on the qualitative aspect, looking at the statistical findings from Paul (Klumpes)’s methodology, which actually involved a small sample of businesses, and looking at the detail in the accounts. We also looked at the reviews of broader corporate governance trends that are regularly produced by a number of other organisations.
I am drawing on examples from the Grant Thornton governance review, which I was not a party to. The powerful findings of the report that Paul (Klumpes) talked about are all entirely consistent with the Grant Thornton governance review.
A governance review covers a lot of different areas, but the five key ones are
-
∙ an overall summary of reporting trends regarding the governance code,
-
∙ the strategic report in relation to its reference to principal risks and uncertainties,
-
∙ the inclusion of a viability statement,
-
∙ the risk disclosure trends, and
-
∙ corporate culture and values, which is currently very topical (Figure 12).

Figure 12 Summary of 2015 Reporting Review
In terms of summarising the findings, there are some highlights worth noting. Regarding the strategic report, only 50% of companies in the FTSE 350 survey produced a strategic report that met the code requirements in terms of how it identified principal risks and uncertainties. In fact, 77% made no statement regarding future viability.
Another interesting statistic is that a quarter of firms surveyed gave no additional disclosure in the 2014 reporting compared to their previous year, so there had been no change after the introduction of the voluntary disclosure in the corporate code.
Regarding culture and values, only 13% of chairmen discussed culture in their primary statements. I am sure that we will see a change in that going forward.
We are focussing on the opportunities for the actuarial profession. I am not an actuary, I am a risk professional and accountant. The use of the structured approach that actuaries have mostly developed under regulatory pressure in insurance is clearly transferable. It can provide greater understanding and communication of the principal risks to a business, how they affect the business model, quantification of those elements and communication and education to key stakeholders.
The strategic report has three main content-related objectives.
-
∙ To provide insight into the entity’s business model and its main strategy and objectives.
-
∙ To describe the principal risks the entity faces and how they might affect its future prospects.
-
∙ To provide an analysis of the entity’s past performance.
(FRC Guidance on the strategic report, 4.4).
In terms of the study 72% of companies do include and describe their business model (Figure 13).

Figure 13 Principle Risks and Uncertainties
The more surprising statistics for me are around the link to principal risk uncertainties and to what extent the company describes these. Another surprise is the even lesser extent, as shown on the chart shown on Figure 2, that they link the risks of uncertainties to the strategy. That indicates how the use of the actuarial capability in terms of understanding risks and the implications for business strategy can be used more widely.
Figure 14 shows the industry segmentation, which is consistent with the discussion that Paul (Klumpes) shared in terms of financial companies having a leading role in terms of how they identify principal risks and uncertainties. This summary does show financials slightly lower than the average for the FTSE in terms of the average number of risk disclosures.

Figure 14 Principle Risks and Uncertainties
Our detailed qualitative analysis indicated that mentioning or identifying a risk is very different to understanding and explaining the sensitivities of the business model to that type of risk. We also saw a large differential between the different industries. Paul (Klumpes) has talked about how the methodologies that have been finessed in terms of the insurance industry could be transferred to other industries (Figure 15).

Figure 15 Viability Statement
In terms of the viability statement, again there are some interesting statistics quoted here. Only 67 companies provided a basic discussion of the future viability of their model and only six provided good disclosures.
In terms of insurance and the work done by the risk and actuarial teams related to business model testing, sensitivity testing and stress scenario testing, there are a lot of information methodologies available to be used to help to educate senior management and the board and to decide what could be usefully communicated to stakeholders.
Again, I can report some quite surprising statistics based on the 2014 and prior year-ends. It would be interesting to see how these statistics move in the next round of reviews. One would hope with all the tools at company disposal that that will move forward.
Figure 16 summarises risks and disclosure trends by risk categorisation. Focus on operational risks and financial risks are the most dominant. One surprising area was in terms of expansion and growth disclosures showing a decrease, which was not fully explained.

Figure 16 Risk Disclosures and Trends
In terms of regulatory, macroeconomic and technology risks, they are all showing a rise, as we would expect, although any practitioner will know that in terms of classification of risk often operational risk covers many other risk categories. Often there is lack of consistency in disclosure of risk types.
Indeed, the recent stress and the scenario testing exercise in the General Insurance field had limited use, according to the European Insurance and Occupational and Pensions Authority due to a lack of consistency with the risk disclosures and the risk categorisation. So they are looking for improvements there.
Figure 17 sets out a summary of some of the interesting disclosures regarding corporate culture and values. Again, consistent with Paul (Klumpes)’s disclosure of the findings of the working party, the larger organisations definitely fare better in terms of the quantity of reporting. However, in contrast to the findings of the study, financials actually performed very weakly in the area of reporting conduct and culture. Telecommunications and healthcare perform very well in this field.

Figure 17 Corporate Culture and Values
On the right-hand side you can see a pie chart reviewing whether the annual report actually addresses culture and values. Only around 50% of those surveyed addressed culture and values in their report and accounts, which again is a surprising statistic. As part of the corporate governance code, it is one of the key roles of the board to establish culture, values and the ethics and tone from the top.
Andrew Bailey mentioned in his speech last week with both his hats as the current CEO of the Prudential Regulatory Authority and his future role in the Financial Conduct Authority, that he was suggesting that the regulators’ focus and attitude to conduct risk does not change the culture. He was very much indicating that the expectations of the senior manager’s regime were to encourage personal responsibility amongst senior managers, particularly in the area of the culture of financial services firms.
The Chairman: What has been the impact of the new FRC guidelines in the UK insurance sector? In that sector have we generally been better or worse than others?
Mr C. I. Chappell, F.I.A.: Solvency II has helped put the insurance sector in a decent place. Everybody has talked about the Own Risk and Solvency Assessment (ORSA), and all the things that it brings, how they can help it develop and what it could use for disclosures.
In terms of sector the interesting one for me is actually the non-insurance sector, the corporates. One aspect is how much the financial directors have really understood the size of the risk that is sitting there in their pension schemes? If suddenly they are driven to a lot more understanding and disclosure around this, will that drive a lot more de-risking from their balance sheets? I see that as maybe one of the biggest potential impacts. Obviously, that feeds through to the insurance sector if companies are looking to de-risk pension schemes.
Another interesting area is risk culture. You look at the company failures and they had all the great statements in all their accounts about how everything operated. Yet culture is quite intangible. It is hard to actually articulate.
Mr A. M. Waite, F.I.A.: Company pension schemes are a fascinating area because there is a natural tension between the long-term analytical side of things, which I guess as actuaries we naturally move towards, and the short-term commercial side.
As a consultant in the pensions field, but with a number of clients which are insurance companies, in the past the commercial side might have won through, even in an insurance company. However, with Solvency II coming in this year the long-term analytical approach has started to dominate. When you look at a pension scheme through a Solvency II type of lens, you do actually conclude, as a finance director, that it is in your best interest to de-risk both on the investment and demographic side. Therefore, I have seen a different culture in organisations over the past couple of years with a shift from a short-term to a long-term world.
That is a good way to see things but equally it may only be the viewpoint in those organisations that are looking at things in that perspective by regulation. This appears to be borne out by the research which Paul (Klumpes) and Sonia (Styles) have done.
The Chairman: So the challenge is for the actuarial profession to persuade the captains of industry to recognise that the long-term actuarial skillset can be used in other areas of risk in their business.
Mr Waite: Paul (Klumpes) put it well in the paper, that it is hard to get the perceived value from this kind of analysis until you have actually completed all the analysis. Therefore, the challenge for actuaries is to explain that the organisations that have been through this process ultimately thought there was value to it.
Professor Klumpes: I agree with that. I was at a risk management event and I was expecting research of the kind that we did. In fact, it was just dogma from CEOs of investment firms and insurance firms saying: “we have the culture. It is already organised. Aren’t we beautiful?”
At the end of the day, it is about creating and then meeting the expectations of outsiders, the analysts and the stakeholders. It is also about having appropriate communication, explaining the changes that have happened and that they are being implemented.
That is where the actuaries have some unique skills perhaps combined with risk communication or a consulting element. It is important not just to have a discussion within the board or within the firm but with the outsiders. The challenge here is to convert the change in culture to which you are alluding to something that is actually going to happen in practice.
Mr T. J. Llanwarne, F.I.A.: My questions aim to clarify. Firstly, can you confirm, or otherwise whether you just talking about voluntary disclosures or are you talking about disclosures under the new requirements of the FRC rules?
My second question is for Paul (Klumpes): your analysis and numerical work was done on things like risk identification, risk measurement and risk monitoring. I think that you have done it across all three of the FRC reports, the strategic report, the viability report and the report on internal controls and mis-reporting. It seems to me, from the way you presented it, that you might have lumped all of those together in the way in which you have come up with your numbers. Could you clarify whether this is correct?
Professor Klumpes: The draft guidance came out over the course of the project. We discovered late it was going to be implemented on 30 September 2015. All the work that we did was prior to the implementation. In fact, firms were supposed to have got wind of the implementation and some took the lead over others.
In terms of your second question, we had two goes at this. One was what we called a FOG score. The FOG score was required to identify specified sections in the report. If there was a specified section about the strategy or the management strategy, then the analysis would only be done on that. There were also generic scores right across the whole report. However, we did not look at those, we just looked at the report quality on that section.
In connection with the other approach, we wanted also to look specifically at key words that related to risk management/risk processes. In this case we looked right across the report. The second category is possibly more subject to your criticism than the first one.
We covered both bases. We had both a generic score that looked at just the specific risk management section. This was based on a narrative report, not the accounts. We also had the more bespoke indices. These would look right across the whole document and would be slightly more subject to your concerns.
Mr Llanwarne: Following on from those question would it not be helpful if one of your areas for further research is to redo some of this quality analysis on the required disclosures as and when they emerge? It seems to me everything so far is voluntary, and there is a real benefit from doing the same things on the required disclosures in a year or two’s time.
Professor Klumpes: Absolutely, we will look at this. We are a bit ahead of the curve here by looking at these things before firms are really understanding things and explicating their approach. We have got a lot of richness out of that. Although, you are correct, I am keen to know what is the quality coming through now the disclosures have been done by everybody.
The Chairman: What do you think, Sonia (Styles), would be a sensible sector for the actuarial profession to concentrate on in terms of trying to expand its involvement?
Ms Styles: The rest of the financial services sector is clearly under a significant amount of regulatory pressure. It is not just a problem in insurance. Certainly, from my viewpoint, investment managers and other companies in financial services, use traditional approaches in finance mainly in terms of modelling.
I can certainly see benefits from the more structured approach that you have seen particularly regarding stress and scenario testing and how it is not just an exercise in maths but in insurance. In the structured approach there is the explanation, there is the management involvement in terms of feeding in to defining scenarios and there is the explanation and understanding of the outcome. The discussion at board level that I have witnessed in insurance companies about being much more informative within the business and articulating issues to external stakeholders shows there is much more information and informative discussion. I do not see that operating as well particularly across the other financial services sectors which all have challenges.
One of our interesting findings came about because during our research BP was going through its challenges in terms of risk. In terms of the oil and gas sector, the extensive disclosures from BP following its disaster really peaked in that area. Clearly, oil and gas is an area where risk management is very strong.
I believe the structured approach to valuing risks and understanding sensitivity of risk could be transferred to any industry. All sectors could benefit particularly in understanding operational risk and what events could happen and the sensitivities in the business model.
Mr Chappell: The extent to which the profession can expand its involvement in other sectors will depend on whether the financial reward can meet the expectations of actuaries as they come through, or those who want to transfer.
There is also the requirement that the exposures in those other areas have to be complex enough to warrant the level of sophistication of modelling. There are some businesses that do not warrant a level of sophistication that would keep the interest of actuaries.
If you look at this consideration, the oil and gas sector, the sports industry and healthcare have the potential income to support the approach. There may perhaps be other sectors that we might find.
The other side is you have to remember that it is not just a numbers game. Going back to the sorts of disclosure that we are talking about, there could be static and dynamic aspects to it. If you look at disclosures on principle risks, they are very much the static internal model/ORSA risk categories. But there is the other side which is disclosures looking forward. For to give some examples: we could have thought about Brexit a lot more; similarly, have we thought about the US elections and even way beyond that into the next 3 or 4 years, as to what concerns the business viability or risks? If you are not careful, you might end up with a CRO section in the report and accounts which actually focusses it more than just being a section that is attached to whatever the CEO and CFO want to say about the business.
Mr Waite: I concur with everything everyone has said. There are obviously sectors that lend themselves to financial modelling better than others and those are the ones where we are making the most penetration.
We can go further. My firm has done some work with manufacturing companies to do some operational risk analysis. It certainly can be done. Increasingly, it will be done. It is a bit harder in services companies. Even when there is some analysis which can be done, for example, on training programmes or some other issue there is the issue of whether you are getting things right. We have learnt a lot of skills as a profession from Solvency II and from Basel as well, and we can bring that experience to bear in wider fields.
It is good to hear Sonia (Styles) say that actuaries are able to communicate risk as well. We are used to talking about risk, whereas other organisations have not had so much exposure to risk as we have.
Finally, there is understanding the interactions between risks and the correlations, and multiple correlations, between various variables are areas which actuaries are particularly well suited to deal with? There are other people with differing skills who can do some of this but explaining it is something that actuaries are particularly well-placed to do. This will be a skill which we can take out into the market over the coming years.
Professor Klumpes: We have a challenge here. How good are pension funds in explicating the risks that actuaries know all about, not to stakeholders but to their members? How good a job did the Co-op do at the end of the day in communicating the various problems that it had? I suspect that the answer is not very good.
I know that the focus has been on corporates but going outside of that there must be lots of entities that have similar issues. Some of the skills, and some approaches we are discussing today, could be of use in some of these other more specialist areas, where actuaries do have knowledge.
Mr Waite: I totally concur with that. There is a lot more work that actuaries can do. The Pensions Regulator last week came out with a funding statement saying that we should be much better at integrated risk management, which is effectively something that is not yet being done across UK industry.
Mr T. J. Birse, F.I.A.: Following up a point made by Sonia (Styles), firms subject to the Solvency II regime are also going to have to produce from next year a solvency and financial condition report (SFCR), which is putting a lot of the information we are talking about into the public domain but possibly in a more structured way than a free format. It may be that other firms can get some sort of structure out of what we are being obliged to do.
Firms complying with Solvency II are producing one public domain report, and may be reluctant to copy it all out and put it in the financial statement as well perhaps resulting in a financial statement at a fairly minimal level. This will probably not apply to public companies but certainly will to small companies. I am a director of a couple and we are certainly not looking to spend a lot of money doing the same job twice.
Ms Styles: The observation about the number of places where risk is disclosed and discussed in different areas of the accounts is correct. Having done the qualitative analysis, I was surprised by some of the disclosures. The risk disclosure is not all in one place.
For a reader of accounts, a stakeholder who is not familiar with the accounting or corporate governance disclosures, it is difficult to know where to look for some of that information which is littered throughout the whole document. The work that we did looked at all of the areas of risk disclosure. In some examples there was extensive disclosure throughout the document, which gives challenges of consistency, etc., for the producers. Then, there are other organisations which really did not have any disclosure or very limited disclosure. There is a real range of disclosure levels.
The point you made for an SFCR is a good one. In terms of Solvency II firms, we were aware that a number of the firms within the review actually had a lot more information available to them than they chose to disclose. Clearly, the work that we have done is on material that is disclosed in the report and accounts. Even today there are other formats that businesses can use to explain the risks in their portfolio, whether it is through rating agencies, investor roadshows or whatever. The SFCR brings another public document and firms are thinking hard about how to complete that. There are challenges with timing and publicly available information, particularly for US firms and SEC-listed firms.
Dr G.D. Kaye: The title of this meeting is “Incentives facing UK-listed companies to comply …” yet all of the discussion has been an analysis of what companies are doing in their disclosure with no mention of what the incentives to do it are. Alex (Waite) referred to it in passing when he was talking about training and about how it may be good for the company.
Was there any analysis of whether those companies which were good at disclosure were better at business? Or could the opposite be true that with companies spending so much time on disclosure, they did not have any time to follow good business practice.
Professor Klumpes: The typical academic answer is that we run regressions to answer these sort of questions. We had variables measuring the quantity and quality of disclosure on one side and then a series of explanatory factors. We originally had a lot of factors in our regression. Unfortunately, we had only so many firms and so many observations. In this case we chose to focus on the risk of the company and its book to market.
We did originally include profitability and how the firm performed. We ended up having to drop these variables, as we did not find any pattern.
We looked at only 2 or 3 years. Moving forward over a longer window we would have more data and more chance to provide an answer.
Mr Chappell: The difference between what you see in company accounts, which is a very static and structured disclosure of the risks, and the dynamic aspect is very important. The dynamic aspect is the part that shows the company is really thinking about material out there that is impacting on the business. That is concentrating on the important aspects rather than just routinely reporting things, for example, saying “we are exposed to interest rate risk. We hedge it”. The routine reporting is acceptable, but there is potentially more value added by more thoughtful and dynamic discussion about, for example, how markets might behave over the next 5 years.
Ms Styles: The research was done at a time before the requirements were mandatory so we were very much looking at early adopters and the incentives for them to demonstrate where they have good risk management capabilities to publicise that in the report and accounts.
The lack of take-up was disappointing amongst the early adopters. The next investigation will be after the requirements have become mandatory when all the information is available under Solvency II and we know companies are complying. Just how much of that type of information makes it into the public domain across all industries would be very interesting.
Professor Klumpes: Another aspect of the revised code was to talk about incentives. There had to be more disclosure of the incentives for the management and more transparency about that. This is ironic given the recent BP case where there was a large incentive paid which was very controversial amongst shareholders.
More data would allow us to make slightly firmer conclusions, not just about the incentives for disclosure, but whether they are actually aligned with managerial incentives. That plus the viability statement would be useful.
Mr Waite: Returning to Chris (Chappell)’s point about what is the interesting material, a good litmus test is would somebody say the opposite of what has been written. If in the risk disclosure it says: “we are in the financial sector but we are not a bunch of crooks”, you have told me nothing. No one is going to say we are a bunch of crooks. Actually, what I want to know are statements that someone might contradict or challenge, which means that disclosure is meaningful and helpful rather than just boiler plate stuff that anyone could add in as extra words. Examples of such statements would be “we think the UK is the place to grow”, “we do not think that Europe is going to do well over the next 5 years. It is going to stagnate” etc.
Until we get some form of analysis that shows that if a company makes meaningful statements and has thought about these issues, then it is expected to out-perform we are going to struggle to push this home in the commercial world. This analysis is something that has not yet been able to be produced.
Professor Klumpes: There are case studies that go the other way. We had an example of a big company which got an award for fantastic disclosure on environmental risks, and that company was Volkswagen.
Mr Waite: Another example would be Enron.
Professor Klumpes: In our research we looked at Tesco in 2013 which was just before they had problems. They were saying a lot about strategy but nothing about risk. The next year the accounts disclosed nothing about strategy but there was a lot about risk.
Mr Llanwarne: Despite my earlier questions, I like the paper and believe it is a platform for further consideration.
My background is that I have been in the public sector for the past 8 years or so and I have been doing some work within government on the better handling of government risk.
The approach set out in C.2.1 to C.2.3 of the Corporate Governance Code (and stated in Section 2 of the paper) is a good model. One of the things I have found in terms of getting messages over is that you have to believe that you have the right model, and have considered why it is appropriate. We have not talked about these issues. There are a number of things to consider: Is it right to have principal risks in your strategy? Is it right to have viability reports? Is it right to have something on internal controls? Although you write three building blocks, regardless of disclosures at the moment, but fundamentally, is that a sensible structure?
I had discussions several years ago with Jim Sutcliffe, an actuary. He chaired the FRC committee which produced that structure. Both he and I were very much in the camp that this is the right model. If we can share some of the reasoning for believing this is the correct model then instead of trying to persuade people that they need to have an actuary to do modelling, suddenly you are working from a platform where this is perceived as a simple way of looking at how to manage risks in a way which has not been done so far.
Clearly, this has to have more than just process. A lot of risk management at the moment is process. I like to think about what risk management is going to be in 10 years time. It is going to involve lots of real-time data analytics on big data.
I want to get people to think about disclosures. I am in two minds about the benefits of greater disclosure. I have seen in the public sector that if you make disclosures about some risks, you may increase the magnitude of those particular risks. Terrorism and cyber risks are good examples of risks that fall into this category.
It would be helpful, from an actuarial perspective to consider the bigger picture issues on what we believe to be the right model.
Professor Klumpes: The new trends in terms of data science and IT, as well as more global issues, are causing firms, especially insurance firms, and actuaries, to have to work a lot quicker. They have to be a more responsive and adaptable about drawing in data.
One issue with this research is that it contrasts with the normal accounting approach, where we have to wait for the end of the year, and after the figures are audited, before we are allowed to know what the risks are. There are a lot of exciting possibilities to make risk reporting more of a continuous process and update markets in real-time.
For me one of the challenges is the intensity and size of the data. In addition, the pace of change means that a high level of responsiveness is needed, particularly when events will have a big impact on the risk capacity of that organisation. You cannot wait for just another year to discover what the outcome was. This area is very related to risk communication which is another area that we could think about.
Professor A. D. Wilkie, F.F.A. F.I.A.: It crosses my mind that obviously while many industries have the same features in that they need finance, they have staff, they have IT systems, and so on, they differ quite a lot in what they do.
Life assurance seems to be one of the easier industries to deal with. They have large books of existing life insurance business: actuaries are familiar with the ways of forecasting the future cash flows on that. There are elements of uncertainty about those forecasts. There is also uncertainty about the amount of new business that the companies will get. But prediction is fairly straightforward compared with some other businesses.
Retailers, such as the big grocery stores, are also very static. They do rather badly or rather well with very tight margins. A small drop in sales makes quite a big difference to their profits. They are not going to change in size enormously. But pharmaceutical companies, particularly small ones do not have an enormous number of products. The profits of a small pharmaceutical company, or small book publisher or a small music publisher, depend enormously on whether they get a lot of duds or whether they get the best seller.
I had never heard of Bloomsbury Press until they started publishing Harry Potter. The successful publisher is the one which gets the Agatha Christie or the Ian Fleming as an author. How do you know whether they will ever turn up?
It seems to me in some businesses there is an enormous amount of uncertainty which would be extremely difficult for anybody to quantify properly. For, say, a publisher, you can do an analysis of the sales of books published during the year and get some sort of distribution. But some books sell in their millions and others in their tens so there is an enormous range of sizes. The upside risk is getting a good one, the downside risk is getting an awful lot of rather bad ones. How do actuaries, or anybody else, quantify that problem?
Mr Chappell: Some of the problems are related to discreteness issues. If you had a lot of good books, then one extra good one or one extra bad one is not a major problem. If you have a small number of books the outcomes are pretty much binary. So smaller entities are going to have more difficulties in this area. It might highlight the point that we are in danger of swamping our disclosures by trying to catch all risks. Actually it might be better to concentrate on the main risks rather than boiler plating every risk.
Mr Waite: Picking up on the publishing example, one of my clients is a publisher; businesses have to look at their risk appetite at the top level and run the business accordingly. One approach is to decide our risk appetite is such that we just want to churn out stuff that is going to give us a relatively small margin but each of them is going to be pretty safe.
On the other hand, one might have a completely different risk appetite. They could say, “No, we want to land one of the big whales; we want to head in that direction. Take more risks. We know that the next nine books might be flops, but if the 10th one is a great one, then that is what we are looking for”. A board could also actively say: “We want a portfolio. We want 70% dead certs, not much margin; and the rest we will go for the whale.”
Those are real discussions that you can have around risk in, for example, publishing. That is really using analytical skills that we use as actuaries in, for example, investment. Do you want to be in overseas equities, or do you want to be in government bonds? It is the same logic. You pick a portfolio, based on an efficient frontier. They are exactly the same concepts being transferred over into business.
Ms Styles: I would only add that it is then important to disclose your strategy to your key stakeholders. So if you are the owner of the business or the shareholder, you know the strategy that the board is taking and you are comfortable with it for your investment. You understand the risks of your investment as they have been articulated.
My other comment would be the approach has to depend on your products, the risks to the customer and your customers. They are vastly different in different industries, say, for example, a publishing example compared to a life insurer in terms of the customer touch points and potentially the risk of loss to the customer.
Professor Klumpes: For me a big revelation was that some firms actually chose to have a new section where they said “This is our business strategy”. For me an intriguing follow-up question would be if we returned a couple of years later could we see how well the strategy was executed? With hindsight, did the company disclose what the key risks were, whether those risks were business risks or perhaps emerging risks to do with terrorism or cyber?
The Chairman (closing): Thank you very much to the authors of the paper, and to Alex (Waite) and Chris (Chappell) for coming along to participate in the panel.


 Open access