Introduction
Snow and ice cover large areas of the Earth's surface, especially in the polar regions. Snow and ice reflect solar radiation very efficiently such that little of the incoming solar radiation is absorbed at the surface in these regions. Even so, small changes in surface reflectance can affect the Earth-atmosphere energy balance (Reference Warren and WiscombeWarren and Wiscombe, 1985). Thus, it is clearly important to monitor and calculate the variability of the albedo of snow and ice. Then, accurate calculations of the energy exchange between snow and ice surfaces and the surrounding air mass can be carried out.
The reflectances of snow and glacier ice show a clear dependence on wavelength. The spectral-reflectance properties of snow have been studied and reported on by many investigators (Reference Choudhury and ChangChoudhury and Chang, 1979; Reference Wiscombe and WarrenWiscombe and Warren, 1980; Reference WarrenWarren, 1982; Reference Wiscombe and WarrenZeng and others, 1984; Reference DozierDozier, 1985; Reference Dozier, Davis, Chang and BrownDozier and others, 1988; Reference Hall, Foster and ChangHall and others, 1992). Typically, the fraction of radiation reflected from fresh snow remains high in the visible region, while a distinct drop occurs in the near-infrared region of the electromagnetic spectrum. The albedo of snow drops below 0.10 in the mid-infrared region. In addition, snow of different degrees of metamorphism, as well as snow and glacier ice with different surface characteristics, can be separated since they exhibit distinctive spectral signatures. Satellites like Landsat TM (Thematic Mapper), NOAA AVHRR (Advanced Very High Resolution Radiometer) and SPOT (Système Probatoire pour l'Observation de la Terre) carry sensors that record surface reflectance within the visible and infrared wavelength regions. Consequently, satellite remote sensing enables studies to be made of surface characteristics such as topography, temperature, grainsize variations, melting areas and snow and glacier-ice facies (Reference Orheim and LucchittaOrheim and Lucchitta, 1988; Reference WintherWinther, 1993).
The specular reflection of snow and glacier ice introduces a problem if the true spectral-response characteristics of such areas are going to be studied, for example, by satellite remote-sensing techniques. Freshly fallen snow can be considered a Lambertian reflector (i.e. a perfect diffuse reflector) but, as snow metamorphoses, the specular component characterized as forward-scattering increases (Reference Dirmhirn and EatonDirmhirn and Eaton, 1975; Reference SteffenSteffen, 1987; Reference Dozier, Davis, Chang and BrownDozier and others, 1988; Reference Hall, Chang and SiddalingaiahHall and others, 1988, Reference Hall, Foster and Chang1992). The specular properties of glacier (blue) ice are even more pronounced than for metamorphosed snow. Since many satellite sensors are nadir-viewing, the satellite will often provide a different reflectance compared to the hemispheric reflectance (or albedo) on the ground. For example, an image pixel directed such that it reflects incident radiation towards the satellite sensor can give too high a satellite derived ground reflectance due to anisotropy.
The main objectives of this study are to: (1) measure the spectral reflectance of snow and glacier ice, (2) estimate the bi-directional reflectance characteristics of snow and glacier ice, and (3) evaluate how sensitive the measured spectral reflectance is to varying observation angle. The latter can also serve as a measure of how sensitive satellite-derived reflectance is to surface topography. As an example, Landsat TM bands 1-4 reflectances have been calculated by integrating in-situ spectral reflectance measurements of snow and superimposed ice. Next, deviations from nadir reflectance are calculated for off-nadir observation angles of 15°, 30°,45°, 60° and 75°. Effects on the surface reflectance from varying solar elevation, solar azimuth, weather conditions and physical properties of snow and ice are not considered in this study.
Method
Visible and near-infrared spectral albedo measurements were acquired using the SE590 portable spectro radiometer that measures radiation between 370 and 1110 nm in 252 discrete steps. Each channel represents a band width of approximate 3nm. Spectral resolution of the sensor is about 10nm and the field of view is 6°. The surface area seen by the sensor depends strongly on the observation angle and varies between about 20 cm2 (nadir) and 315 cm2 (75° off-nadir) for the measurements presented here. The spectral detector head was fastened to a standard camera tripod to avoid movements during the integration time of the sensor that was less than 1s. Immediately after each measurement sequence, a spectral measurement of a halon target at 0° nadir angle was taken as a reference for the calculations of albedo. The solar and atmospheric conditions are considered stable during one scan sequence. The limits of sensitivity of the silicon detectors are reached in the near-infrared region and the signal-to-noise ratio is small beyond 900 nm (Reference Dozier, Davis, Chang and BrownDozier and others, 1988; Reference Hall, Foster and ChangHall and others, 1992). Therefore, only data between 370 and 900 nm are presented.
Scan sequences of bi-directional snow reflectance were acquired by pointing the spectral detector head at nadir(0°) and then at 15°, 30°, 45°, 60° and 75° off-nadir followed by a nadir reference measurement of the halon target. Such a scan sequence typically took less than2 min. The horizontal direction of the measurements was towards the Sun.
Additionally, supporting measurements of air and snow temperature, snow density, liquid-water content, grain-size and shape, snow hardness and stratification were taken at each measuring site. The measuring sites were established within the area shown in Figure 1

Fig 1 Index map, showing the area where the measurements discussed in this paper were recorded. The dotted lines show the land boundary of the continent
Results
Spectral reflectances of snow, superimposed ice and rock
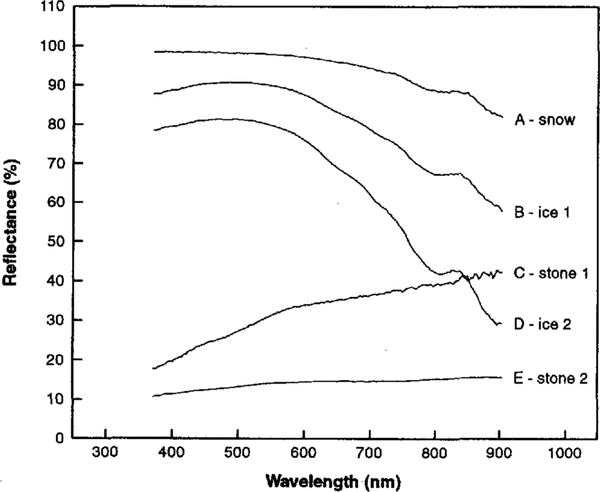
Figure 2 shows spectral-reflectance curves for snow, superimposed ice and rock taken on 16 January 1993 due west of the Korwegian Troll Station at 72°00.7'S,02°32.3' E. The measuring site was located 1250m a.s.l. at a glacier in Gjelsvikfjella. All reflectance curves were acquired within a distance of about 50 m. It was partly cloudy during the measurements

Fig 2. Spectral reflectances of snow, superimposed ice and rock acquired on 16 january 1993 close to the Norwegian Troll Station at 72°00.7' S, 02°32.3' E. The curves show A, snow; B, superimposed ice where the upper 1cm contained many ice-bound snow crystals giving a white appearance to the surface; C, bright part of a rock lying at the surface of the glacier; D, superimposed ice with many air bubbles but only a few ice-bound snow crystals,. and E, dark part of the same rock as described above.
The characteristic snow-grain diameter for curve A was 0.8 mm, ranging from about 0.2 to 1.2 mm. Most snow crystals were rounded. Even so, the original edged cubic form could easily be seen when looking through a magnifying lcns (8x). Erosion and redistribution of snow grains took place at the surface due to the influence of wind forces. These winds produced a relatively compact snowpack with a density of 0.36 Mg m-3 at 5 cm depth. The snow temperature at 5 cm depth was -4.6°C while the air temperature was -3.8°C. Overall, the snow surface was even, with a characteristic surface roughness of less than 1cm. As seen in Figure 2, the albedo is high and relatively stable in the visible region (98% at 370 nm) and then decreases moderately in the near-infrared. The albedo at 900 nm is 0.82. This spectral signature is typical for fresh snow that has been moderately metamorphosed (Reference Wiscombe and WarrenZeng and others, 1984; Reference WintherWinther, 1993).
Superimposed ice forms when melt water refreezes on the glacier surface. Curve D — ice 2 represents superimposed ice with a levelled surface containing many air bubbles and a few ice-bound snow crystals. Curve B — ice 1 represents superimposed ice where the upper 1cm contains many ice-bound snow crystals. Thus, this surface had a white appearance that increased the albedo significantly (Fig. 2).Below this thin layer, the superimposed ice was similar to the ice represented by curve D — ice 2. Curves Band D have considerably different signatures and higher reflectances than the spectral curves of glacier ice, congelation ice and refreezing ice reported by Reference Zeng, Cao, Feng, Liang, Chen and ShengZeng and others (1984).
Finally, Figure 2displays two spectral-reflectance curves taken at a big rock that was situated at the surface of the glacier. This rock had two distinct parts. One was very bright (curve C — rock l) while the other one was dark (curve E — rock 2). Interestingly, the near-infrared reflectance (700-900 nm) of curve C — rock 1 is not very different from that of superimposed ice, curve D — ice 2.
Bi-directional reflectance of snow
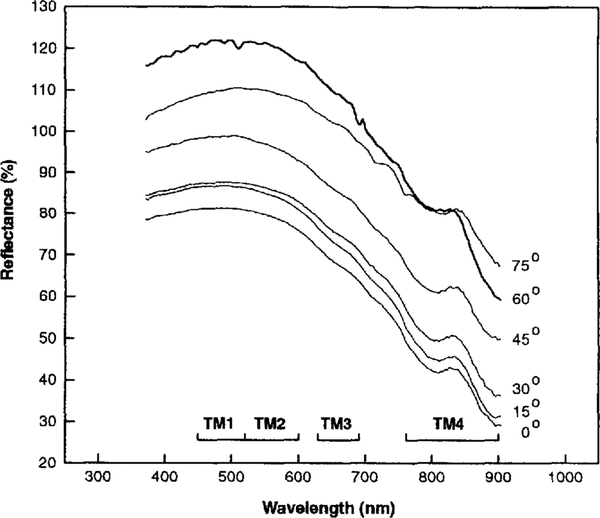
Figure 3 shows the spectral reflectance of snow for viewing angles 0°, 150, 300, 45", 60° and 750 for a viewing direction facing the Sun on 13 January 1993. This measurement site was at Jutulstraumen at 72°15.7' S,01°I5.6'E. The curves clearly prove the effect of anisotropic snow reflectance. Additionally, the anisotropy seems to increase slightly with increasing wavelengths. Reflectance values larger than 1.0 appear, especially for the largest viewing angles. Off-nadir reflectance values > 1.0 are reported to be quite common for dry snow (Reference Hall, Foster and ChangHall and others, 1992) but can also appear for wet snow (Reference Dozier, Davis, Chang and BrownDozier and others, 1988). This is because snow can reflect light specularly and more light may be reflected in one particular direction than by a Lambertian standard surface.

Fig 3. Spectral reflectances of snow for viewing angles 0°,15°,30°,45°,60° and 75°for a viewing direction facing the Sun on Jutulstraumen on 13 January 1993. The measuring site was located at 72°15.7' S, or 15.6' E. The wavelength regions of Landsat TM bands 1–4 are also shown. Note that the relative level of anisotropy is slightly sensitive to wavelength.
The snow at Jutulstraumen on 13 January had a characteristic grain-size diameter of 0.5 mm, ranging from about 0.2 to 0.8 mm. At a depth of 3 cm the snow density was 0.202 Mg m-3 while the corresponding snow temperature was -2.2°C. The surface was composed of freshly fallen snow that recently had been wind-blown and thus redistributed. Therefore, the snow consisted mainly of rounded snow crystals, Even so, some snow crystals appeared as needles and plates. There were no clouds in the sky during the measurements
Bi-directional reflectance of superimposed ice
Fig 4 presents the spectral reflectance of superimposed ice for viewing angles 0°, 15°,30°,45°,60° and 75° for a viewing direction facing the Sun on 16 January 1993. The measurements were taken close to the Norwegian Troll Station and at the same site as the reflectance curves given in Figure 2.

Fig 4. Spectral reflectances of snow, superimposed ice and rock acquired on 16 january 1993 close to the Norwegian Troll Station at 72°00.7' S, 02°32.3' E. The curves show A, snow; B, superimposed ice where the upper 1cm contained many ice-bound snow crystals giving a white appearance to the surface; C, bright part of a rock lying at the surface of the glacier; D, superimposed ice with many air bubbles but only a few ice-bound snow crystals,. and E, dark part of the same rock as described above.
The spectral curve for the nadir viewing angle (0°) is identical with the curve D — ice 2 in Figure 2. Thus, the superimposed ice shown in Figure 4 contained numerous air bubbles but only a few ice-bound snow crystals. Overall, the ice was level with a small-scale surface roughness with vertical height variations of about 1 cm.
Figure 4 illustrates that the specular properties of glacier (superimposed) ice are relatively more prominent than those for snow (Fig. 3). For viewing angles 0°, 15°,30° and 45°, the degree of anisotropy seems to be similar to that for snow and only moderately affected by wavelength. However, the 60° off-nadir curve displays higher reflectance values than the 75° off-nadir curve through the visible and up to about 840 nm in the near infrared wavelength region (Fig. 4), This can be explained by the strong specular properties of super-imposed ice and the solar elevation (θs )that was 31° at the time when the measurements were made. If it is assumed that the largest fraction of radiation was scattered in the forward direction, then the 60° off-nadir observation angle (90°-θs) becomes the observation angle receiving most reflected solar radiation.
It is not obvious why the 60°off-nadir curve decreases so rapidly in the near-infrared and even displays lower values than the 75° off-nadir curve beyond about 840 nm. One explanation could be the difference in surface area seen by the sensor in the two cases. The viewed surface area for the 60° off-nadir spectral curve (A60°) was about 86 cm2 while A75° was 321 cm2.Thus, the larger area covered in the latter case could have had different spectral properties compared to the area seen by the sensor in the 60° off-nadir position. The data have not been corrected for this effect.
TM bands 1–4 reflectances
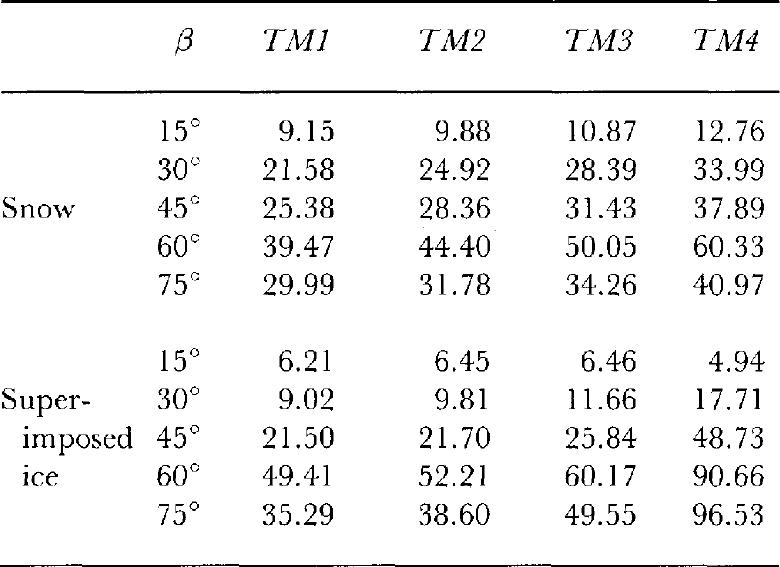
TM bands 1–4 reflectances are calculated by integrating in-situ nadir spectral-reflectance measurements. Next, deviations for 15°, 30°, 45°, 60° and 75° off-nadir observation angles are computed. Table 1 summarizes these calculations based on 22 spectral-scan measurements of snow and nine spectral scans of superimposed ice. The reflectance data may be used to study the strength of anisotropic reflectance for each TM band. In addition, the data show how the anisotropic reflectance varies with varying observation angle. The latter can also serve as a measure of how sensitive TM bands 1–4 reflectances are to surface topography. Obviously, the reflectance received by a sensor for a given viewing angle and surface topography depends strongly on the solar elevation(θs ).
Table 1 shows that the anisotropic reflectance of snow and superimposed ice increases with increasing wave lengths. For example,TM band 4 appears more sensitive to anisotropic reflectance than TM bands 1–3. This maybe the reason why higher TM band 4 rather than TM band 2 reflectances are found in the works by Reference Hall, Chang and SiddalingaiahHall and others (1988,Reference Hall, Bindschadler, Foster, Chang and Siddalingaiah1990) and Reference WintherWinther(1993).
Table I. TM bands 1–4 reflectances and their sensitivity to varying observation angle. Numbers are deviations (in percent) from nadir reflectance for off-nadir observation angles (β)of 15°,30°, 45°, 60° and 75°. The data are computed from 22 spectral-scan measurements of snow and nine spectral scans of superimposed ice

Furthermore, each of the four wavelength regions corresponding to TM bands 1–4 shows increasing anisotropy with increasing off-nadir observation angles up to an angle of 90°– θs . For the measurements presented here the peak in anisotropy is at about 60°.Most radiation will be reflected at this angle because of the forward-scattering properties of the surface and the solar elevation of approximate 30°. Snow reflects about 10% (average of TM bands 1–4) more radiation at the15° off-nadir observation angle than at nadir (Table 1).Similarly, snow has 49% higher reflectance at the 60° off-nadir viewing angle than at nadir.
Conclusions
Visible and near-infrared reflectances of snow and superimposed ice show a clear dependence on wavelength. The reflectance decreases moderately with wavelength in the visible region while the reduction becomes more prominent in the near-infrared. Superimposed ice with a 1cm thick surface layer of ice-bound snow crystals has significantly higher reflectance than superimposed ice containing only a few ice-bound snow crystals.
Snow reflects solar radiation specularly. In addition, the anisotropic properties of snow seem to strengthen for increasing wavelengths. Reflectance values larger than 1.0 appear, since more light can be reflected than is incident upon the snow in one particular direction. Superimposed ice is a more efficient specular reflector than snow. The sensor-observation angle giving the highest reflectance depends on solar elevation (θs ) and surface topography. These data show a clear peak in reflectance for the 60° off-nadir viewing angle that corresponds to an angle of approximate 90°-θs .
Integrated in-situ spectral reflectances of snow arid superimposed ice show that TM bands 1−4 are affected byanisotropic surface reflectance. The anisotropy increases with increasing wavelengths, i.e. TM band 1 is least affected while TM band 4 is most affected. Furthermore, the reflectances corresponding to TM bands 1–4 show an increasing anisotropy for increasing off-nadir viewing angles up to 90°-θs . For a sensor viewing angle 15° off-nadir, the snow reflectance is about 10% higher than at nadir while it can exceed 50% for larger off-nadir viewing angles. Consequently, satellite-derived albedo of metamorphosed snow can deviate considerably from the true spectral response of these surfaces. If satellite-derived albedos are going to be considered as absolute values, atopographic model is needed to correct for the effects introduced by anisotropy.
Acknowledgments
The author would like to thank all the participants on the Norwegian Antarctic Research Expedition 1992-93.J. O.Hagen at the Norsk Polarinstitut is particularly acknowledged for being generous with his time and allowing this experiment to be undertaken. This is publication No. 119 of the Norwegian Antarctic Research Expeditions.


