Introduction
Patients complaining of forgetfulness admitted to the neurology outpatient clinics span across all age groups, but this rate increases significantly with age. Memory problems sometimes manifest as a degenerative process, or a symptom of treatable diseases such as depression. Brain imaging helps us not only exclude the reasons that might cause symptoms of dementia such as tumors and vascular lesions but also helps distinguish the type of dementia with degenerative nature. Although the volumetric and functional MRI and brain network studies have increased in recent years, conventional MRI reserves its importance in clinical practice.Reference Hafkemeijer, van der Grond and Rombouts 1
It is known that cortical folding decreases with cognitive decline, whereas sulcal distance and ventricular enlargement increase.Reference Yue, Arnold and Longstreth 2 – Reference Liu, Lipnicki and Zhu 6 Several studies have shown that enlargement of the ventricles and the sulci were reliable indicators in detecting the neurodegenerative process; their increase was correlated with the progression of the disease, and they may be used in early diagnosis.Reference Jack, Shiung and Gunter 3 – Reference Liu, Lipnicki and Zhu 6 Structural and functional imaging studies focusing on the medial temporal region—important for memory—have shown that the presence of medial temporal lobe atrophy (MTA) was predictive of the development of Alzheimer’s disease (AD).Reference Visser, Verhey and Hofman 7
The incidence of not only atrophy but also white matter hyperintensities (WMHs) increases with age,Reference Yue, Arnold and Longstreth 2 , Reference Erkinjuntti, Gao and Lee 8 – Reference Debette and Markus 11 and may have negative effects on walking-balance disorders and mood, as well as cognitive functions.Reference Longstreth, Manolio and Arnold 9 , Reference Debette and Markus 11 – Reference Wardlaw, Valdés Hernández and Muñoz-Maniega 14 White matter hyperintensity has been defined in healthy subjects and in patients with vascular dementia (VD) and AD.Reference Erkinjuntti, Gao and Lee 8 , Reference Barber, Scheltens and Gholkar 10 , Reference Fazekas, Chawluk and Alavi 15 Radiologically defined as focal or diffuse bright areas on T2 and fluid-attenuated inversion recovery (FLAIR) images, WMHs were often divided into two categories: (1) periventricular WMH (PWMH), located adjacent to the ventricles, and (2) subcortical WMH (SCWMH), which is observed as patchy regions in the subcortical white matter beyond the periventricular area.Reference Scheltens, Barkhof and Leys 16 – Reference DeCarli, Fletcher and Ramey 18 Increased signal intensity in the periventricular area, known as “bands” and “caps,” can be seen in various diseases such as VD, Lewy body dementia (LBD), and AD and also in the case of normal aging.Reference Barber, Scheltens and Gholkar 10 , Reference Fazekas, Kleinert and Offenbacher 19 The hyperintensities of the basal ganglia and infratentorial areas, mostly associated with ischemic and gliotic changes, were more common in VD.Reference Barber, Scheltens and Gholkar 10 , Reference Scheltens, Barkhof and Leys 16
Various scales have been developed to provide objective assessment of atrophic changes and WMH, determine their severity, and enable their clinical use.Reference Yue, Arnold and Longstreth 2 , Reference Fazekas, Chawluk and Alavi 15 , Reference Scheltens, Barkhof and Leys 16 , Reference Scheltens, Leys and Barkhof 20 , Reference Scheltens, Erkinjunti and Leys 21 Visual grading scales are predominantly based on the identification of changes in the cerebral tissue with the naked eye and the atrophy and WMH by qualitative or semi-quantitative means.Reference Yue, Arnold and Longstreth 2 , Reference Fazekas, Chawluk and Alavi 15 , Reference Scheltens, Barkhof and Leys 16 , Reference Scheltens, Leys and Barkhof 20 Temporal and frontal lobe atrophies and enlargement of the sulci and ventricles are used to evaluate the atrophy.Reference Yue, Arnold and Longstreth 2 , Reference Breteler, van Amerongen and van Swieten 22 , Reference Whitwell, Peterson and Negash 23 At first, simple assessment of the existence of white matter changes was carried out—without distinction between periventricular and deep white matter—whereas in time more elaborate scales evaluating the periventricular and deep white matter areas as separate regions were developed.Reference Fazekas, Chawluk and Alavi 15 , Reference Scheltens, Barkhof and Leys 16 , Reference Scheltens, Erkinjunti and Leys 21 , Reference Wahlund, Barkhof and Fazekas 24 Basal ganglia hyperintensities are assessed separately in some scales,Reference Erkinjuntti, Gao and Lee 8 , Reference Scheltens, Barkhof and Leys 16 , Reference Wahlund, Barkhof and Fazekas 24 or together with infratentorial hyperintensities in others.Reference Yue, Arnold and Longstreth 2 , Reference Scheltens, Barkhof and Leys 16 , Reference Wahlund, Barkhof and Fazekas 24 The scale developed by Fazekas et al was confirmed histopathologically as well.Reference Fazekas, Kleinert and Offenbacher 19
Taking the measurements in the previously proposed visual scales into account, here we propose a new scale called “Modified Visual MRI Rating Scale (MVMRS),” which allows us to evaluate atrophy, WMH, basal ganglia infarct (BGI), and infratentorial infarct (ITI) together. The role of this scale in assessing MRI scans of patients with forgetfulness was investigated to differentiate between degenerative and non-degenerative (ND) processes. Our aim in this study was to propose a practical and standardized MRI scale that could easily be used by the clinicians in daily practice for diagnosis of degenerative processes and follow-up of patients’ progress.
Materials and Methods
A total of 97 patients aged 60 and above were included in this study. Among them, 47 (48.5%) patients were diagnosed with depression (ND group), whereas 50 (51.5%) patients were diagnosed with AD (degenerative group) according to the Diagnostic and Statistical Manual of Mental Disorder-IV-Text Revision and NINCDS-ADRDA criteria, neurological and psychiatric examination, laboratory tests, cranial MRI, activities of daily living, and a detailed neuropsychological evaluation including the Mini Mental State Examination (MMSE) and the geriatric depression scale (GDS). The neuropsychological evaluation comprises a standard battery of psychometric tests that assess various cognitive functions such as attention, executive functions, language, verbal memory, and visiospatial abilities. Clinical dementia rating (CDR) scale was used to evaluate patients’ daily functions.
The study was approved by our scientific, medical ethics, and deontology board, and all participants or their relatives gave informed consent.
MRIs of all patients were acquired with a 1.5T Siemens Magnetom Avanto (Germany) scanner. MRIs were reviewed by two neurologists and one radiologist, and visually scored according to the MVMRS criteria by consensus agreement. Anomalies such as tumors noticed on MRIs were also noted. The proposed scale was created by considering multiple sets of criteria: more specifically, Yue et al for sulcal and ventricular atrophy; Scheltens et al for MTA; and those of Fazekas et al, Scheltens et al, and Erkinjuntti et al for periventricular, subcortical and deep white matter, basal ganglia, and infratentorial lesions.Reference Yue, Arnold and Longstreth 2 , Reference Erkinjuntti, Gao and Lee 8 , Reference Fazekas, Chawluk and Alavi 15 , Reference Scheltens, Barkhof and Leys 16 , Reference Scheltens, Leys and Barkhof 20
Sulcal atrophy (SA) was graded in a 0–9 range based on the widths of the central sulci, interhemispheric fissure, and other cortical sulci on the axial T1 (repetition time [TR]=673 ms, echo time [TE]=12 ms, 3 or 5 mm slice thickness, 0.6 mm gap) image corresponding to the slice level where central sulci is best viewed (most similar to the shape of inverted omega).
Ventricular atrophy (VA) was graded in a 0-9 range on the axial T1 (TR=673 ms, TE=12 ms, 3 or 5 mm slice thickness, 0.6 mm gap) slice showing the frontal and occipital horns of the lateral ventricles together with the third ventricle.
Medial temporal lobe atrophy was graded in a 0-4 range based on the widths of the choroid fissure and temporal horn, and the height of the hippocampal formation on the coronal T2 (TR=6000 ms, TE=90 ms, 3 or 5 mm slice thickness, 0.9 mm gap) slice through the corpus of the hippocampus (at the level of the anterior pons).
Periventricular WMH was graded in a 0-4 range based on the WMH identified as continuous, confluent areas of high signal intensity adjacent to anterior or posterior horns of the lateral ventricles and along the ventricular system on FLAIR (TR=8000 ms, TE=80 ms, 3 or 5 mm slice thickness, 0.6 mm gap) images.
Subcortical WMH was graded in a 0-4 range based on the WMH identified as lesions located in the white matter but not touching the periventricular area on FLAIR (TR=8000 ms, TE=80 ms, 3 or 5 mm slice thickness, 0.6 mm gap) images.
Basal ganglia infarcts were graded in a 0-2 range from FLAIR (TR=8000 ms, TE=80 ms, 3 or 5 mm slice thickness, 0.6 mm gap) based on the hyperintensities in caudat nucleus, putamen, globus pallidus, and thalamus regions.
Infratentorial infarcts were graded in a 0-2 range from FLAIR (TR=8000 ms, TE=80 ms, 3 or 5 mm slice thickness, 0.6 mm gap) based on the hyperintensities in brainstem and cerebellum.
Details of the proposed scale are given in Table 1. For grading the SA, VA, and MTA, a reference data set was created from cranial MRIs of 30 subjects who were admitted to the clinic owing to complaints other than forgetfulness, but they were not included in the study (Figures 1–3). An exemplary MRI scan of a patient graded with PWMH=4 and SCWMH=3 can be seen in Figure 4.
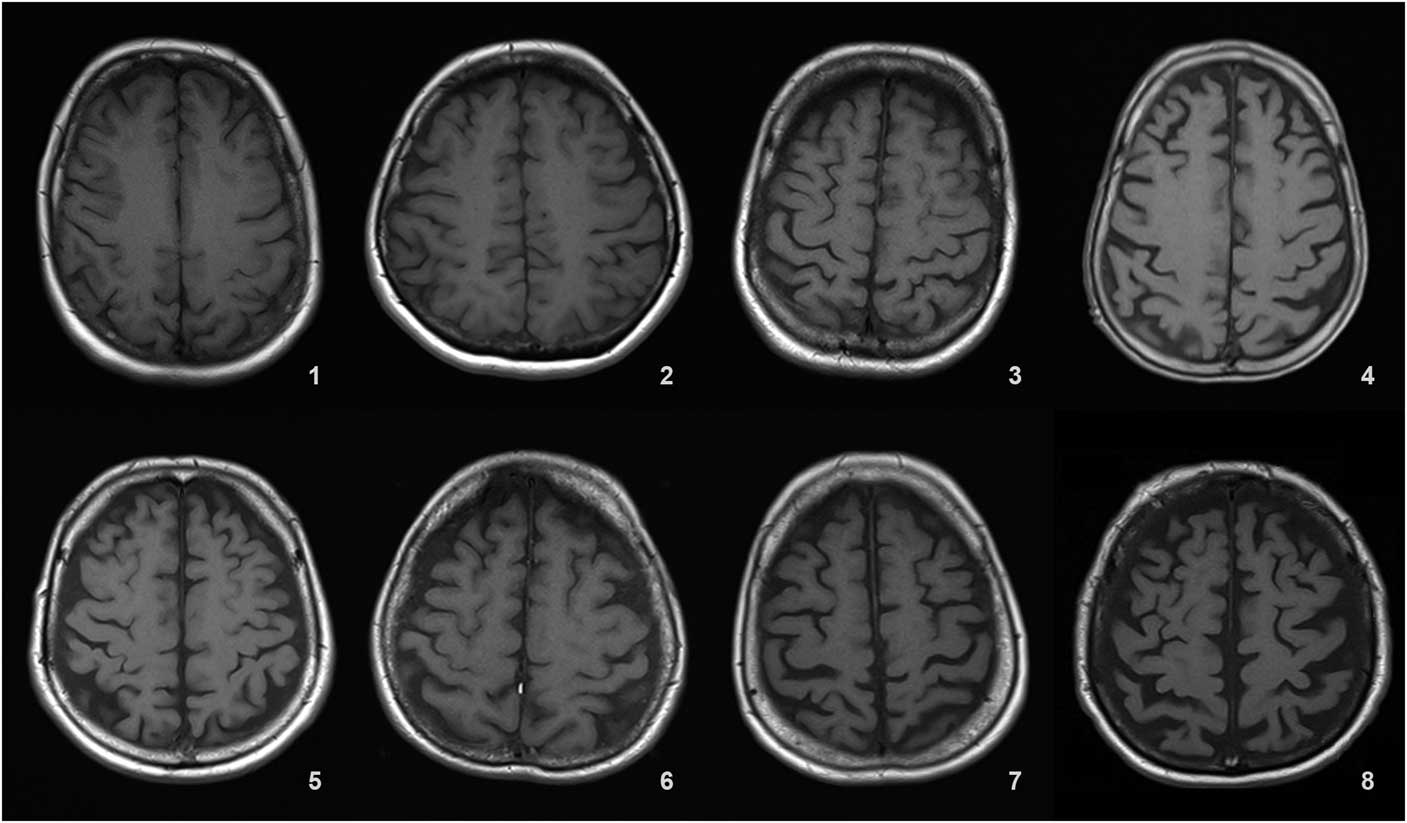
Figure 1 Reference MRIs corresponding to sulcal atrophy grades between 1-8.
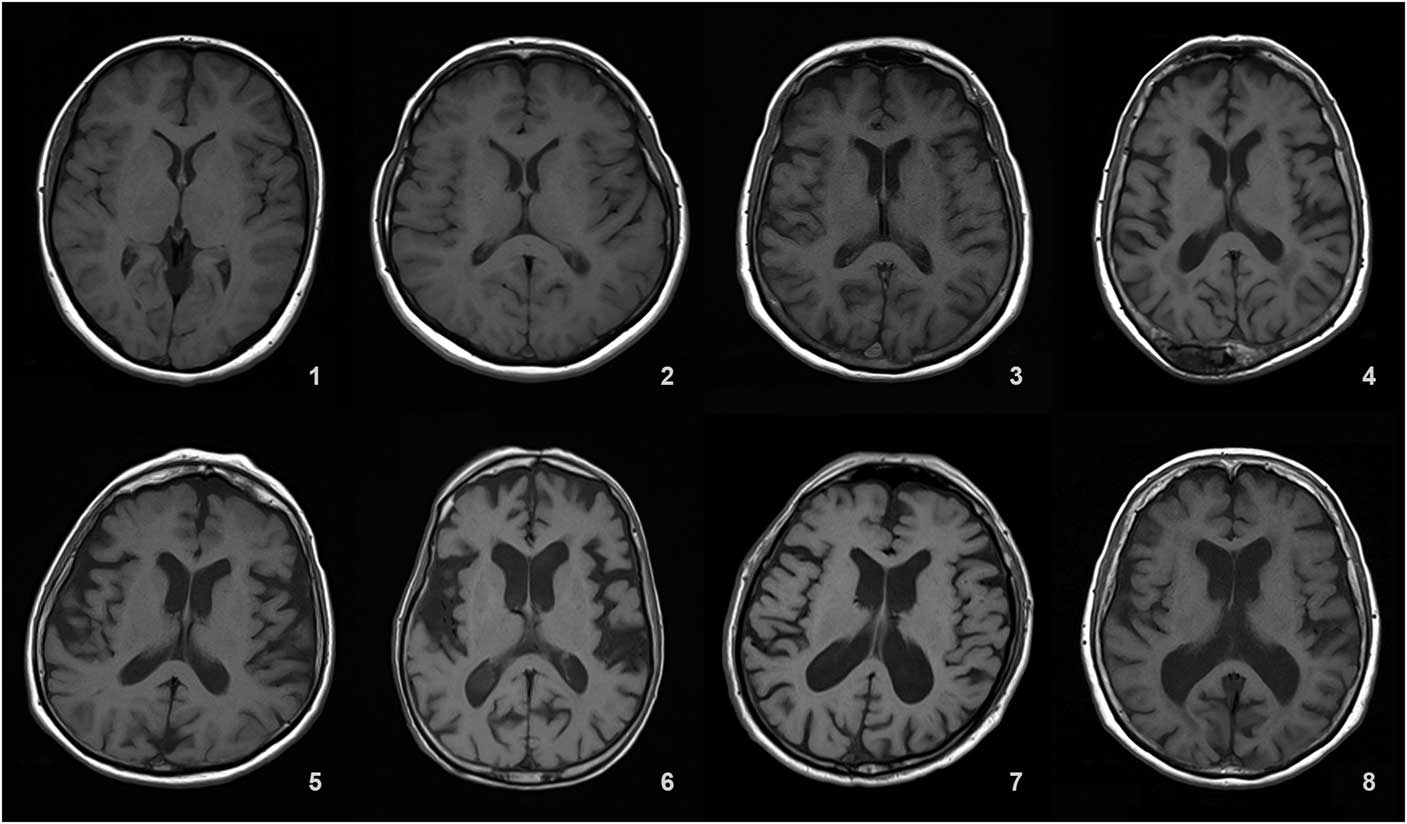
Figure 2 Reference MRIs corresponding to ventricular atrophy grades between 1-8.
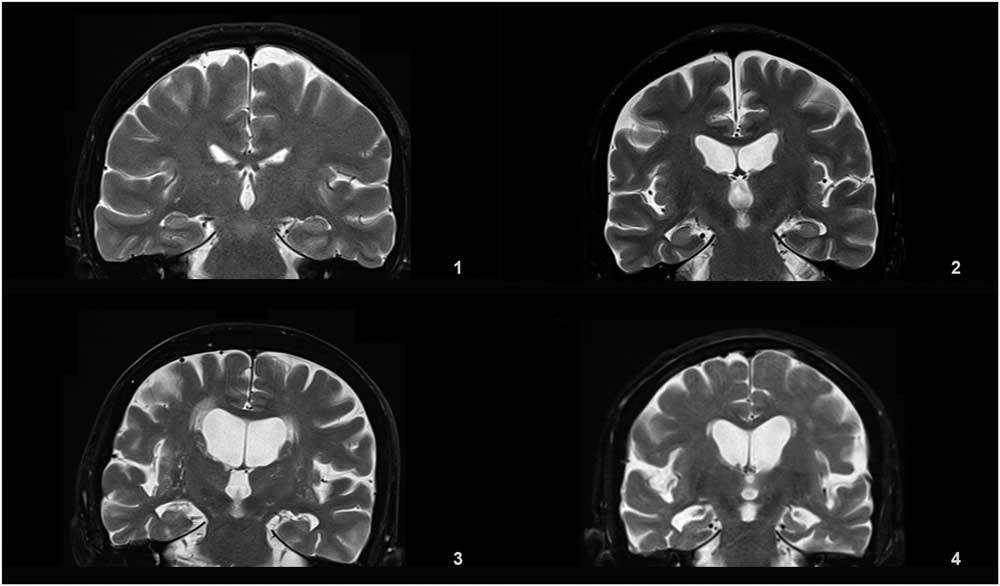
Figure 3 Reference MRIs corresponding to medial temporal atrophy grades between 1-4.
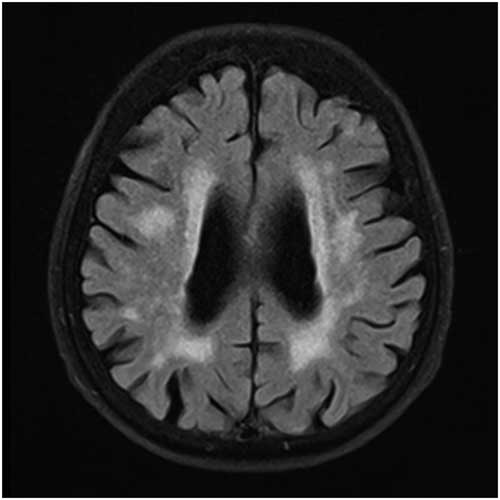
Figure 4 MRI of a patient with PWMH=4 and SCWMH=3.
Table 1 Details of the modified visual MRI rating scale
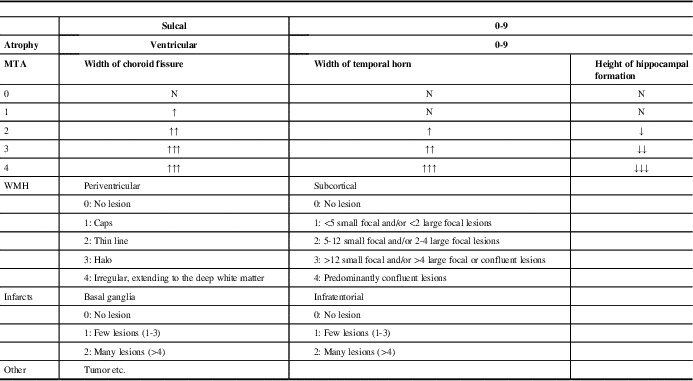
MRI=magnetic resonance imaging; MTA=medial temporal lobe atrophy; WMH=White matter hyperintensities
Statistical Analyses
The statistical analyses were performed using Statistical Package for Social Sciences for Windows 23.0. Numeric variables of groups were assessed with the Kruskal-Wallis H-test and Mann-Whitney U-test. Categoric variables were assessed with the ꭓ2-test. The differences between AD and ND groups were assessed with the Mann-Whitney U-test and ꭓ2-test. Cutoff values for the measurements of ND and degenerative processes were determined based on receiver operating characteristic curve analysis. The measurements were categorized using the cutoff values, and sensitivity and specificity were calculated for their combinations. p<0.05 was considered statistically significant.
Results
Demographic features of the patients are given in Table 2. Our mean scores for the MMSE and GDS indicate mild cognitive impairment (MCI) and mild depression because of some patients’ high level of education and cognitive reserve, and subtle depressive findings, which they did not mention in scales. Table 3 shows SA, VA, MTA, PWMH, SCWMH, BGI, ITI, and total scores of all patients according to the MVMRS scale. The SA score (SAs) (p=0.001), VA score (VAs) (p<0.0001), MTA score (MTAs) (p<0.0001), PWMH score (PWMHs) (p=0.048), SCWMH score (SCWMHs) (p=0.015), and total score (Ts) (p<0.0001) in the degenerative group are significantly higher than those in the ND group (Table 3). The SAs, VAs, MTAs, PWMHs, SCWMHs, and Ts are found to be increasing significantly with age (Supplementary Table 1). The SAs (p=0.002), VAs (p<0.0001), MTAs (p=0.001), and Ts (p<0.0001) are significantly higher in males (Supplementary Table 2). There is no significant relationship between the parameters and the level of education and the duration of complaint. The results show nine patients (9.3%) have a family history of dementia. Forgetfulness is the only complaint for 34 (72.3%) subjects with depression and 37 (74%) subjects with AD. In 26 patients (26.8%), other complaints such as word finding difficulties (6.2%), attention deficits (7.2%), walking and balance impairment (9.3%), depressive symptoms (16.5%), and hallucinations (5.2%) are documented. Only 21.3% of the patients in the ND group present typical depressive complaints accompanied by forgetfulness. The VAs (p=0.022), PWMHs (p=0.009), and Ts (p=0.009) are found to be significantly lower in patients with attention deficits; SAs (p=0.037), VAs (p=0.009), and Ts (p=0.008) are significantly higher in patients with walking and balance impairment; BGI scores (BGIs) (p=0.026) are significantly higher in those displaying depressive symptoms (Supplementary Table 3).
Table 2 Demographic features of the patients

AD=Alzheimer’s disease; CDR=Clinical dementia rating scale; GDS=Geriatric depression scale; MMSE=Mini Mental State Examination; SD=standard deviation
Table 3 Documentation of the patients’ scores of the sulcal/ventricular atrophy, medial temporal lobe atrophy, white matter hyperintensities, and total
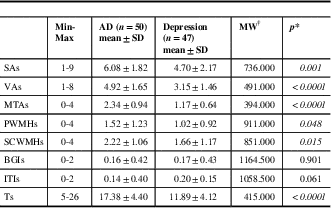
*p<0.05 is considered statistically significant. †Mann-Whitney U-test
AD=Alzheimer’s disease; BGIs=basal ganglia infarct score; ITIs=infratentorial infarct score; MTAs=medial temporal lobe atrophy score; PWMHs=periventricular white matter hyperintensity score; SAs=sulcal atrophy score; SCWMHs=subcortical white matter hyperintensity score; SD=standard deviation; Ts=total score; VAs=ventricular atrophy score
Regarding the parameters considered in the scale and found to be significant, the cutoff values are determined as >6 for SAs, >6 for VAs, >2 for MTAs, >3 for PWMHs, >3 for SCWMHs, and >16 for Ts. The sensitivities of VAs, PWMHs, SCWMHs, and Ts, and both sensitivity and specificity of MTAs, are high. When viewed in combination, sensitivities of VAs + PWMHs, VAs + SCWMHs, VAs + MTAs, and MTAs + PWMHs and the specificities of SAs + PWMHs, SAs + SCWMHs, VAs + SCWMHs, MTAs + PWMHs, MTAs + SCWMHs, and VAs + MTAs are high. Details are given in Tables 4 and 5.
Table 4 Receiver operating characteristic analysis results of the MVMRS parameters considered individually
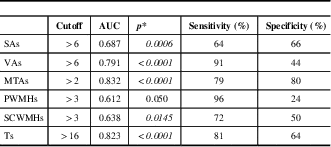
*p<0.05 is considered statistically significant.
AUC=area under the curve; MTAs=medial temporal lobe atrophy score; MVMRS=modified visual MRI rating scale; PWMHs=periventricular white matter hyperintensity score; SAs=sulcal atrophy score; SCWMHs=subcortical white matter hyperintensity score; Ts=total score; VAs=ventricular atrophy score
Table 5 Receiver operating characteristic analysis results of the MVMRS parameters in dual combinations
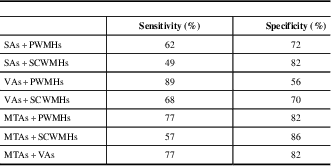
MTAs=medial temporal lobe atrophy score; MVMRS=modified visual MRI rating scale; PWMHs=periventricular white matter hyperintensity score; SAs=sulcal atrophy score; SCWMHs=subcortical white matter hyperintensity score; Ts=total score; VAs=ventricular atrophy score
There is a negative correlation between MMSE scores and SAs (p=0.011), VAs (p=0.004), MTAs (p=0.001), SCWMHs (p=0.032), and Ts (p<0.0001). A positive correlation is observed between CDR and MTAs (p=0.035), PWMHs (p=0.022), and Ts (p=0.045) (Supplementary Table 4). EEG could be performed in 53 (54.6%) patients, where 15 of them (15.4%) showed disorganization in baseline rhythms. The VAs (p=0.022) and MTAs (p=0.020) are found to be significantly higher in patients with disorganized bioelectrical activity seen on EEG (Supplementary Table 5).
Discussion
Forgetfulness is a very common symptom in neurology clinical practice among all ages. Most of the patients who complain about forgetfulness have a degenerative disease or depression. As each require different treatment and follow-up strategies, we preferred to take AD—the most common cause of degenerative dementia—to represent the degenerative group, and depression—the most common ND cause of forgetfulness—for the ND group.
By using MVMRS for screening, MRIs of patients admitted to the neurology clinic with complaint of forgetfulness, SAs, VAs, MTAs, PWMHs, SCWMHs, and Ts are found to be significant in discriminating degenerative and ND processes. The observations of high sensitivity for VAs, PWMHs, SCWMHs, and high sensitivity and specificity for MTAs are consistent with other studies.Reference Yue, Arnold and Longstreth 2 , Reference Nestor, Rupsingh and Borrie 4 , Reference Debette and Markus 11 , Reference Scheltens, Leys and Barkhof 20 The high sensitivity of Ts, which has not been evaluated in previous studies, supports that the assessment of this scale as a whole is also informative.
The combined assessment of MTAs with VAs, SCWMHs, and PWMHs is found to be more meaningful than their individual evaluation, indicating that the combined assessment is beneficial in identifying the degenerative process. The fact that the combined evaluation of SAs and SCWMHs is more specific than their individual evaluations supports the findings that subcortical lesions increase the risk of cognitive impairment.Reference Debette and Markus 11 , Reference Bombois, Debette and Delbeuck 25 , Reference Bombois, Debette and Bruandet 26
MRI grading scales have already been developed to demonstrate the relationship between the signs of cognitive impairment observed in elderly—forgetfulness being at the forefront—and cerebral atrophy and white matter changes.Reference Yue, Arnold and Longstreth 2 , Reference Erkinjuntti, Gao and Lee 8 , Reference Fazekas, Chawluk and Alavi 15 , Reference Scheltens, Leys and Barkhof 20 An ideal scale should allow for grading of both WMH and atrophic changes in a standardized and practical manner suitable for clinical use. In previous studies, atrophy has been evaluated mainly in the temporal and frontal regions, whereas the widths of the central sulci and lateral ventricles have also been exploited.Reference Yue, Arnold and Longstreth 2 , Reference Breteler, van Amerongen and van Swieten 22 , Reference Whitwell, Peterson and Negash 23 It has been shown that in addition to the cortical sulci atrophy the evaluation of interhemispheric atrophy is also reliable.Reference Baskaya, Acar and Kandemir 27 In addition to SA, ventricular enlargement has been proposed as a sensitive and objective marker in identifying the degenerative process, and it has been reported to negatively affect the cognitive performance in elderly without dementia.Reference Yue, Arnold and Longstreth 2 , Reference Nestor, Rupsingh and Borrie 4 , Reference Breteler, van Amerongen and van Swieten 22 It has been shown that MTA, VA, and SA increase over time in AD patients,Reference Jack, Shiung and Gunter 3 , Reference Iheme, Baskaya and Sennaz 28 whereas SA and VA better correlate with changes in neuropsychometric tests than MTA.Reference Jack, Shiung and Gunter 3 In our study, especially high VAs, MTAs, and Ts are also found to be significant in terms of degenerative process. It has been observed that MMSE scores decreased as sulcal and ventricular enlargement increased.Reference Liu, Lipnicki and Zhu 6 , Reference Breteler, van Amerongen and van Swieten 22 In our study, it is unsurprisingly observed that the increase in SAs, VAs, MTAs, and Ts and the decrease in MMSE scores show a significant correlation, and that MTAs and Ts increase significantly in correlation with the CDR score.
There are several verified and commonly used rating scales for visual scoring of WMH.Reference Erkinjuntti, Gao and Lee 8 , Reference Fazekas, Chawluk and Alavi 15 , Reference Scheltens, Barkhof and Leys 16 , Reference Scheltens, Erkinjunti and Leys 21 Similar to our study, in some of these scales frontal and occipital “caps” or pencil-thin linings are considered normal.Reference Barber, Scheltens and Gholkar 10 , Reference Schmidt, Fazekas and Kleinert 29 It has been shown that occipital “caps” are more common in all dementia groups (VD, AD, and LBD), whereas periventricular bands are more severe in AD and VD cases.Reference Barber, Scheltens and Gholkar 10 Although it is believed that PWMH better reflects total WMH burden, and PWMH and SCWMH are intercorrelated processes sharing the same etiology that may even have contiguous localization, their independent evaluations may be arbitrary.Reference DeCarli, Fletcher and Ramey 18 Periventricular bands and caps have been found to be caused by demyelination related to loss of ependymal lining and subependymal gliosis, whereas punctate and confluent lesions are due to ischemic tissue damage.Reference Fazekas, Kleinert and Offenbacher 19 Scheltens et alReference Scheltens, Barkhof and Leys 16 , Reference Scheltens, Erkinjunti and Leys 21 and Erkinjuntti et alReference Erkinjuntti, Gao and Lee 8 included hyperintensities in the basal ganglia, and Scheltens et alReference Scheltens, Barkhof and Leys 16 included infratentorial hyperintensities in their scales, and suggested that such hyperintensities are evidence of small vessel diseases.
The prevalence, severity, and distribution of WMH in both healthy older adults and those with dementia are strongly correlated with vascular risk factors and age.Reference Barber, Scheltens and Gholkar 10 , Reference Debette and Markus 11 , Reference de Groot, de Leeuw and Oudkerk 17 The imaging studies demonstrated that severe WMH is associated with cognitive dysfunction, increases the risk of developing dementia and AD in healthy population, and has greater combined effect with MTA and degenerative process on cognition.Reference Debette and Markus 11 , Reference DeCarli, Fletcher and Ramey 18 , Reference Bombois, Debette and Bruandet 26 , Reference van der Flier, van Straaten and Barkhof 30 The relation between WMH load and cognitive impairment, especially executive functions, speed of information processing, and depressive symptoms, in elderly people without dementia has also been reported.Reference Debette and Markus 11 – Reference Wardlaw, Valdés Hernández and Muñoz-Maniega 14 , Reference de Groot, de Leeuw and Oudkerk 17 , Reference Bombois, Debette and Delbeuck 25 , Reference van der Flier, van Straaten and Barkhof 31 Although a negative correlation between MMSE scores and SCWMHs is observed in our study, there is no correlation with PWMHs, which is consistent with the finding of Barber et al.Reference Barber, Scheltens and Gholkar 10 It is noticed that the higher the CDR score, the more frequent the PWMHs. Some researchers have stated that they detected the negative effect of PWMH but not SCWMH on cognitive function; however, they did not completely exclude the effect of subcortical lesions as they may have gone unnoticed owing to the tests used.Reference de Groot, de Leeuw and Oudkerk 17
In our study, a large proportion of both degenerative and ND group patients have forgetfulness complaints alone, whereas a small number of depressed patients have typical depressive complaints accompanied by forgetfulness. The fact that the proportion of patients with depressive symptoms in both groups is very low suggests that forgetfulness may conceal typical depressive complaints such as unhappiness, reluctance, and anergy in the ND group as well. The fact that all patients with complaints of attention deficit accompanying forgetfulness are from the ND group and that they present low Ts suggests that depressive patients often express the symptom of “forgetfulness and attention deficit” as a complaint. Non-cognitive complaints such as walking and balance disorders may also be associated with WMH,Reference Longstreth, Manolio and Arnold 9 , Reference Wardlaw, Valdés Hernández and Muñoz-Maniega 14 which is explained by the increase in WMH that affects the descending and ascending pathways in the periventricular region.Reference Longstreth, Manolio and Arnold 9 Although a relationship between walking and balance impairments and WMH has not been detected in our study, it has been observed that SAs, VAs, and Ts are higher in these patients.
Cerebrovascular diseases, VD, and AD are frequently seen in the same age group and have common risk factors. It is stated in the literature that these abnormalities are less frequent in basal ganglia and infratentorial regions in healthy controls and AD,Reference Yue, Arnold and Longstreth 2 , Reference Scheltens, Barkhof and Leys 16 but in patients with VD basal ganglia lesions are more common and may assist in differential diagnosis.Reference Barber, Scheltens and Gholkar 10 In MCI patients, basal ganglia or infratentrorial hyperintensities have been less frequently observed and have not been associated with cognitive parameters.Reference Debette, Bombois and Bruandet 13 , Reference Bombois, Debette and Delbeuck 25 In recent years, depression in the elderly has been reported more frequently in patients with silent BGIs, especially those with left hemisphere localization, but no association with silent infratentorial infarcts has been detected.Reference Wu, Feng, Xu and Hua 32 In our study, BGI are detected in a very small number of patients and there is no difference between the two groups in this respect. However, it is noteworthy that most of the identified BGI are bilateral and that depressive symptoms are more common in these patients.
Inconsistent with the literature, we observe that sulcal and ventricular enlargement together with the MTA and the prevalence and severity of WMH increase with age, and they appear more severely in AD patients.Reference Erkinjuntti, Gao and Lee 8 , Reference Barber, Scheltens and Gholkar 10 , Reference Debette and Markus 11 , Reference de Groot, de Leeuw and Oudkerk 17 , Reference Schmidt, Fazekas and Kleinert 29 Unlike other studies, there is no significant difference between the two genders in terms of WMH,Reference Yue, Arnold and Longstreth 2 , Reference de Groot, de Leeuw and Oudkerk 17 although SAs, VAs, MTAs, and Ts are found to be higher in males compared with females, which supports the findings of Yue et al.Reference Yue, Arnold and Longstreth 2
Conclusions
MVMRS, which we recommend for the standardization of MRI evaluation in examination of patients with forgetfulness, can assess both atrophy and white matter damage, as well as MTA and infarcts, in the basal ganglia and infratentorial regions. This scale gives us the opportunity to evaluate such parameters in different combinations and as a whole. We would like to emphasize the importance of distinguishing depression, a common problem in the elderly, from a degenerative process, and the standard assessment of MRI in this respect. Although our data set is short in hyperintensities in the basal ganglia and infratentorial regions, we think that the relationship between depressive symptoms and basal ganglia lesions should be considered. In future studies, it would be useful to use MVMRS to evaluate wider groups of patients with different patterns of cognitive impairment and dementia subtypes.
Acknowledgments
This work is partially supported by the Scientific and Technological Research Council of Turkey (TUBITAK) under grant no. 111E083. The authors thank Ceyda Afacan for the statistical analyses and Ishak Denizcan Ince for the translation.
Standardized reference image set used in this study is available for research purposes. Those interested may contact the corresponding author.
Disclosures
BZY, MK, SMT and DU report grants from Scientific and Technological Research Council of Turkey (TUBITAK), outside the submitted work. ST has nothing to disclose. Work was carried out at Bayindir Icerenkoy Hospital, Department of Neurology, 34752 Atasehir/Istanbul.
Supplementary Materials
To view supplementary material for this article, please visit https://doi.org/10.1017/cjn.2018.333


