

During the editing process incorrect labels were applied to figure 3, panels E, F & G. The correct representation of the figure is shown here.
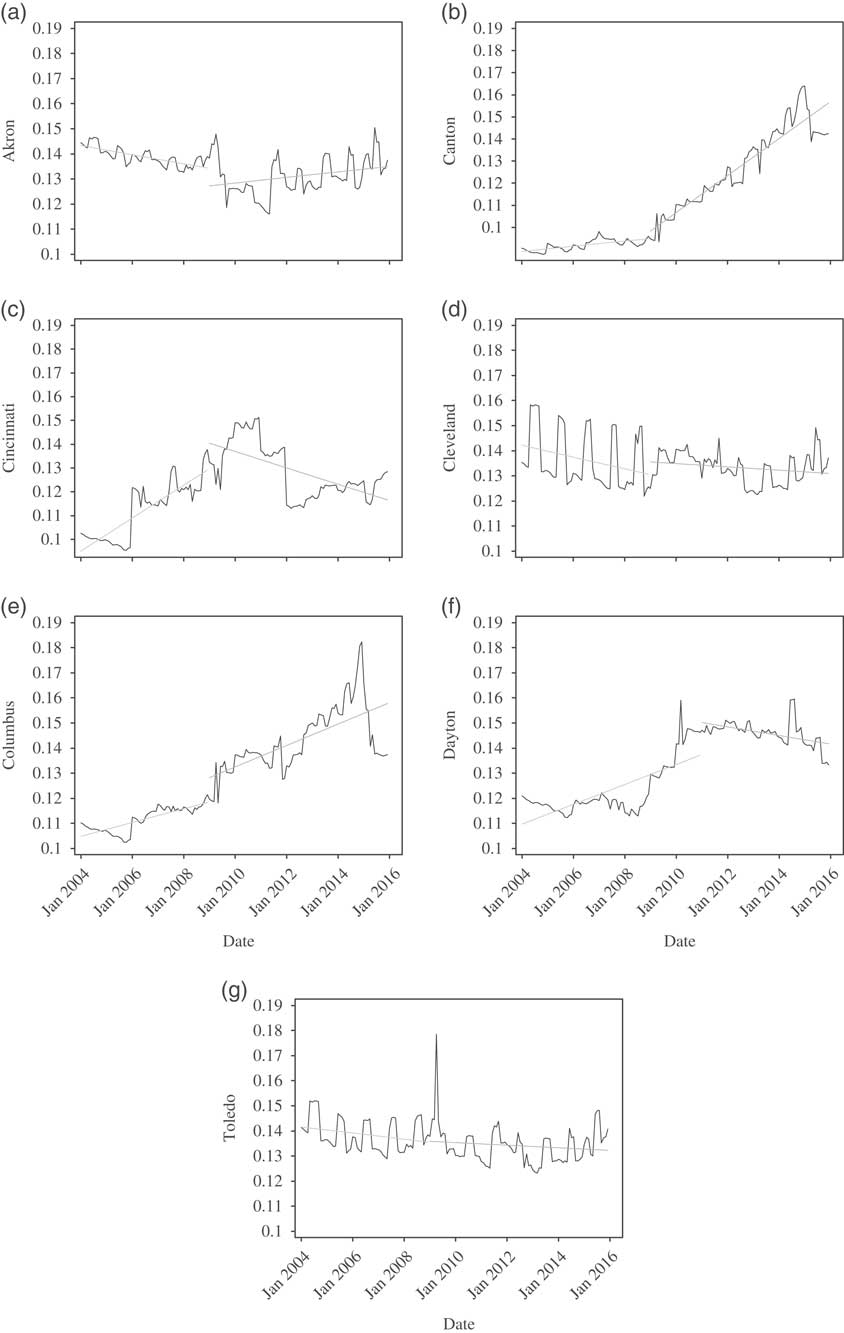
Figure 3 Interrupted time series plots. (a) Akron, (b) Canton, (c) Cincinnati, (d) Cleveland, (e) Columbus, (f) Dayton and (g) Toledo.
The Publisher apologises for the error.

