Introduction
Pesticide efficacy is dependent on the sufficient delivery of active ingredients to targeted pests (Creech et al. Reference Creech, Henry, Werle, Sandell, Hewitt and Kruger2015; Hislop Reference Hislop1987). According to Knoche (Reference Knoche1994), foliar-applied herbicide performance was inversely related to droplet sizes in 71% of 159 experiments. However, small droplets (<100 µm) are prone to drift (Frank et al. Reference Frank, Johnson, Braun, Halliday and Harvey1991), therefore, droplet spectral analysis is used to manage the conflict between pesticide performance and nontarget drift (Al Heidary et al. Reference Al Heidary, Douzals, Sinfort and Vallet2014; Makhnenko et al. Reference Makhnenko, Alonzi, Fredericks, Colby and Dutcher2021; Matthews et al. Reference Matthews, Bateman and Miller2014). With ground-based agricultural sprayers, droplet spectra of a given spray tip are classified under controlled, indoor conditions with high-speed cameras, laser diffraction, or phase doppler particle analysis (Anonymous 2023; Nuyttens et al. Reference Nuyttens, Baetens, De Schampheleire and Sonck2007; Sijs et al. Reference Sijs, Kooij, Holterman, Van De Zande and Bonn2021). Spray tips are then oriented to ensure uniform deposition along the length of an equipment-mounted boom. These systems are designed to deliver inherently uniform spray deposition, so methods employed to assess in-field spray deposition have focused on crop canopy penetration (Chen et al. Reference Chen, Lan, Douzals, Ouyang, Wang and Xu2020; Huang et al. Reference Huang, Wang, Wongsuk, Qi, Liu, Qiao, Zhong and He2023; Wang et al. Reference Wang, Lan, Qi, Chen, Hewitt and Han2019) or wind-mediated drift effects (Fritz et al. Reference Fritz, Hoffmann, Bagley and Hewitt2011; Wang et al. Reference Wang, Han, Li, Andaloro, Chen, Hoffmann, Han, Chen and Lan2020). Because particle analysis systems are impractical for field use, researchers have sought to estimate droplet sizes and overall deposition coverage based on stains deposited on water-sensitive paper (WSP) or other media (Cunha et al. Reference Cunha, Carvalho and Marcal2012; Fritz et al. Reference Fritz, Hoffmann, Bagley and Hewitt2011; Hewitt et al. Reference Hewitt, Johnson, Fish, Hermansky and Valcore2002; Li et al. Reference Li, Giles, Andaloro, Long, Lang, Watson and Qandah2021a, Reference Li, Giles, Niederholzer, Andaloro, Lang and Watson2021b; Martin et al. Reference Martin, Woldt and Latheef2019; Panneton Reference Panneton2002; Salyani and Fox Reference Salyani and Fox1999; Salyani et al. Reference Salyani, Zhu, Sweeb and Pai2013; Wang et al. Reference Wang, Han, Li, Andaloro, Chen, Hoffmann, Han, Chen and Lan2020; Woldt et al. Reference Woldt, Martin, Lahteef, Kruger, Wright, McMechan, Proctor and Jackson-Ziems2018; Zhu et al. Reference Zhu, Salyani and Fox2011).
There are several limitations in using WSP to assess spray deposition. Most WSP products comprise a sampling area that is less than 30 cm2 and are spaced along unidimensional transects at intervals of 0.5 m (Wen et al. Reference Wen, Zhang, Chen, Huang, Yi, Xu, Li and Hewitt2019; Zhang et al. Reference Zhang, Zhang, Sun, He, Fu, Qi, Yu, Jin, Zhang and Liu2021), 1 m (Ahmad et al. Reference Ahmad, Qiu, Dong, Ma, Huang, Ahmed and Chandio2020; Qin et al. Reference Qin, Qiu, Xue, Chen, Xu and Zhou2016), or more (Bonds et al. Reference Bonds, Fritz and Thistle2023; Fritz et al. Reference Fritz, Gill and Bretthauer2019). Previously reported research involving WSP-assessed spray deposition sampled between 0.01% and 0.5% of the treated area (Qin et al. Reference Qin, Qiu, Xue, Chen, Xu and Zhou2016; Wang et al. Reference Wang, Lan, Qi, Chen, Hewitt and Han2019). Such discrete sampling may be sufficient for systems with inherently uniform spray delivery but too low to adequately assess deposition uniformity of an agricultural spray drone. However, Richardson et al. (Reference Richardson, Rolando, Somchit, Dunker, Strand and Kimberley2020) used Gaussian-modeled deposition on steel plates and compared this with modeled deposition estimates based on fluorescence detected on continuous string and found similar slopes across sampling resolutions of 0.25 to 1.0 m. In preliminary research (Koo et al. Reference Koo, Godara, Romero Cubas and Askew2024a, Reference Koo, Henderson and Askew2024b), our continuous deposition analysis revealed multiple peaks near the center of the spray drone flight path at near 2-m height that were not resolved or reported in the Richardson et al. (Reference Richardson, Rolando, Somchit, Dunker, Strand and Kimberley2020) paper involving the same model of spray drone. Spray drones are designed to achieve efficient delivery of low-volume spray and typically use rotor-induced wind to disperse small droplets in an effort to increase spray coverage (Qin et al. Reference Qin, Qiu, Xue, Chen, Xu and Zhou2016; Zheng et al. Reference Zheng, Yang, Liu, Wang, Norton, Chen and Tan2018). These design elements are likely to cause changes in deposition patterns depending on drone height and ambient wind (Hunter et al. Reference Hunter, Gannon, Richardson, Yelverton and Leon2020; Richardson et al. Reference Richardson, Rolando, Somchit, Dunker, Strand and Kimberley2020).
Further limitations of WSP are caused by physical characteristics of the bromophenol-blue-coated paper, which vary in response to ambient moisture (Turner and Huntington Reference Turner and Huntington1970). Droplets smaller than 50 µm in diameter do not have enough moisture to create stains on WSP (Hoffmann and Hewitt Reference Hoffmann and Hewitt2005), and small droplet stains that are created may not be resolved by scanners. At relative humidity greater than 85%, WSP stains can increase in size or occur spontaneously (Anonymous 2002; Franz et al. Reference Franz, Bouse, Carlton, Kirk and Latheef1998). An overlap of droplet stains can also generate erroneous data, as image analysis software will detect the overlapped droplets as a single droplet. This phenomenon has not been characterized but has been shown to increase with increasing spray volume (Cunha et al. Reference Cunha, Carvalho and Marcal2012; Zhu et al. Reference Zhu, Salyani and Fox2011). Previous researchers have suggested that utility of WSP to estimate deposition patterns is limited when ≥20% of the WSP area is covered by droplet stains (Cunha et al. Reference Cunha, Carvalho and Marcal2012; Zhu et al. Reference Zhu, Salyani and Fox2011). Ellipse-shaped stains also cause an issue, as image analysis software assumes that droplets have circular shapes to calculate droplet sizes (Deveau Reference Deveau2021b). This is another source of error that will be exacerbated with the advent of agricultural drone sprayers, as these sprayers cause a large percentage of elongated stain objects or streaks due to wind shear (Fritz et al. Reference Fritz, Gill and Bretthauer2019). Detected objects derived from stains on WSP are identified based on differential hue and saturation, then detected pixel area is converted to an estimated stain diameter assuming all objects are circular (Cunha et al. Reference Cunha, Carvalho and Marcal2012; Zhu et al. Reference Zhu, Salyani and Fox2011). Estimated stain diameters are converted by a spread factor, specific to each type of WSP (Deveau Reference Deveau2021a), to represent actual droplet size (Ahmad et al. Reference Ahmad, Qiu, Dong, Ma, Huang, Ahmed and Chandio2020; Anonymous 2002; Cunha et al. Reference Cunha, Farnese and Olivet2013; Salyani and Fox Reference Salyani and Fox1994, Reference Salyani and Fox1999; Zhu et al. Reference Zhu, Salyani and Fox2011).
Given that WSP does not allow for extraction of spray deposits and further estimation of mass per unit area of spray-delivered compounds, relationships of and errors associated with stain coverage on WSP are often limited to relative comparisons that vary by type of WSP (Deveau Reference Deveau2021c) rather than quantifiable deposition. Mylar® cards or other plastic- and glass-based samplers are methods that enable pesticide quantification. Spray solutions typically contain dye or fluorescent tracers that are used as a proxy for pesticides. Tracer-treated Mylar® cards are removed from the field, washed with ethanol, and analyzed by a spectrofluorometer. The fluorescence value can be converted to a mass dye per area using predetermined standard curves (Fritz et al. Reference Fritz, Hoffmann, Bagley and Hewitt2011; Wang et al. Reference Wang, Han, Li, Andaloro, Chen, Hoffmann, Han, Chen and Lan2020). Much like Mylar® cards, extracts of pesticide-sprayed filter papers were analyzed by liquid, gas, or mass chromatography (Hewitt et al. Reference Hewitt, Johnson, Fish, Hermansky and Valcore2002; Li et al. Reference Li, Giles, Andaloro, Long, Lang, Watson and Qandah2021a, Reference Li, Giles, Niederholzer, Andaloro, Lang and Watson2021b). Chromatography and fluorometry are robust methods to quantify pesticide delivery, although their costs usually restrict sampling area below that needed to assess highly variable deposition patterns typical of agricultural spray drones. Cotton string and monofilament line also were utilized by researchers using extraction and analysis techniques similar to Mylar® card and filter paper assessment (Fritz et al. Reference Fritz, Hoffmann, Bagley and Hewitt2011; Martin et al. Reference Martin, Woldt and Latheef2019; Wang et al. Reference Wang, Han, Li, Andaloro, Chen, Hoffmann, Han, Chen and Lan2020; Woldt et al. Reference Woldt, Martin, Lahteef, Kruger, Wright, McMechan, Proctor and Jackson-Ziems2018). String samplers can generate continuous data, albeit on a narrow, unidimensional transect. This technique is useful for assessing spray drift but not for characterizing multidimensional spray patterns.
Thus, the development of a new analytical method that can characterize spray deposition on continuous and/or multidimensional areas with spatially referenced, mass-to-area assessment of extracted pesticide or tracer dye is needed. Furthermore, assessing accuracy of digitally analyzed stain coverage on paper media to detect droplet deposition quantity and spectral relationships requires spatial reference of stain images and mass-to-area quantification of extracted compounds. To achieve this goal, we utilized spectrophotometric analysis of tracer dye extracted from digitally imaged Kraft paper. A custom Python-based image analysis method, SprayDAT, was compared with the ImageJ-based image analysis software, DepositScan, to estimate total spray deposition and droplet spectral characterization based on actual droplet sizes. SprayDAT offers two advantages over DepositScan that are necessary to deal with the thousands of images generated by continuous sampling of economical Kraft paper. The first is batch processing of images and the second is that code is easily modified depending on the needs of users. To realize these software advantages, SprayDAT must be compared with DepositScan for stain cover and droplet spectral estimation. Because our method allows for both stain imaging and colorant extraction from the same surface, this paper will be the first to report a direct comparison between extracted colorant and digitally analyzed stain objects per unit area. The first objective of this study was to assess the accuracy of digitally imaged stains analyzed by two computer software packages to estimate total spray deposited and droplet spectral characteristics compared with measured spray delivery rates, manufacturer-reported droplet spectral characteristics, and extracted blue colorant quantified via spectrophotometric analysis. Our second objective was to assess the validity of a novel computational method for assessing stain objects as a measure of spray deposition quantity and droplet spectral characterization.
Materials and Methods
Sampler and Proxy
White Kraft paper (Oren International, Pensacola, FL) and colorant (Blazon® blue spray pattern indicator, Milliken, Spartanburg, SC) were selected as the sampler and pesticide proxy. This combination provides high-contrast stains like WSP but offers affordable, scalable spatial sampling and easy water extraction and spectrophotometric analysis of the proxy. Because the Kraft paper and dye method costs 0.2 cents for each US$1 spent on WSP, larger sampling areas are feasible. Preliminary studies were conducted to evaluate various solvents and volumes to assess the extraction efficiency of the proxy colorant. Colorant was extracted from a 528-cm2 area of Kraft paper at 99% efficiency (data not shown) using 100 ml of tap water in 125-ml screw-top jars shaken at 250 rpm with a G2 Gyratory Shaker (New Brunswick Scientific, Edison, NJ) for 10 min. A 0.4-ml aliquot was removed and mixed with 1.6 ml of tap water, and absorbance was read at 650 nm with a Genesys 5 spectrophotometer (Thermo Fisher Scientific, Waltham, MA). Equation 1 describes the second-order polynomial regression (R2 = 0.99) that relates colorant absorbance value (a) at 650 nm and known amount of colorant (c, µl of colorant 100 ml−1 tap water).
Sample Preparation
Known doses of colorant were applied to 20.3 cm by 30.5 cm Kraft paper using a spray boom equipped with a single flat-fan nozzle (TeeJet® XR11001VS, Spraying Systems, Wheaton, IL) operated at varying speeds at a pressure of 120 kPa, resulting in a flow rate of 4.2 ml s−1. The flow rate and nozzle were selected to mimic the manufacturer-supplied parameters of a DJI MG-1P agricultural spray drone (DJI, Shenzhen, China) that has been evaluated in other experiments. The colorant was mixed 1:1 with water and sprayed in a custom laboratory spray system. A rigid steel frame was prepared to maintain the spray height at 61 cm above the Kraft paper. Four Kraft papers were aligned, and the locations corresponding to the leading and trailing edges of each paper were marked on the steel frame. Thirty unique doses were applied by varying the nozzle speed, which was confirmed via high-speed video (Edgertronic, Sanstreak, Campbell, CA) at 1,500 frames s−1. The time required for the spray nozzle to traverse the distance of the paper was measured by the number of frames it was present in the video, and the speed was calculated. As all other factors were held constant, the application volume per unit area and the associated rate of colorant were linearly related to speed. All treated Kraft papers were scanned at 23.6 dots mm−1 (600 dpi) with a Ricoh MP C307 color scanner (Ricoh, Tokyo, Japan). Colorant was extracted from a 619-cm2 area of Kraft paper using 100 ml of tap water in 125-ml screw-top jars shaken at 250 rpm with a G2 Gyratory Shaker (New Brunswick Scientific) for 10 min. A 0.4-ml aliquot was removed and mixed with 1.6 ml of tap water, and absorbance was read at 650 nm with a Genesys 5 spectrophotometer (Thermo Fisher Scientific).
Development of a New Image Analysis Method, SprayDAT (Spray Droplet Analysis Tool)
Image Conversion
Computational models were generated using Python 3.9 and tested to measure deposition coverage based on colorant stains and to estimate droplet size. Scanned images were converted to grayscale images, and a selected threshold of 154 within the grayscale range of 0 to 255 was applied to create a binary mask of black droplet stains and white backgrounds. The threshold was found to best encompass all of the detected droplets without highlighting potential noise in the scanned images, such as dust or dirt particles. The outline of each stain was detected using the contour detection algorithm proposed by Suzuki and Abe (Reference Suzuki and Abe1985), and the areas of each stain were calculated based on Green’s theorem (Marsden and Tromba Reference Marsden and Tromba2003). Each stain was then considered to be a circle, and the diameter of each stain was estimated. The proportion of stain area and the number of stain objects were used to calculate spray coverage and droplet density, respectively.
Reference Stain Detection
To test the accuracy of stain detection by SprayDAT, nominal spot sizes of 100, 200, 300, 500, 1,000, and 2,000 µm in diameter on the reference card (ORBITRANSIT, Shanghai, China) were analyzed. The reference card was scanned at 23.6 dots mm−1 (600 dpi) using a Ricoh MP C307 color scanner (Ricoh). The diameters of the nominal-sized spots on the scanned images were analyzed by SprayDAT and compared with the DepositScan results.
Spread Factor
To estimate the actual droplet sizes from the Kraft paper sampler, the spread factor between the stain size and actual droplet sizes needed to be determined (Cunha et al. Reference Cunha, Carvalho and Marcal2012, Reference Cunha, Farnese and Olivet2013; Zhu et al. Reference Zhu, Salyani and Fox2011). The spread factor between Kraft paper and blue colorant, which has not been reported by previous researchers, was determined across a range of discrete droplet diameters, using methods similar to those of Smith et al. (Reference Smith, Askew, Morris, Shaw and Boyette2000). A custom-built droplet generator consisting of a 2.5-cm spinning disk was operated via a brushless motor at 3,750 rpm. Droplets of discrete size were ejected through a 0.5 cm by 1.0 cm aperture in an enclosure around the spinning disk at 46 cm above the sampling location. A camera slider (GVM GT-60D, Great Video Maker, Philadelphia, PA) was fit with a horizontal platform that contained a 5-cm petri dish filled with a biphasic solution of polydimethylsiloxane (PDMS) (MicroLubrol®, Type 200 Silicone Oil, MicroLubrol, Clifton, NJ), and a 25-cm2 sheet of Kraft paper. The lower 1 mm of the dish contained PDMS of 12,500 cSt viscosity, while the upper 2 mm layer contained PDMS of 100 cSt viscosity. Droplets are suspended in the oil solution at the interface between the two PDMS layers of varying viscosity, allowing for accurate imaging on a narrow plane. Both PDMS-filled petri dishes and Kraft papers were placed 20, 32, 43, 55, 66, 77, and 89 cm from the droplet generator to achieve droplet diameters of 112, 143, 183, 218, 246, 275, and 315 µm, respectively, with a standard deviation less than 10% in all cases.
After treatment with different-sized droplets, the petri dishes were carefully transferred to a white translucent panel illuminated underneath with an LED light (Craftsman® 4500LM 46W LED Work Light, Craftsman, Towson, MD) and photographed with a digital camera (Canon EOS 5D, Canon, Tokyo, Japan) at an effective resolution of 157 dots mm−1 (2,400 dpi). Kraft papers were scanned at 23.6 dots mm−1 (600 dpi) with a Ricoh MP C307 color scanner (Ricoh). The droplet sizes and stain diameters were measured by counting pixels and were converted based on known pixel to distance relationships using the binarization threshold of 154 within the grayscale range of 0 to 255. The spread factor was calculated as the difference between droplet diameters in the PDMS solution and stain diameters on Kraft paper.
Droplet Spectra Analysis
A total of 120 scanned sample images were digitally analyzed via SprayDAT and compared with analyses from ImageJ-based DepositScan software developed by USDA-ARS (Zhu et al. Reference Zhu, Salyani and Fox2011). Detected droplet stains on each scanned image were converted to actual droplet sizes based on the calculated spread factor. Afterwards, the volume of each droplet was calculated based on Equation 2, where V i is the estimated droplet volume and d i is the estimated droplet diameter.
Cumulative volume was calculated by summing the volume of each droplet, and Dv0.1, Dv0.5 (VMD), and Dv0.9 were calculated using an interpolation method similar to that described by Zhu et al. (Reference Zhu, Salyani and Fox2011). Because DepositScan generates Dv0.1, VMD, and Dv0.9 based on a spread factor (d = 0.95 d s 0.910) originating from work on WSP, output from DepositScan was adjusted using the Kraft paper–specific spread factor described in Equation 3.
Spray Deposition Estimation
In addition to comparing computational models for droplet spectra, we assessed the total deposition of blue colorant from different computational models. First, the reference spray deposition was estimated based on the application speed of each sample, as the spray volume could be calculated from the known flow rate and spray width. An extraction-based method was also employed to quantify total colorant extracted from each piece of Kraft paper that could then be used to quantify spray deposition. This method utilized a standard curve correlating colorant dosage with spectrophotometric absorbance values, which were then converted into deposition volumes (µl colorant cm−2), accounting for the surface area of the sample. The colorant deposited per unit area estimated by SprayDAT or DepositScan was based on the total volume of all droplets based on measurements of each discrete stain object via digital imagery of sprayed Kraft paper adjusted for the ratio of colorant to water.
Results and Discussion
Spread Factor Calculation
The difference between droplet diameters in the PDMS solution and stain diameters on Kraft paper were subjected to a nonlinear two-parameter power regression (R2 = 0.9) where d s and d are stain and actual droplet diameters (in µm), respectively.
Compared with the spread factor (d = 0.95 d s 0.91) of the WSP described in Zhu et al. (Reference Zhu, Salyani and Fox2011), Equation 3 indicated that blue colorant proxy left more stains on white Kraft paper than water on the WSP.
Object Detection and Measurement by Two Computational Models
Table 1 describes the trend of object detection when two computational models (SprayDAT and DepositScan) assessed objects of known nominal sizes ranging from 100 to 2000 µm on reference cards (ORBITTRANSIT). Both SprayDAT and DepositScan exhibited a trend of increased accuracy in diameter detection as object size increased (Table 1), as has been reported for similar object size estimation (Brandoli et al. Reference Brandoli, Spadon, Esau, Hennessy, Carvalho, Amer-Yahia and Rodrigues-Jr2021; Zhu et al. Reference Zhu, Salyani and Fox2011). SprayDAT enlarged 100-µm droplets by 17%, but all other objects were measured accurately to within a 4% error rate. DepositScan, in contrast, enlarged 100-, 200-, and 300-µm objects 51%, 22%, and 10%, respectively, while accurately measuring objects that were 500 to 2,000 µm within a 5% error rate. When 120 Kraft paper samples were analyzed for spray deposition stains, total cover of all stain objects estimated by DepositScan and SprayDAT were linearly related with a 0.99 coefficient of determination (Figure 1). The slope of 0.99 that relates total stain cover between the computational models indicates that SprayDAT is estimating stain objects to be slightly smaller compared with DepositScan (Figure 1), in agreement with observations made when estimating known objects on reference cards, where DepositScan enlarged objects as much as 51% (Table 1). Across the 120 Kraft paper samples sprayed in the laboratory, application speeds ranged from 0.4 to 8.4 m s−1, resulting in 3.8% to 33.4% SprayDAT-assessed stain cover (Figure 2). The relationship between application speed and percentage stain cover followed an inverse first-order polynomial regression (R2 = 0.95) and deviated only slightly in trend from predicted application volume based on variable speeds given a constant flow rate of 4.2 ml s−1 (Figure 2).
Table 1. Comparison of diameters measured by SprayDAT and DepositScan for nominal spot diameters of 100, 200, 300, 400, 500, 1,000, and 2,000 µm on a size reference card. a
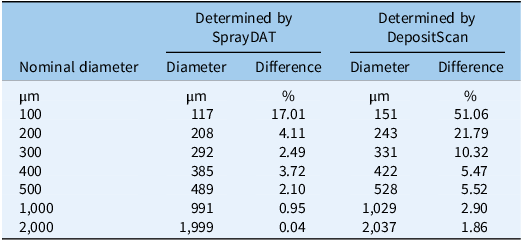
a The reference card (ORBITRANSIT, China) was scanned at 23.6 dots mm−1 with the Ricoh MP C307 color scanner (Ricoh, Tokyo, Japan).
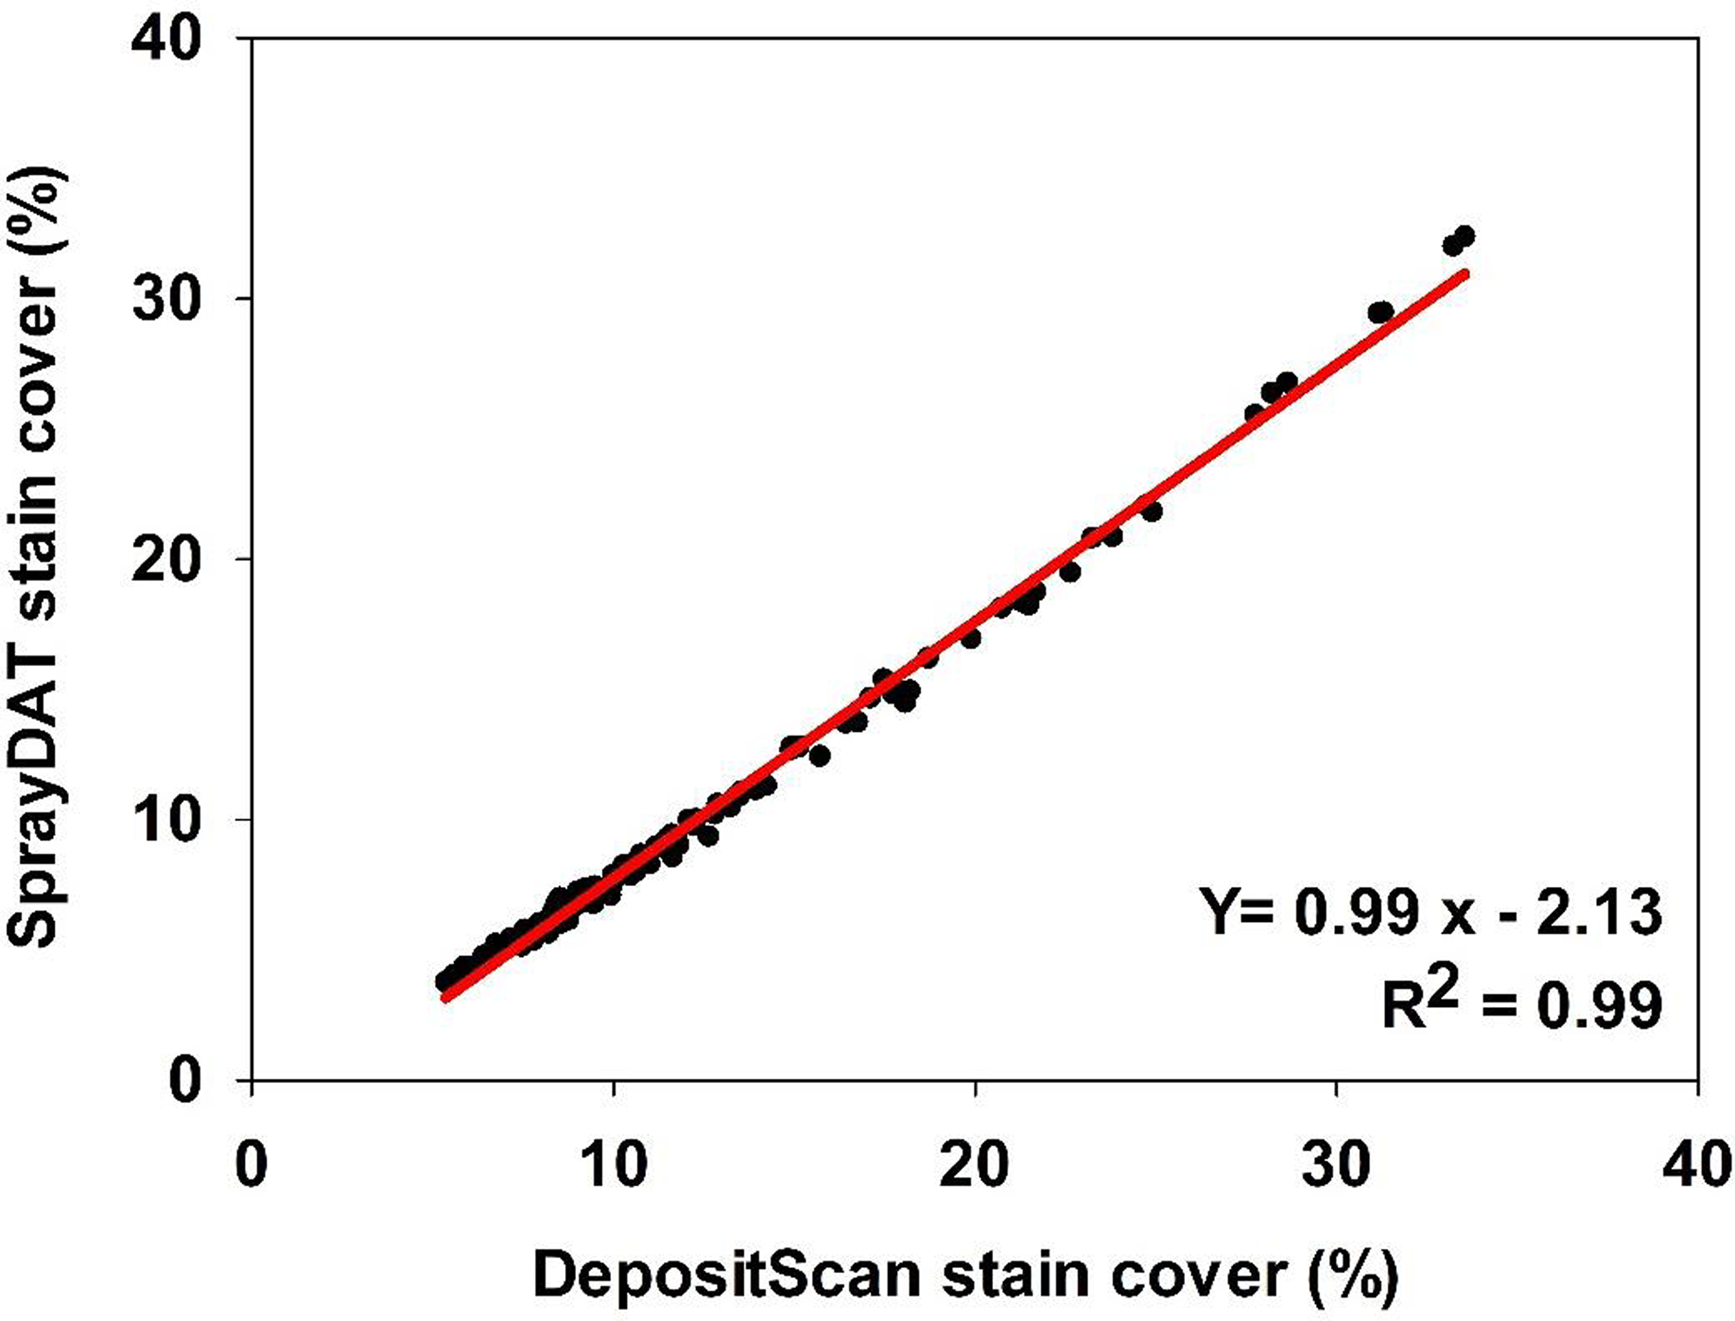
Figure 1. The relationship between percentage stain cover of 120 scanned Kraft paper samples assessed using SprayDAT and DepositScan.
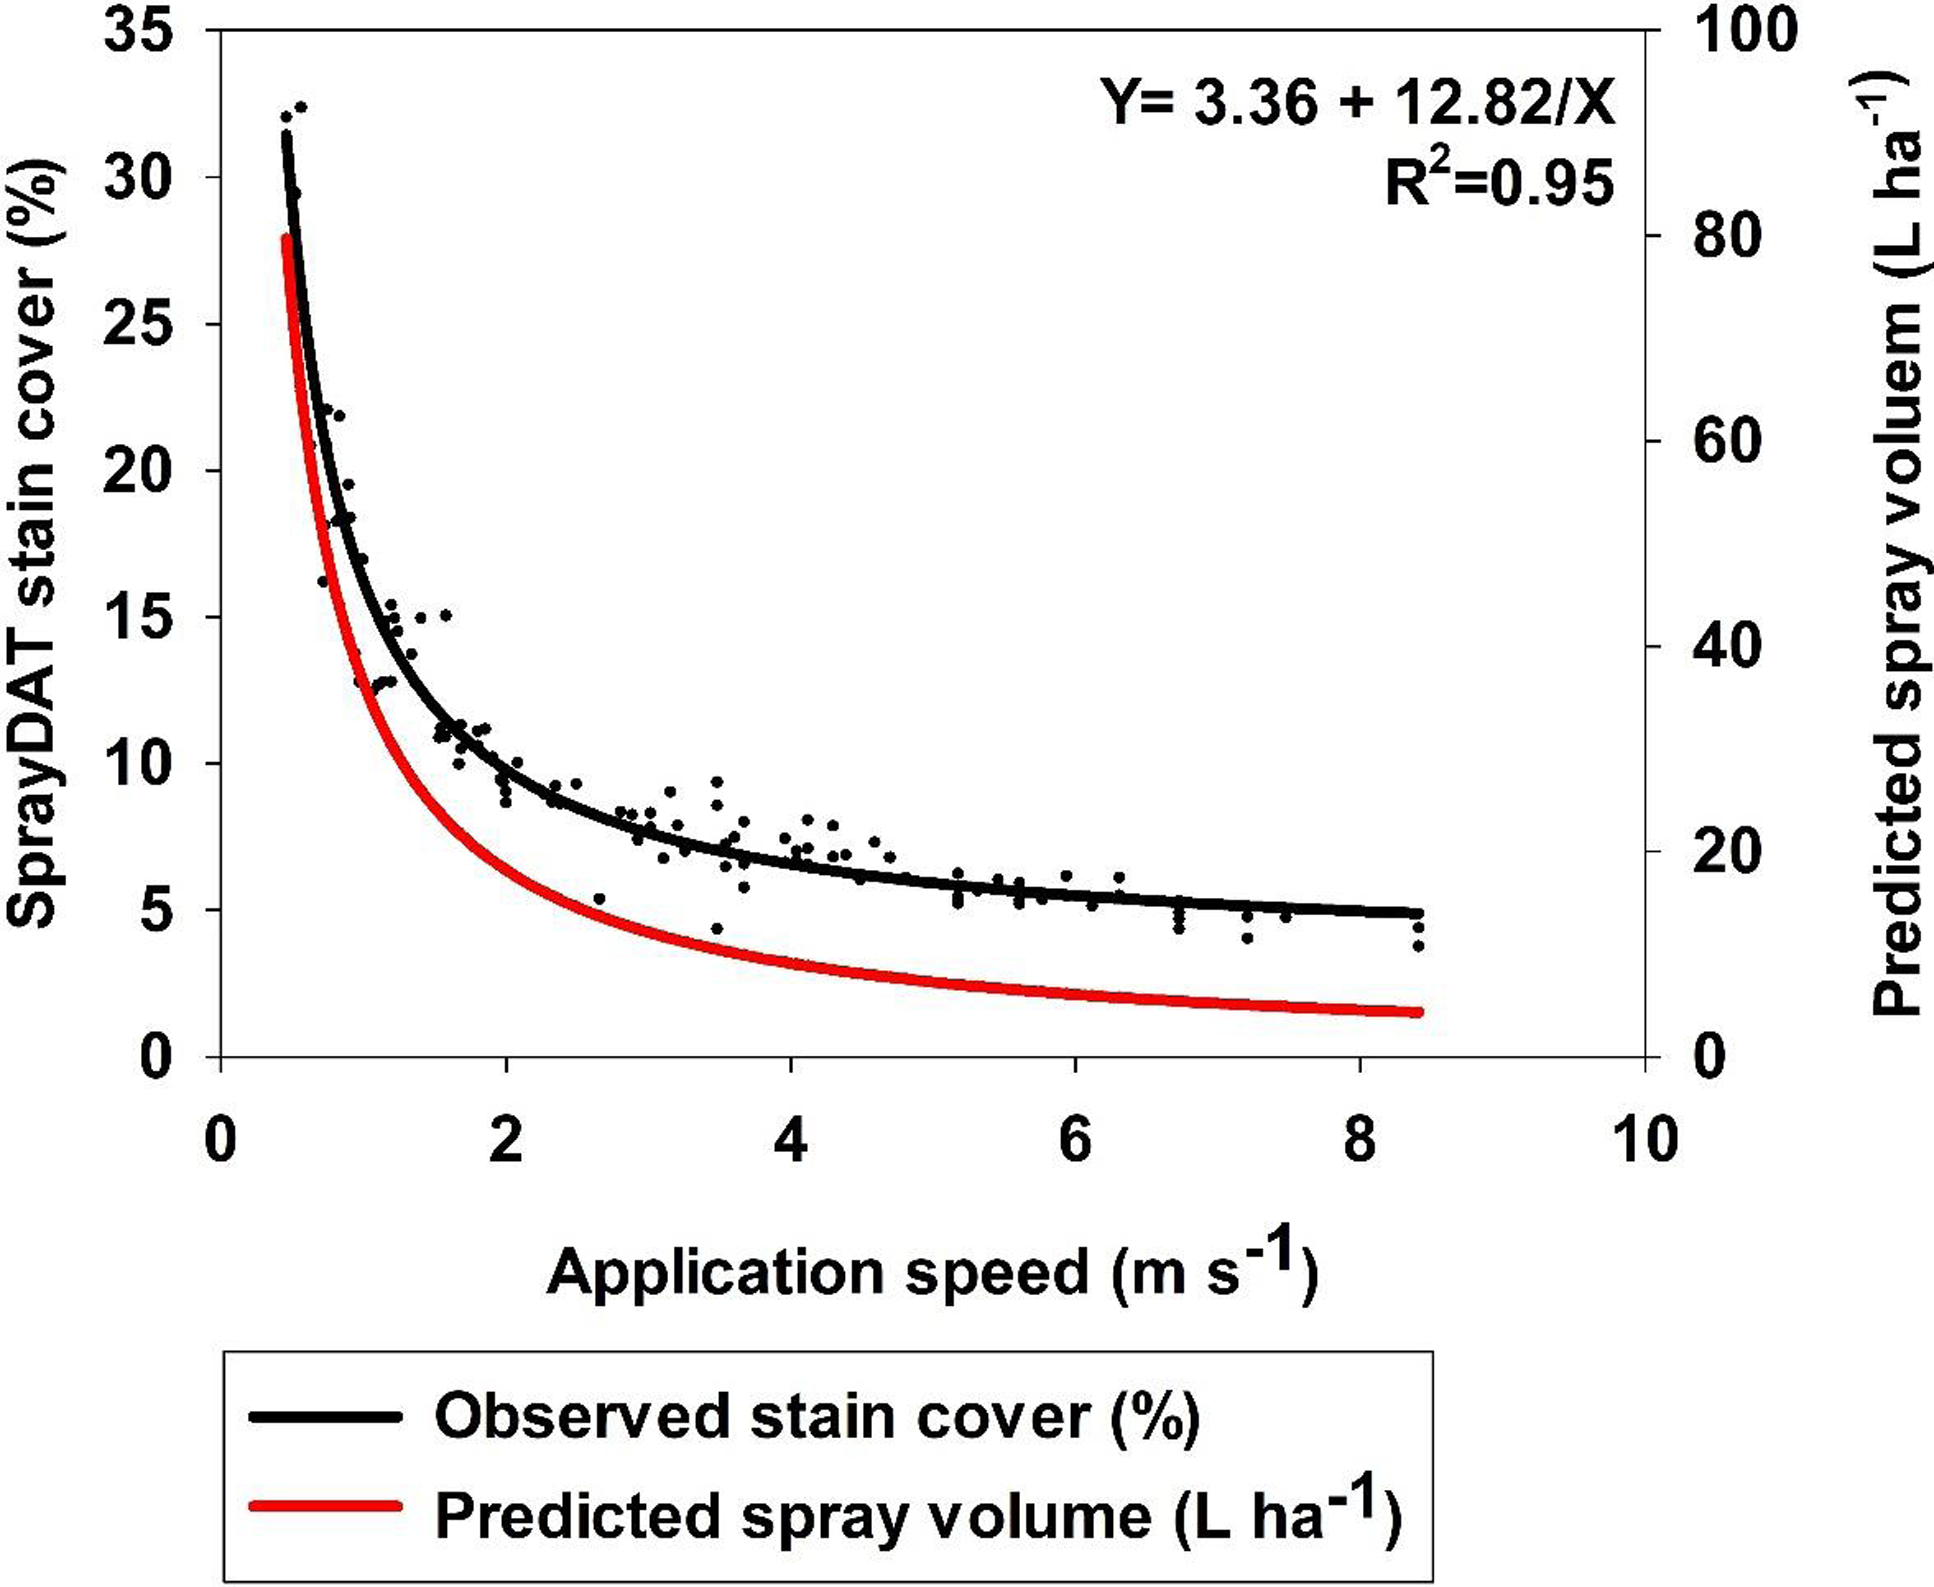
Figure 2. The relationship between the application speed and SprayDAT-assessed stain cover on 120 scanned Kraft paper samples. Predicted spray volume as calculated based on constant flow rate and variable speed is provided as a reference.
Droplet Density Relationships
The density of individual stain objects on Kraft paper is referred to as “droplet density” and is expressed as the estimated number of droplets landing in each square centimeter of Kraft paper. The relationship of droplet density as measured by SprayDAT and DepositScan was linear with a 0.93 coefficient of determination. The slope of 1.13 indicates that SprayDAT is estimating a higher number of droplets per unit area compared with DepositScan (Figure 3). The likely reason for increased droplet density assessed by SprayDAT is the higher accuracy of SprayDAT in detecting smaller droplets (Table 1). Detecting overlapping multiple droplets as a single large droplet has been a widely reported problem in image analysis techniques for paper-based samplers such as WSPs (Brandoli et al. Reference Brandoli, Spadon, Esau, Hennessy, Carvalho, Amer-Yahia and Rodrigues-Jr2021; JPAR Cunha et al. Reference Cunha, Farnese and Olivet2013; M Cunha et al. Reference Cunha, Carvalho and Marcal2012; Fox et al. Reference Fox, Derksen, Cooper, Krause and Ozkan2003; Özlüoymak and Bolat Reference Özlüoymak and Bolat2020; Zhu et al. Reference Zhu, Salyani and Fox2011), but none of these reports characterized the relationship between total stain cover and droplet density. In our study, the number of unique stain objects exhibited a Gaussian trend as total stain cover increased with peak droplet densities of 129 and 138 droplets cm−2 for DepositScan and SprayDAT, respectively (Figure 4). These peak droplet densities were reached at 22.7% and 22.2% stain cover, respectively, after which, droplet density declined (Figure 4). The decline in droplet density after 22% stain cover is evidence that additional droplet stains increasingly overlap as more droplets are added. These overlapping stains either merge into larger stain formations or are concealed by preexisting stains, resulting in a complex pattern of layered stains. This phenomenon was reported but not characterized by other researchers (Brandoli et al. Reference Brandoli, Spadon, Esau, Hennessy, Carvalho, Amer-Yahia and Rodrigues-Jr2021; Fox et al. Reference Fox, Derksen, Cooper, Krause and Ozkan2003; Zhu et al. Reference Zhu, Salyani and Fox2011). Fox et al. (Reference Fox, Derksen, Cooper, Krause and Ozkan2003) estimated arbitrarily that WSPs or Kromekote® cards with stain coverage exceeding 20% would be of limited value for estimating total volume of spray per unit area. This 20% estimate aligns well with our Gaussian relationship between total stain coverage and droplet density (Figure 4). While neither computational method can resolve overlapping stain objects, SprayDAT tended to more accurately detect small stains (Table 1) and slightly conserve droplet density (Figures 3 and 4) compared with DepositScan.
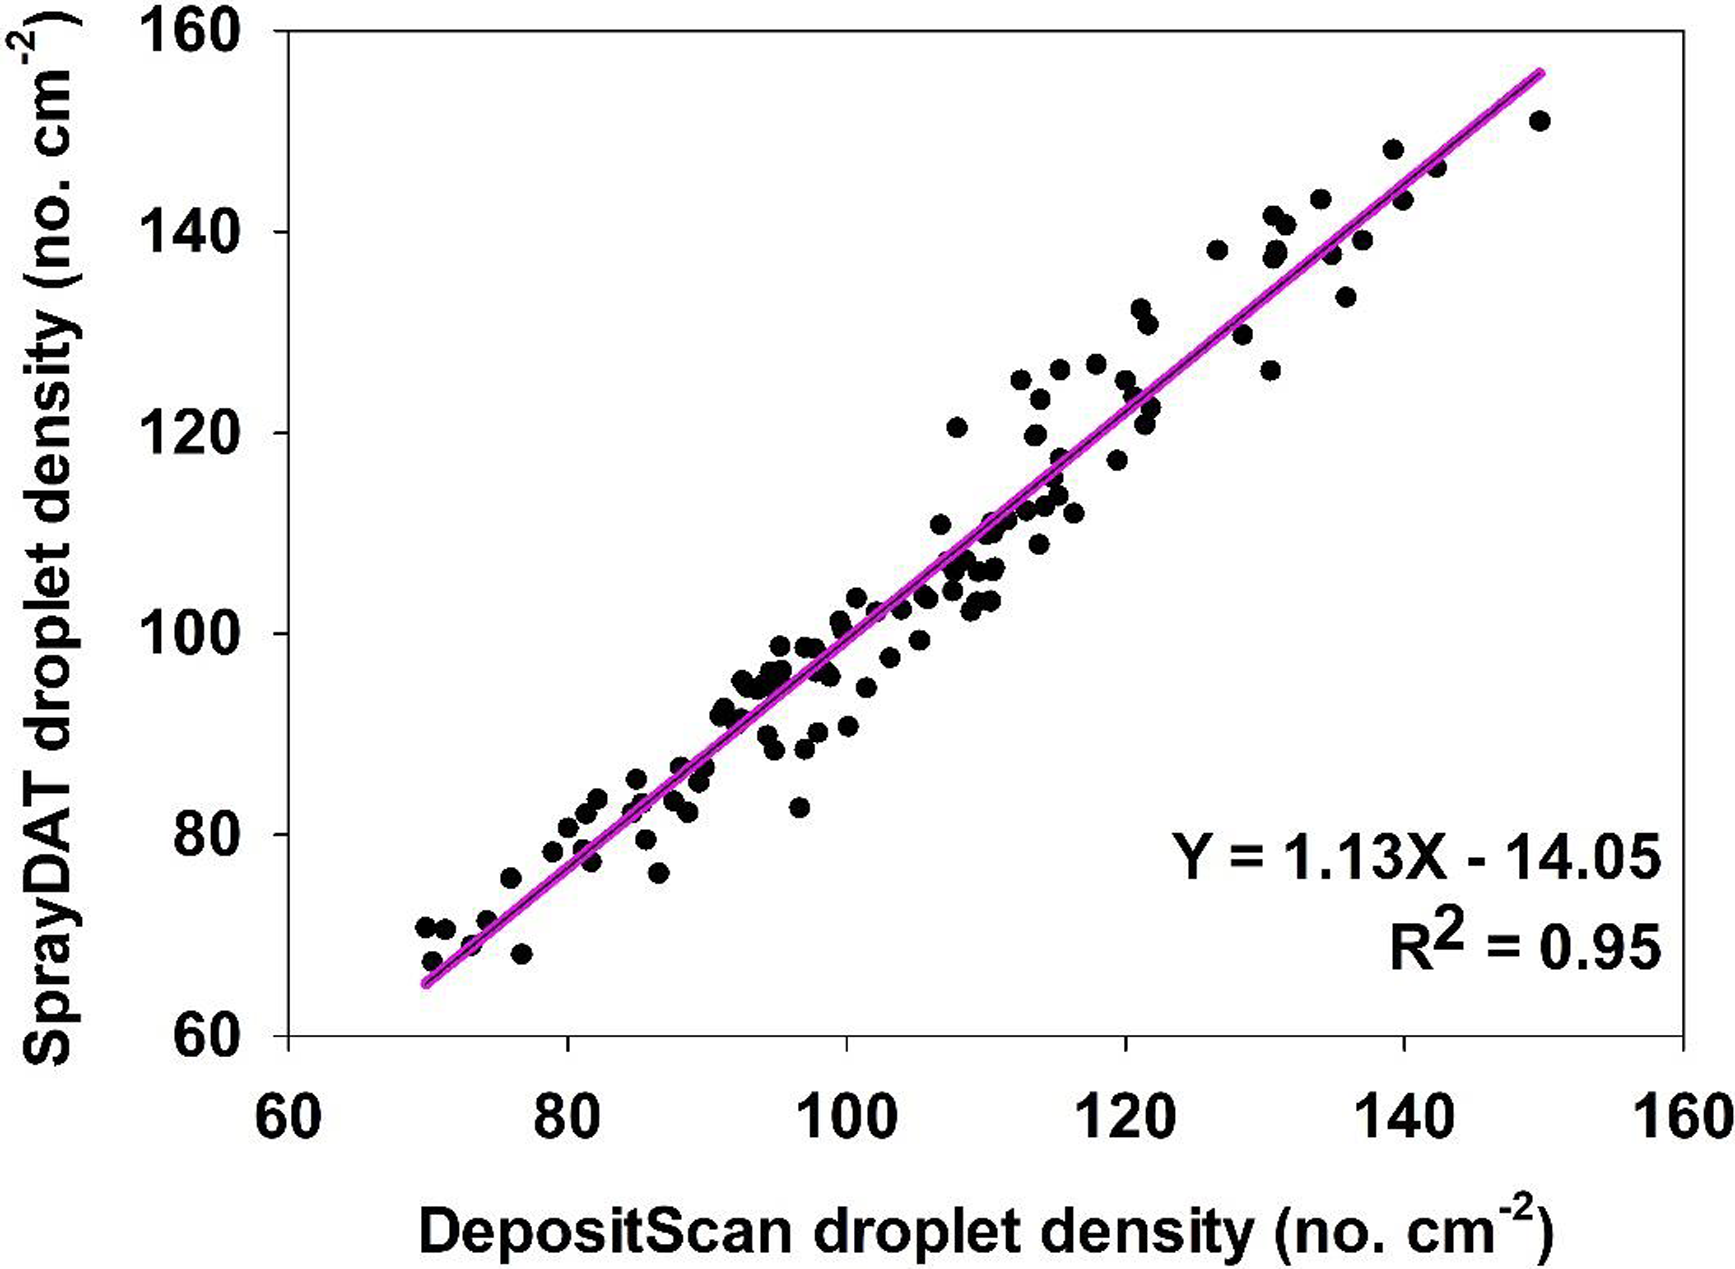
Figure 3. The relationship between droplet density (droplets cm−2) of 120 scanned Kraft paper samples assessed using SprayDAT and DepositScan.
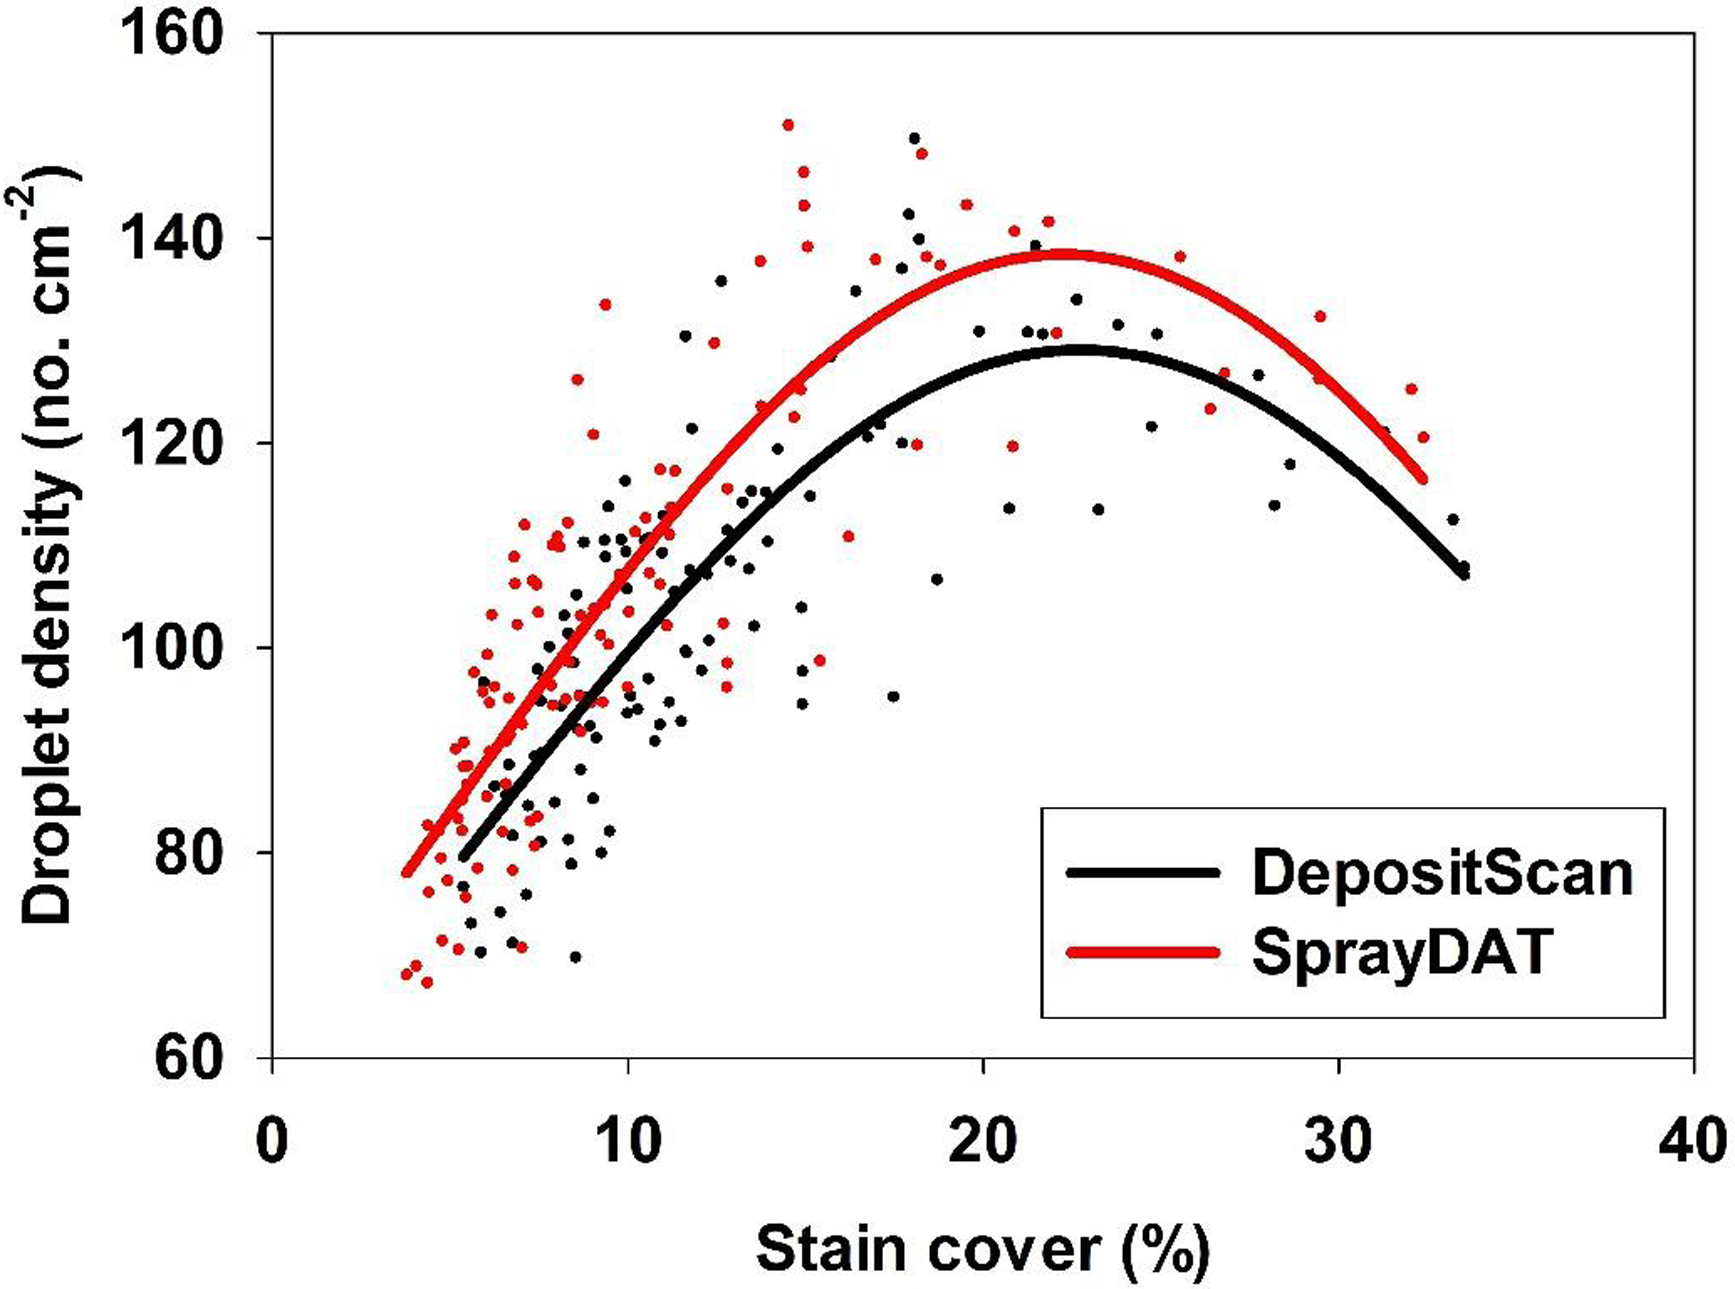
Figure 4. The relationship between percentage stain cover and droplet density (droplets cm−2) of 120 scanned Kraft paper samples assessed using SprayDAT and DepositScan.
Estimating Droplet Spectra Based on Stain Objects
The average VMD estimated by SprayDAT and spread factor–corrected (Equation 3) DepositScan across 120 Kraft papers sprayed at a constant flow rate with variable speed was 108 µm and 121 µm, respectively (Table 2). The manufacturer of the TeeJet® XR11001VS nozzle characterizes the spray output at the utilized operating pressure of 120 kPa (Anonymous 2023) as “Fine” based on the American Society of Agricultural and Biological Engineers (ASABE) Standard 572.3, suggesting the VMD ranges from 106 to 235 µm (Anonymous 2020; Grisso et al. Reference Grisso, Askew and McCall2019). Therefore, average VMD estimations from SprayDAT and DepositScan with adjusted spread factor were in the range of expected values, although DepositScan estimated a significantly larger VMD compared with SprayDAT. Excluding objects that were outside the bounds of 40 to 300 µm or 40 to 400 µm did not significantly impact VMD, DV0.1, or DV0.9 (Table 2).
Table 2. Volume median diameter (VMD; Dv0.5), Dv0.1, and Dv0.9 measured by ImageJ-based DepositScan and Python-based SprayDAT for stain objects detected on 120 Kraft paper samples following spray of a blue colorant solution. a
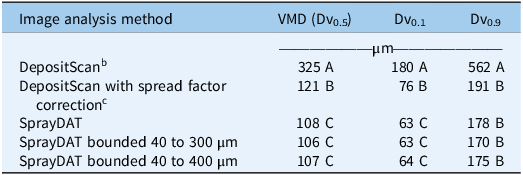
a Original DepositScan output was compared with output with an adjusted spread factor, and SprayDAT was executed with or without bounding to exclude objects smaller than 40 µm or larger than 300 to 400 µm that were deemed erroneous. All samples were scanned at 23.6 dots mm−1 with a Ricoh MP C307 color scanner (Ricoh, Tokyo, Japan). Means within a given column followed by the same letter are not different according to Fisher’s Protected LSD (α = 0.05).
b Original software uses a spread factor to relate stain size to estimated droplet size based on work with water-sensitive paper.
c Spread factor (Equation 2) was adjusted to reflect relationship between blue stains on Kraft paper and actual size of droplets suspended in oil solution.
Table 3. Nonlinear regression equations with parameters utilized for this study.

Description of equations used
Gaussian y = y 0 + ae −0.5 (x−x 0)/b2, where y is the droplet density (droplet cm−2), a is the peak height, b is the width of the peak, x is the percentage stain cover assessed by image analysis software, x 0 is the center or mean of the peak, and y0 is the offset.
Exponential growth y = ae (bx), where y is volume median diameter (VMD, µm), a is the lower asymptote, b is the growth rate parameter, and x is the percentage stain cover assessed by image analysis software.
Power y = ax b , where y is total blue colorant deposition (µl cm−2), a is the scaling factor, b is the growth rate parameter, and x is the percentage stain cover assessed by image analysis software.
The data in Table 2 appear to contrast with reports of overlapping and enlarged stain objects as total stain coverage increases (Brandoli et al. Reference Brandoli, Spadon, Esau, Hennessy, Carvalho, Amer-Yahia and Rodrigues-Jr2021; Fox et al. Reference Fox, Derksen, Cooper, Krause and Ozkan2003; Zhu et al. Reference Zhu, Salyani and Fox2011), as bounding did not alter VMD estimation by SprayDAT (Table 2). It should be noted, however, that more than 60% of our 120 Kraft paper samples had total stain coverage of less than 10%, and only 11 of the 120 samples exceeded total stain coverage of 20% (Figure 2). Thus, our average spectral analysis across all 120 samples was less subject to the errors associated with excessive total stain coverage. When we evaluate VMD as a function of total stain cover, the data fit an exponential growth curve (Table 3, Figure 5) in all cases for DepositScan, DepositScan with adjusted spread factor, and SprayDAT. Because all factors were held constant, with the exception of speed, the VMD in this laboratory experiment should be constant. The increase in VMD associated with increased stain cover in the computational models is evidence of overlapping or merged deposition stains that occur in increasing frequency as total stain cover increases. The data in Figure 3 also highlight the importance of spread factor accuracy. The original output from DepositScan is largely deviant compared with SprayDAT or spread factor–adjusted DepositScan. Because spread factors have been reported to deviate with varying WSP products (Deveau Reference Deveau2021a), we see this as a significant limitation of DepositScan. The method required to adjust DepositScan output as spread factor changes (Zhu et al. Reference Zhu, Salyani and Fox2011) requires numerous manual calculations with limited ability for automation. In SprayDAT, images are batch processed, and users would simply replace one equation at a specified place in the code if a different spread factor were desired.
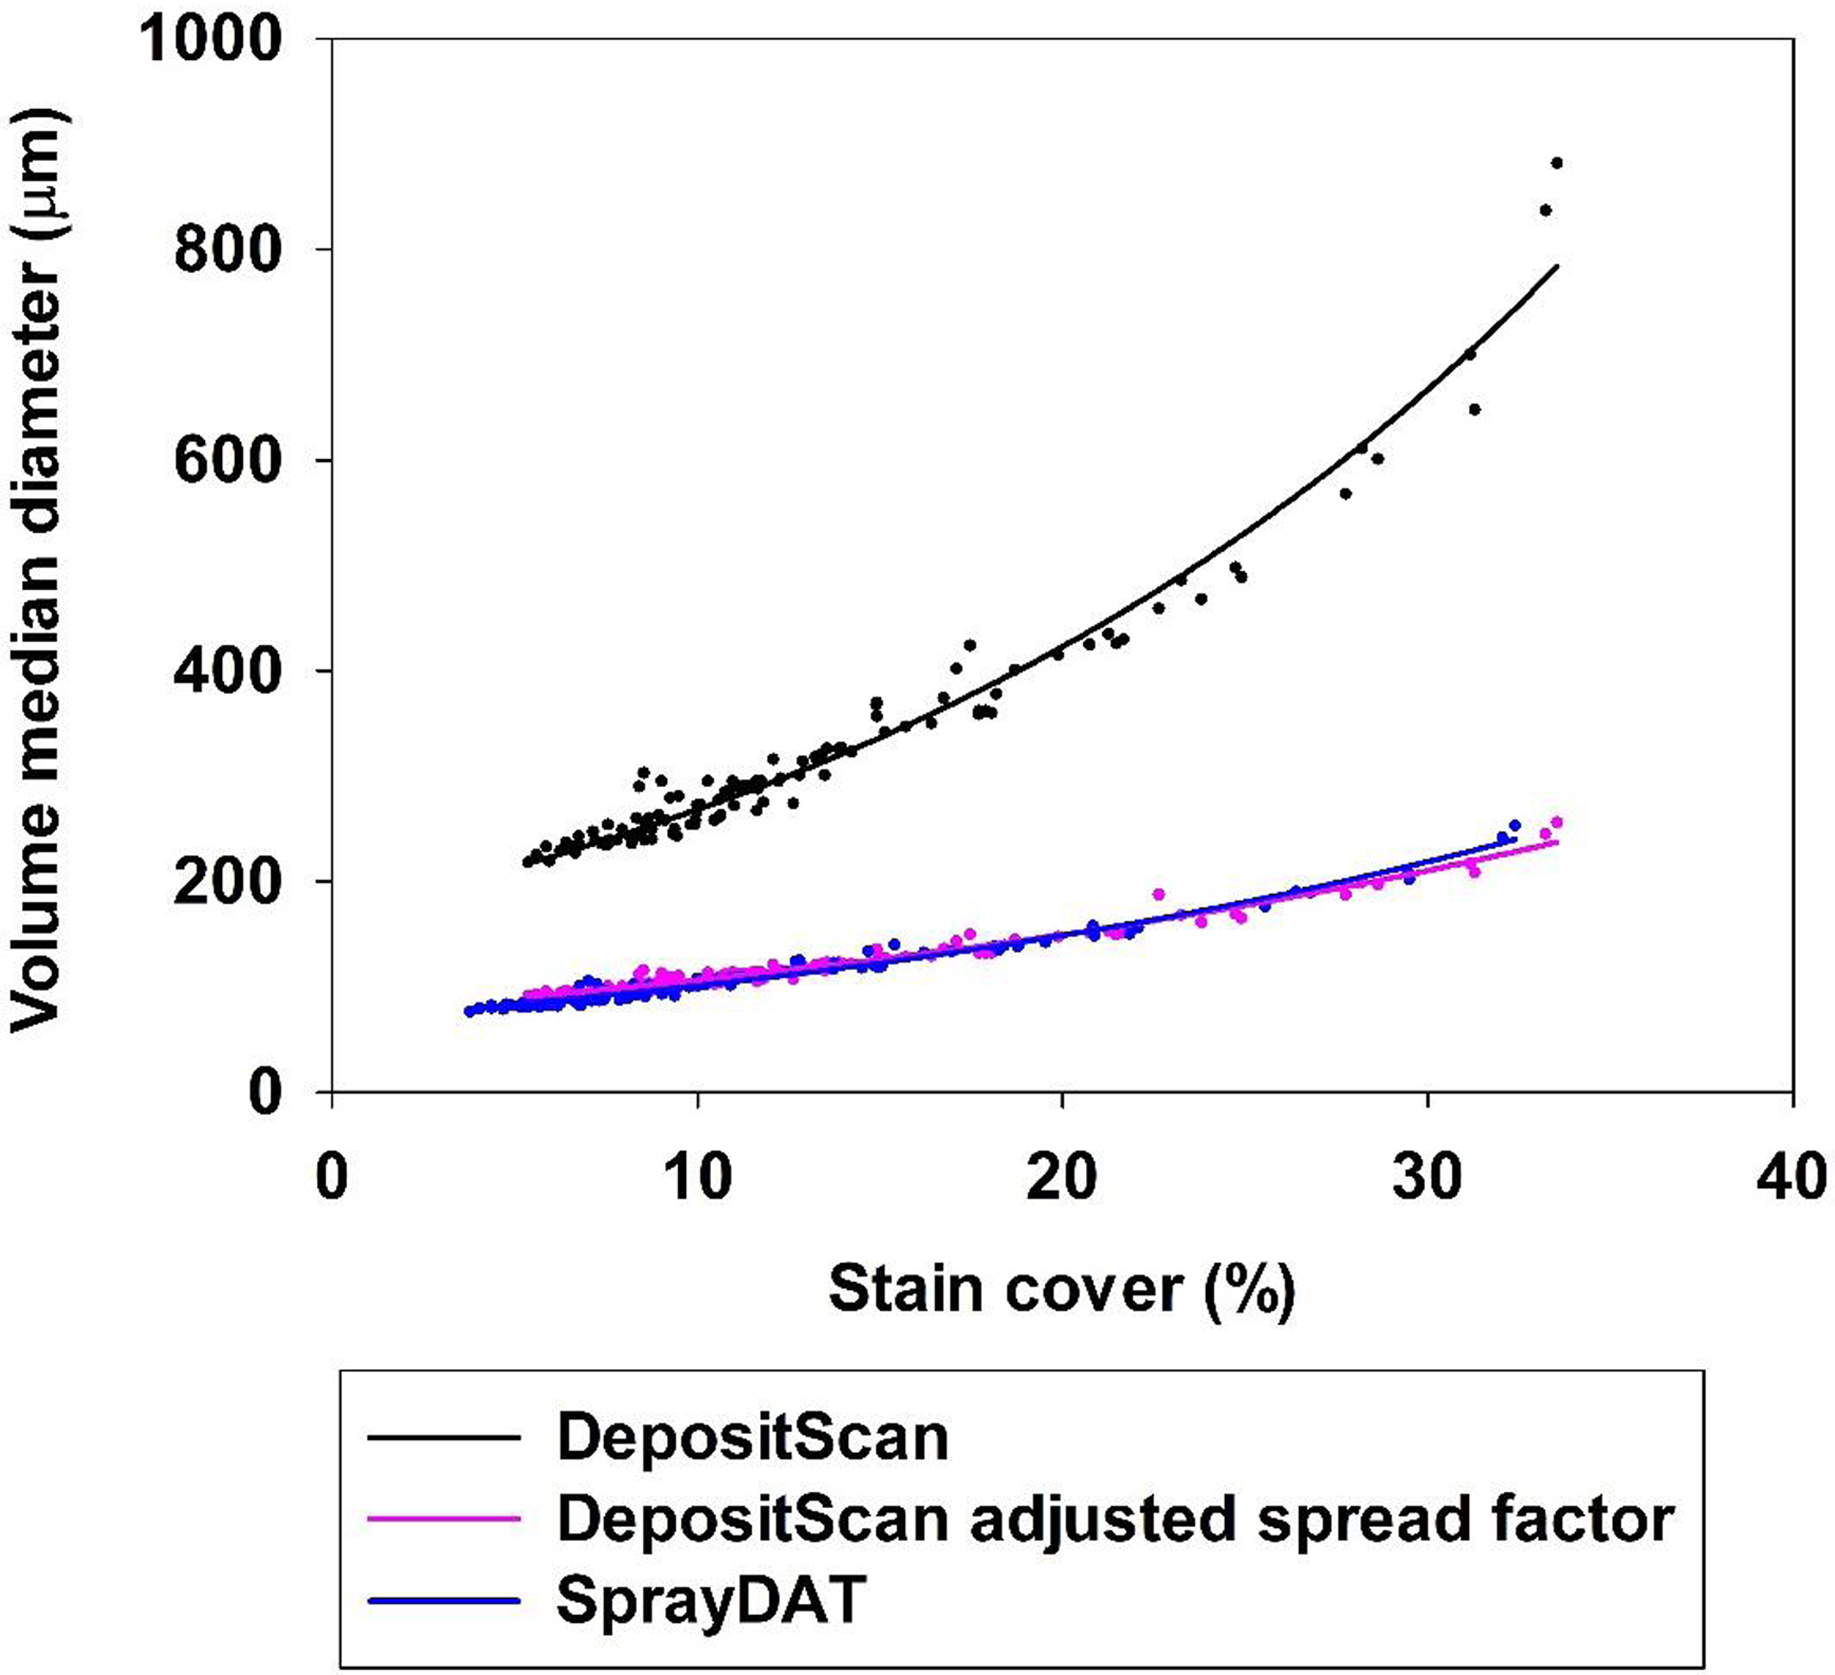
Figure 5. The relationship between the percentage stain cover and volume median diameter (µm) of 120 scanned Kraft paper samples assessed by DepositScan, DepositScan with adjusted spread factor, and SprayDAT.
Accuracy of Predicting Deposition Volume via Spray Deposit Stains
Despite numerous papers evaluating WSP or other methods to digitally assess spray deposit stains (Brandoli et al. Reference Brandoli, Spadon, Esau, Hennessy, Carvalho, Amer-Yahia and Rodrigues-Jr2021; Cunha et al. Reference Cunha, Carvalho and Marcal2012, Reference Cunha, Farnese and Olivet2013; Ferguson et al. Reference Ferguson, Chechetto, O’Donnell, Fritz, Hoffmann, Coleman, Chauhan, Adkins, Kruger and Hewitt2016; Özlüoymak and Bolat Reference Özlüoymak and Bolat2020; Zhu et al. Reference Zhu, Salyani and Fox2011) and spray volume per unit area estimates based on deposit stains computed by available software (Brandoli et al. Reference Brandoli, Spadon, Esau, Hennessy, Carvalho, Amer-Yahia and Rodrigues-Jr2021; Zhu et al. Reference Zhu, Salyani and Fox2011), the accuracy of spray volume estimates based on stain object-to-droplet volume relationships remains unreported. A nonlinear two-parameter power model described the relationship between total stain cover on Kraft paper and estimated spray volume deposited based on speed and flow rate of the sprayer, extracted colorant quantified by standardized spectrophotometric absorbance, and deposit stains measured by DepositScan or SprayDAT (Figure 6). The extraction method underestimated spray deposition approximately 9% compared with speed-based calculations, which are considered the reference (Figure 6). The underestimation might be attributed to losses during the extraction process, but preliminary experiments indicate our extraction method accounts for more than 99% of colorant (data not shown).
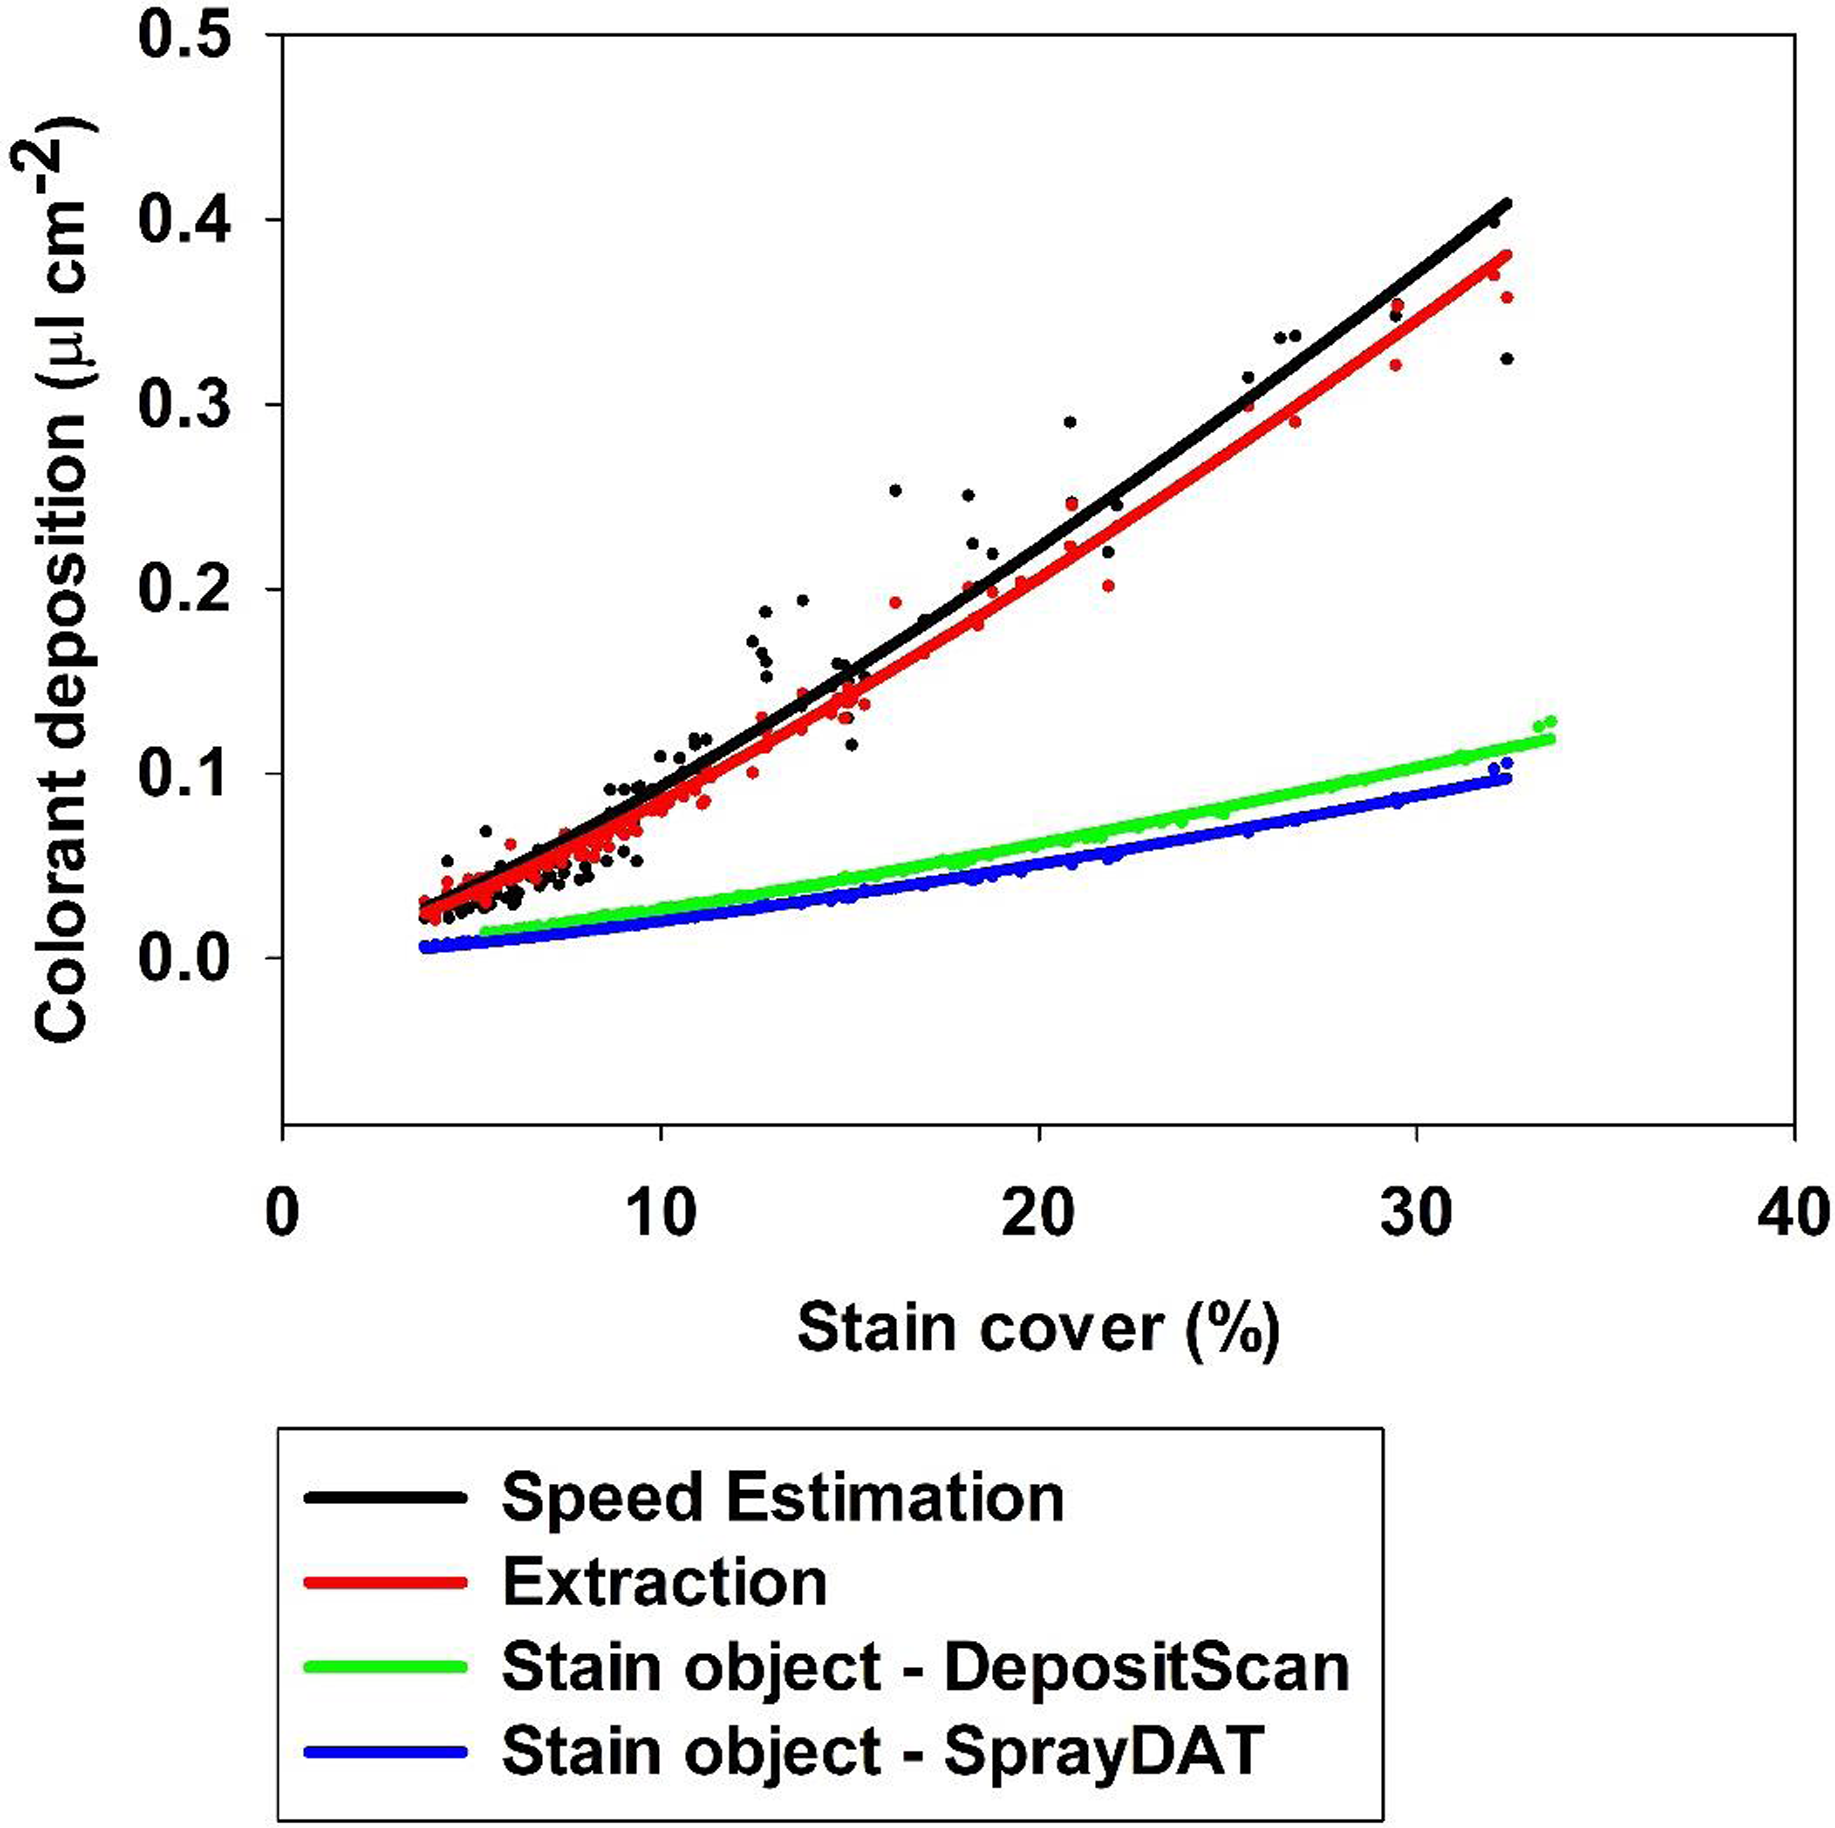
Figure 6. The relationship between percentage stain cover and estimated total colorant deposited (μl cm−2) predicted by speed calculation, colorant extraction, and stain object–based volume calculated using SprayDAT and DepositScan.
Both computational models that relied on deposit stains were divergent with the actual predicted spray volume of calibrated equipment and estimates of spray volume based on extracted colorant. The divergence between these methods increased with increasing total stain cover, such that DepositScan and SprayDAT estimated 2.7 and 3.2 times less spray volume than speed-based predictions when total stain coverage was 30% (Figure 6). The complementary trends among all four methods is testament that estimates based on stain objects can appropriately reflect relative differences in spray deposition, but these data are the first to characterize how inaccurately deposit stain–based methods estimate spray volume compared with colorant extraction or predicted spray output based on equipment calibration. This inaccuracy likely stems from declining droplet density as total stain coverage increases (Figure 4), a problem inherent to estimates based on deposit stains. When the x axis of Figure 4 was truncated to 10% total stain cover, a linear trend (R2 = 0.97) with slope 13.2 was predicted (data not shown). If this early linear trend is extrapolated to 30% total stain cover, droplet density would be estimated at 397 drops cm−2, or three times greater than that detected by digital image analysis and similar to the disparity between extracted colorant and model-predicted colorant deposition (Figure 6). Future efforts will use artificial intelligence to better estimate how congregated stain objects may be separated for more accurate deposition assessments.
Acknowledgments
The authors would like to acknowledge Clebson G. Gonçalves of UC Agricultural and Natural Resources for technical assistance for this project.
Funding statement
This research received no specific grant from any funding agency or the commercial or not-for-profit sectors.
Competing interests
The authors declare no conflicts of interest.


