Introduction
Lack of trust in the research process continues to affect the public’s confidence in research and their willingness to participate in medical studies [Reference George, Duran and Norris1–Reference Ulrich5]. Particularly, minority groups and individuals with low educational attainment continue to exhibit the lowest levels of trust in the research process. This contributes to low participation rates in clinical trials and exacerbates health and healthcare disparities [Reference Adams-Campbell6,Reference Baird7]. According to the past studies, several factors influence an individual’s level of trust in research including socioeconomic status, cultural beliefs, and personal or interpersonal experiences with research and health care providers [Reference Mullins2,Reference Boulware8–Reference Lichtenberg10]. However, measuring this concept in biomedical research is likely different from measuring trust in healthcare and other areas, especially among those underrepresented in research [Reference Baik11,Reference Mainous12].
Trust is a complex construct, and many scales have been developed that purport to measure trust. Scales vary in content, dimensionality, and targets of applications (e.g., healthcare, providers, and biomedical research), and validation procedures often lack inclusion of diverse populations [Reference Mainous12–Reference Hall14]. The measures include content areas commonly associated with Whites – e.g., competency, fidelity, confidentiality, honesty, and global/system trust. Hence, a major disadvantage of these measures – especially those used in healthcare settings – is the neglect of domains that might be particularly important to people less likely to voluntarily participate in medical research – e.g., safety, fairness, communication, and honesty. This creates a critical gap in our understanding of trust across populations [Reference Baik11].
At the time of our study, two scales had been published as measures of trust in biomedical research (TBR) [Reference Mainous12,Reference Hall14]. While limited in content areas, they appear to measure similar content in comparable populations. The trust content areas of the H-TBR are safety, honesty, fidelity, and system trust [Reference Hall14], while the content areas of the M-TBR are honesty, communication, and fairness [Reference Mainous12]. The content areas of the M-TBR also address trust in minorities specifically. It is unknown whether the outcome of each scale is affected by variables involving individual characteristics and the context in which the scales are administered.
The objective of this study was to explore the extent to which the Hall et al. (2006) (H-TBR) and Mainous et al. (2006) (M-TBR) trust scales are similar or different in terms of their associations with sociodemographic variables and variables assessing attitudes toward research. We further determined if racial differences existed between both trust scales, other research variables, and sociodemographic variables. Findings from this study can identify (1) factors that threaten trust in biomedical research and if these factors differ by race, (2) if the current measures are rigorous in measuring trust and encompass all trust domains across race, and (3) interventional targets possibly developed using a tailored approach aimed to improve and sustain the public’s trust in research and if these targets should be tailored.
Materials and Methods
Sample and Recruitment
A cross-sectional study was conducted to compare the psychometric properties of the two published TBR scales and assess how each relates to socio-demographic variables and attitudes toward research. Participants (N = 3977) were a diverse, convenient sample of adults over the age of 18 recruited from the Mid-South region (Tennessee, Kentucky, Alabama, and the southwestern region of Virginia). Priority populations for this study, which were identified by the research team, were racial/ethnic minorities, individuals with multiple chronic conditions, low-income groups, rural and urban residents, and older adults. There were no other eligibility criteria.
Due to the diversity in the target audience, multiple strategies were required for recruitment. Recruitment was in-person at community health centers, neighborhood resource centers, minority-owned businesses (e.g., barbershops), and community health forums (e.g., health fairs). Online strategies were the Vanderbilt patient portal and ResearchMatch (RM). RM is an online, national registry for the recruitment of volunteers for clinical research [Reference Harris15]. All of these sites were chosen as we sought a broad audience to elicit perspectives on trust. This study was approved by Vanderbilt University’s Institutional Review Board, and all participants provided written consent prior to taking the survey.
Measures
In order to compare these two TBR scales, two parallel surveys were developed. The Hall et al. (2006) scale (H-TBR) was included on one survey (Hall-survey), while the Mainous et al. (2006) scale (M-TBR) was included on the other (Mainous-Survey). All other measures in both surveys were identical. A brief description of each study measure is provided below.
Demographics and background information. Participants reported their race/ethnicity, gender, year of birth, educational attainment, and household income. For race/ethnicity, respondents were able to check all applicable categories with nine options including “other” and “prefer not to answer.”
Trust in biomedical research. Each survey included one of the two, 12-item TBR scales. (See Table 1 for the items on each of the scales.) The H-TBR is typically treated as unidimensional yielding a single overall score. The M-TBR consists of two, 6-item subscales, “Researcher Honesty” and “Participant Deception,” which are sometimes scored separately and other time combined into a single score. For this study’s purpose, the two subscales of the M-TBR were combined into a single overall score to make it comparable to the H-TBR. Both instruments use a five-point Likert response scale ranging from “Strongly Disagree” to “Strongly Agree.” Both scales had negatively worded items (4 on H-TBR; 8 on M-TBR) that were reverse coded for scoring purposes. A high score on either scale signifies high levels of trust in biomedical research. Mean item scores were computed by dividing the total summed score by 12.
Table 1. Mean item scores, total scores, and internal consistency measures for both trust in biomedical research (TBR) scales

Attitudes toward research. Both surveys included two questionnaires assessing attitudes toward research. The perceived barriers to research participation were assessed using a modified version of the barriers to research participation scale [Reference Mouton16]. Two survey items – “Prefer study headed by Black scientist” and “Prefer study headed by Latino scientist” – were excluded because the past research participants expressed discomfort in responding to those questions. A total of 11 of the remaining 12 items were answered using a five-point Likert response scale. Certain items were reversed scored so that higher scores represented less perceived barriers. The final item (“In my opinion, research in the United States is …”) had three possible response options: “ethical,” “not ethical,” and “I don’t know.” To preserve how this item fit with the other 11 items, this item was recoded to be proportional to its weight in the original scale. Therefore, the response “ethical” was recoded as 2.54, “not ethical” was recoded as 0.83, and “I don’t know” was recoded as 1.69. Scores on the barrier measure ranged from 11.83 to 57.54, with higher scores signifying fewer barriers.
Interest in research participation was measured with a survey instrument derived from the “Willingness to Take Part in Research” survey, which was developed by health behavior and health services research experts in the National Patient-Centered Clinical Research Network [Reference Fleurence17]. The seven-item scale asked about interest in research participation using different research scenarios, such as “Giving a blood sample” or “Taking part in a study that requires medication.” The response options were “Not interested” (1), “Somewhat interested” (2), or “Very interested” (3). A mean score across the seven scenarios, ranging from 7 to 21, was computed. Higher scores signified greater interest in participating in research.
Data Collection
In order to achieve the equal distribution of the sample per survey, the Hall-survey and the Mainous-survey were alternatively distributed every two weeks. Both surveys were administered face-to-face or online during an 18-month period between March 2014 and September 2015. Within the community settings, liaisons were identified to seek approval for the survey distribution. After receiving approval, a member of the research team provided the survey via IPAD or paper. Participants took approximately 20–30 minutes to complete the survey. Compensation was a $10 Kroger gift card.
Statistical Methods
Following suggestions by Revelle and Zinbarg [Reference Revelle and Zinbarg18], internal consistency reliability was assessed for each TBR scale using Cronbach’s α and McDonald’s ω. In order to assess the direct associations between the H-TBR and M-TBR scores and sociodemographic and research-related variables, Pearson correlation coefficients were computed. Fisher’s r to z transformations were computed to compare the correlation coefficients between both TBR scales [Reference Fisher19]. T-tests and Chi-Square tests were performed to assess racial differences between both TBR scales, other research variables, and sociodemographic variables. SPSS [20] and R 3.3.2 [21] with the psych package [Reference Revelle22] were used for these analyses.
Results
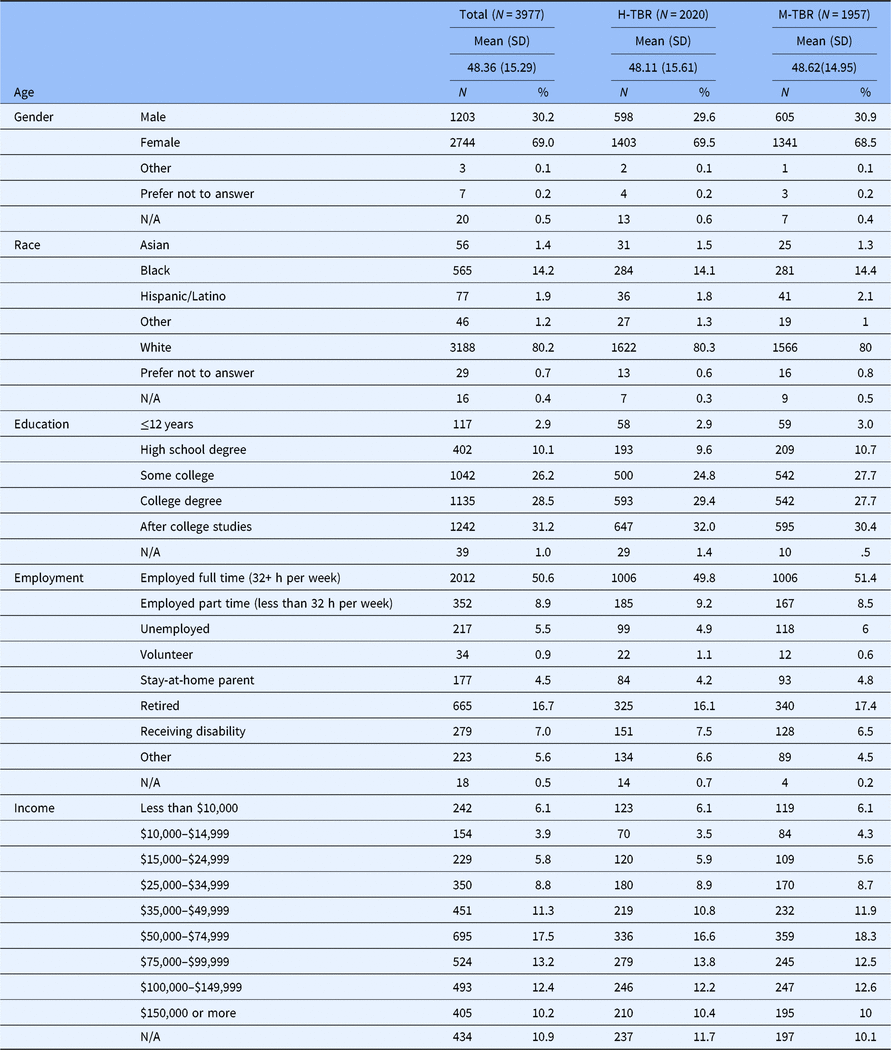
The total sample consisted of 3977 adults. On average, respondents were in their late 40s. The majority of respondents (~80%) self-identified as White and ~14% identified as Black. Over two-thirds of the respondents were female. Approximately 60% reported having a college degree or higher, and more than half were employed full- or part-time. Table 2 provides separate and combined descriptive characteristics for the two survey subsamples. As would be expected with subsamples of this size, there were no differences on any background variable between the two subsamples.
Table 2. Demographic characteristics for the two trust in biomedical research (TBR) scales

Reliability of the H-TBR and M-TBR Scales
Each scale was tested for internal consistency reliability. Both scales were internally consistent, with both Cronbach’s α and McDonald’s ω higher than 0.8 (see the bottom of Table 1). On average, respondents completing the survey containing the M-TBR scale had higher mean scores (M = 3.81) than those who completed the survey with the H-TBR scale (M = 3.33, t (3975) = 24.97, p < 0.001), despite both scales having an equal score range.
Associations among TBR scale scores, socio-demographic variables, and attitudes toward research
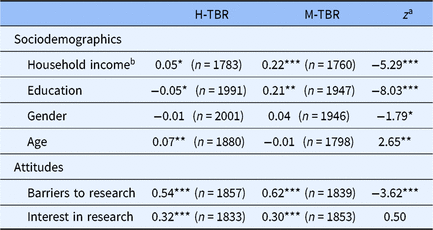
Sociodemographic variables. Mean scores for the entire sample as well as Pearson correlation coefficients between the two TBR scales and sociodemographic are shown in Table 3. Household income is positively correlated with both TBR scales, but the correlation of income with M-TBR is higher than that of income with H-TBR (z = −5.29, p < 0.001). Education is also significantly correlated with both scales, although in opposite directions. The positive association of education with the M-TBR is significantly higher than education’s small, negative correlation with the H-TBR (z = −8.03, p < 0.001). Gender was uncorrelated with either TBR scale. Finally, age is significantly, positively associated with the H-TBR scores but not with the M-TBR scores.
Table 3. Descriptive statistics and Pearson correlation coefficients for the two trust in biomedical research (TBR) scales with sociodemographics and attitude toward research for the entire sample

*p < 0.05, **p < 0.01, ***p < 0.001.
a The Fisher z statistic was used to test the significance of the difference in correlations between the two independent subsamples.
b Participants were not required to answer this question. Household income was an ordinal variable from 1 to 9, ranging from “Less than $10,000” to “$150,000 or more” (see Table 2 for distribution).
Attitudes toward research variables. As also shown in Table 3, both TBR scales were strongly correlated with scores on the barriers to research participation measure; however, the correlation of the barrier measure with M-TBR is significantly higher than its relationship with H-TBR (z = −3.62, p < 0.001). In addition, both trust scales are equivalently, positively correlated with interest in research participation.
Racial Differences in Sociodemographic and Attitude Variables and TBR Scores
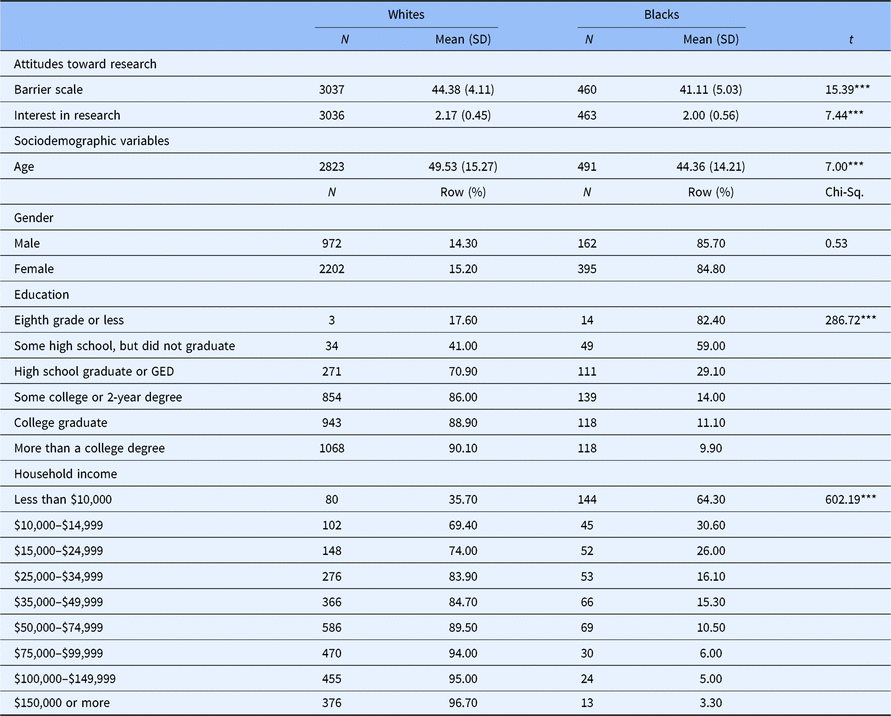
Given the number of respondents in each racial category, we only assessed TBR differences between Black (n = 565) and White (n = 3188) respondents. With the exception of gender, there were significant differences between Black and White respondents on each of the background and attitude variables (see Table 4). On average, the White respondents reported they were older, more highly educated, and had a higher household income than the Black respondents. Furthermore, Whites reported fewer barriers to research participation and greater interest in participating in medical research than Blacks. Finally, Whites scored higher than Blacks on both TBR scales, although the race difference was larger for the M-TBR scale than for the H-TBR scale (see Table 5).
Table 4. Differences between White and Black respondents in attitudes toward research and sociodemographic variables

*** p < .001.
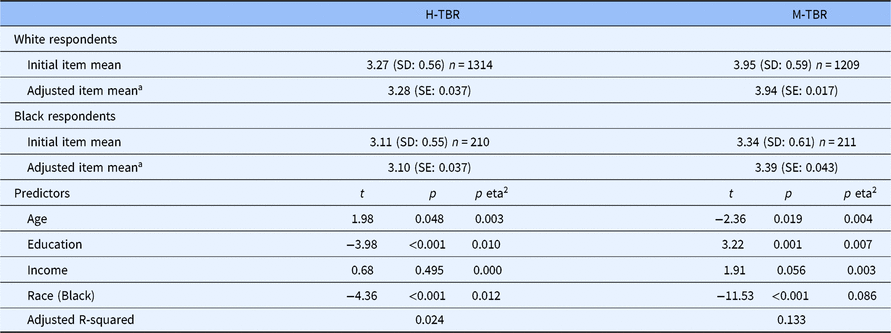
In one final analysis, we assessed whether the White–Black difference in TBR scores would remain once we controlled for age, education, and income. Separate ANCOVAs were run with H-TBR as the dependent variable for one ANCOVA, and M-TBR for the other. Race (White and Black) was the independent variable for both analyses, and age, education, and household income were the covariates. The results of these analyses are also found in Table 5. In neither case, did controlling for those three covariates change the fact that Whites reported more trust in biomedical research than Blacks.
Table 5. Descriptive statistics for H-TBR and M-TBR scales and results of ANCOVAs controlling for covariates

a Initial item mean adjusted for the covariates: age, education, and income.
Discussion
Our paper is the first to assess differential associations between the scores of the two most highly cited scales assessing trust in biomedical research and sociodemographic variables and attitudes toward research using a large, diverse cohort. Findings confirmed that both TBR scales are internally consistent, and both TBR scales demonstrated congruent validity as they had highly significant relationships with the barriers to research participation measure. This finding is similar to the past research that has found mistrust in research and barriers to participation to be highly associated [Reference Boulware8–Reference Lichtenberg10]. Both TBR scales were also moderately, positively associated with interest in research participation. Associations between sociodemographic variables and the trust scales were higher for the M-TBR scale except for age. The models reported in Table 5 also show a higher percentage of variance explained by sociodemographic variables for the M-TBR scale than for the H-TBR scale.
There were some differential associations with the TBR scales. Indicators of socioeconomic status such as education and income are often positively associated with issues related to trust [Reference Skinner23]. Both scales were positively correlated with household income, although the correlation for the H-TBR was very weak. Surprisingly, H-TBR scores were negatively correlated with education, while M-TBR scores were positively correlated with education. This anomaly is difficult to explain although it might suggest that the H-TBR is less influenced by socioeconomic status than M-TBR. Age has been associated with enrollment in clinical trials, with younger participants showing higher participation rates than older participants [Reference Murthy, Krumholz and Gross24]. In our study, only the H-TBR was associated with age, although the correlation of H-TBR scores with age was weak. Thus, the role that age plays in the relationship between trust and participation in clinical trials needs further study.
For race, Whites had higher trust scores on both TBR scales compared to Blacks. This finding is unsurprising as race has been widely associated with trust in research [Reference Durant25]. However, this suggests that improving trust in medical research could potentially increase research participation especially among those commonly underrepresented in research [Reference Bero26]. Furthermore, there were racial differences in both variables assessing attitudes, and these differences were consistent with Blacks having less trust in biomedical research than Whites. Additional factors that differed by race were education and income. Because these are key variables influencing levels of trust in research, these differences could explain why Blacks exhibited lower trust scores on both scales. However, when we controlled for age, education, and income by treating them as covariates, Blacks’ adjusted TBR scores were as different from Whites’ as they were before controlling those background factors. One hypothesis that was not directly addressed in our study is whether there are cultural differences in the wording of the items on both the TBR scales, especially M-TBR, that contributed to the racial differences we found.
Limitations exist in the current study. In particular, the Hispanic/Latino response rate was very low (1.9%) considering that they are now the largest group of minorities in USA [27]. More data on this ethnic group need to be collected before it can be concluded that these scales adequately measure trust in biomedical research for the Hispanic/Latino population. Second, our sample was one of convenience, and distribution of certain variables shows significant differences, which limits generalizability of the results; however, we tried to minimize sample differences between surveys by distributing each survey quasirandomly across sites (alternating surveys every two weeks). Therefore, our samples for each TBR scale were very similar, allowing us to factor out variance associated with sampling error. Furthermore, we have identified potential confounding factors (such as education, age, and income) which must be considered when reviewing correlational studies. Fourth, this was a cross-sectional study, which means that there is a lack of temporal causation between the exposure and outcome variables. Furthermore, the data were collected by self-report which could contribute various types of response biases. Finally, participants filled out surveys in multiple settings including health fairs, barbershops, neighborhood research centers, and RM. While this likely increased respondent diversity, it may have created unforeseen variance for which we cannot account.
Implications
Further research should be conducted with larger samples including more underrepresented groups before definitively concluding that these scales are valid for all populations. These studies should also determine if the recruitment setting impacts the responses. For example, ResearchMatch participants could demonstrate a higher level of trust since they have volunteered for research participation compared to those who are underrepresented in research. In addition, there is a need to develop new measures of trust in biomedical research which specifically target underrepresented groups and comprehensively cover all trust domains. In the development of the content areas related to specific trust constructs, engaging larger sample sizes of groups known to have lower levels of trust in biomedical research would result in a more targeted scale that addresses specific concerns such as fairness and safety. Finally, this study’s findings can be used to inform public-focused, educational interventions to increase interest and participation in research by addressing barriers to research participation and dimensions that influence trust. Furthermore, it demonstrates that these messages may need to be tailored by race, age, and/or education levels.
Conclusion
In conclusion, the two TBR scales show adequate internal consistency and associations with trust variables previously described, suggesting that they are valid, at least for White respondents. Yet, the lack of similarity and congruency in measuring trust of biomedical research suggests ineffective assessment for certain populations. Therefore, the past research as well as our current research suggests that the information provided by an instrument to measure trust in research is highly dependent on one’s choice of scale and not always related to previously identified factors of research participation.
Acknowledgements
The authors would like to thank the researchers, recruiters, and survey participants throughout the Mid-South that allowed us to conduct this research.
Financial Support
This project was made possible via Patient-Centered Outcomes Research Institute-funded grant (R-1306-04869), Vanderbilt Institute for Clinical and Translational Research (VICTR): 5UL1TR000445-09, and the Meharry-Vanderbilt Alliance.
Disclosures
The authors have no conflicts of interest to declare.


