1. INTRODUCTION
The NAVSTAR Global Positioning System (GPS) is a satellite-based radio-positioning and time transfer system designed, financed, deployed, and operated by the U.S. Department of Defense. GPS positioning accuracy in the presence of interference such as multipath or relay spoof attack is reduced greatly. For this reason, many methods have been proposed to detect and mitigate various types of interference (Jahromi et al., Reference Jahromi, Broumandan, Nielsen and Lachapelle2012). GPS spoofers cause spatial and temporal error and disrupt navigation and communication systems (Humphreys et al., Reference Humphreys, Ledvina, Psiaki, O'Hanlon and Kintner2008).
Spoofing attacks are classified into three groups: simplistic, intermediate and sophisticated. Simplistic attackers attach a power amplifier and an antenna to a GPS signal simulator (Jahromi et al., Reference Jahromi, Broumandan, Nielsen and Lachapelle2012). The second group is accomplished by combining the GPS receiver with a transmitting Radio Frequency (RF) front-end called receiver-spoofer. Sophisticated attacks contain several receiver-spoofers using a common reference oscillator and communication link and each one is adjusted to the one target antenna. Simplistic spoofing can produce GPS signals, but cannot make them consistent with the current broadcast GPS signals. Furthermore, physical limitations for placing the attacker antenna toward the victim receiver made implementation of sophisticated attacks difficult and impossible in some cases because of the target receiver's motion (Jin et al., Reference Jin, Han, Choi, Park, Heo and Lee2011). However, the receiver-spoofer can be formed small enough to place indistinctly near the antenna of the victim receiver. Therefore, we will oppose the intermediate spoofing in which the main GPS signal is re-sent to the target receiver after some precise delay.
This paper is organised as follows. After a short review of previously proposed methods in Section 2, we will try to model the spoofing attack in the tracking loop in Section 3. The proposed method estimators are described in Sections 4 and 5. Section 6 presents the results on implementing the proposed methods on both software and measurement interference data sets. Section 7 expresses qualitative comparison between previous and suggested techniques. Finally, some general conclusions are drawn in Section 8.
2. PRIOR ANTI-SPOOFING METHODS ON TRACKING LOOP
A variety of techniques have been proposed for detection and mitigation of spoofing (Jahromi et al., Reference Jahromi, Broumandan, Nielsen and Lachapelle2012). References (Lin et al., Reference Lin, Haibin and Naitong2007) have suggested anti-spoofing methods based on constantly comparing the internal and external information and then estimation of the authentic signal. A Signal Quality Monitor (SQM) can be an important subject in this field, continuously observing received GPS signals for interference, distortion and other anomalies with the purpose of raising a warning flag. Generally, SQM algorithms involve some measurements at the correlator's output and a decision process that compares such measurements with pre-defined thresholds. SQM methods are not applicable in cases where spoofing attack does not affect the shape of the correlation peak, which happens when counterfeit and authentic signals are almost aligned together (Ledvina et al., Reference Ledvina, Bencze, Galusha and Miller2010). To improve performance of the SQM method, several approaches, such as Vestigial Signal Defense (VSD), Vector-Based (VB) and combined techniques have been suggested.
In the VSD method, receivers generate far more correlators to increase the prediction accuracy on the degradation rate of the complex correlation function. When a series of correlator delays are available, a complex correlation function can be considered as a time continuous signal (Wesson et al., Reference Wesson, Shepard, Bhatti and Humphreys2011). The main idea in the VB tracking technique is to combine the navigation solution and the tracking signal (Jahromi et al., Reference Jahromi, Broumandan, Nielsen and Lachapelle2012). It is an analytical approach to investigate the interaction between the authentic and the counterfeit correlation peaks during attacks. Spoofing attack is detected if this distribution considerably deviates from the standard form. The combined technique “sandwiches” an attacker between a correlation function distortion monitoring and a total in-band power monitoring (Wesson et al., Reference Wesson, Evans and Humphreys2013).
Cryptographic techniques enable the receiver to detect valid signals from spoofing signals with high probability (Wesson et al., Reference Wesson, Shepard, Bhatti and Humphreys2011). In 2003, Logan Scott offered a method based on Spread Spectrum Security Codes (SSSCs) (Scott, Reference Scott2003). The latest version of that targets the L1C signal that will be broadcast on GPS Block III satellites. The presenting of the SSSCs has insignificant effect on receivers, since L1C acquisition and tracking happens on the pilot channel.
3. SPOOFING MODEL IN TRACKING LOOP
The interaction between spoofing and authentic signals is similar to the interaction between multipath and direct signals. However, differences between them causes significant challenges for any defence that is based on monitoring the complex correlation domain. One of the main discrepancies is amplitude. Multipath signals are weaker than the genuine ones. Another discrepancy is phase difference between the authentic and spoof signal. Multipath signal causes a slight time delay, while the delay in a spoof signal is larger (Shepard and Humphreys, Reference Shepard and Humphreys2010).
Accordingly, it can be presumed that the multipath phenomenon is an important issue in the spoofing countermeasure field. In some ways, similarity between them helps researchers to find effective methods of anti-spoofing. Besides their differences often limit the effectiveness of anti-spoofing techniques. Therefore it seems that anti-spoofing is integrally linked by multipath countermeasure methods.
It can be deduced that the tracking errors in repeat attacks are primarily the result of correlation function distortion. Figure 1 shows the normalised correlation function in the presence of spoofing. As can be concluded, the symmetry is lost and it is difficult to estimate the delay that causes positioning error. The proposed anti-spoofing solutions in the following sections are based on this concept.

Figure 1. Spoofing model in tracking loop.
4. CORRELATOR-BASED ANTI-SPOOFING METHODS
Here, two techniques are employed to mitigate the effectiveness of fake signals using correlators. In other words, the efficacy of the fake signal can be mitigated by this technique. In the following subsections, after a short description of code tracking, the previous techniques based on correlators will be reviewed to better perceive the methods related later in this paper.
4.1. Code Tracking
The front-end output from one satellite including filtering and down conversion can be described as:
Where ωIF is the intermediate frequency to which the front-end has down converted the carrier frequency. This signal is then sampled by the analogue to digital converter. Because of the narrow band pass filter around the Coarse/Acquisition (C/A) code, the P code is distorted and cannot be demodulated. Therefore, the signal from satellite k can be described as:
Where P code is described as noise e(n). The ‘n’ indicates that the signal is discrete in time, which after the low-pass filter is (1/2)Ck(n)Dk(n). In accordance with Kaplan and Hegarty (Reference Kaplan and Hegarty2007), the implemented code loop filter is a first order filter, whose function can be written as:
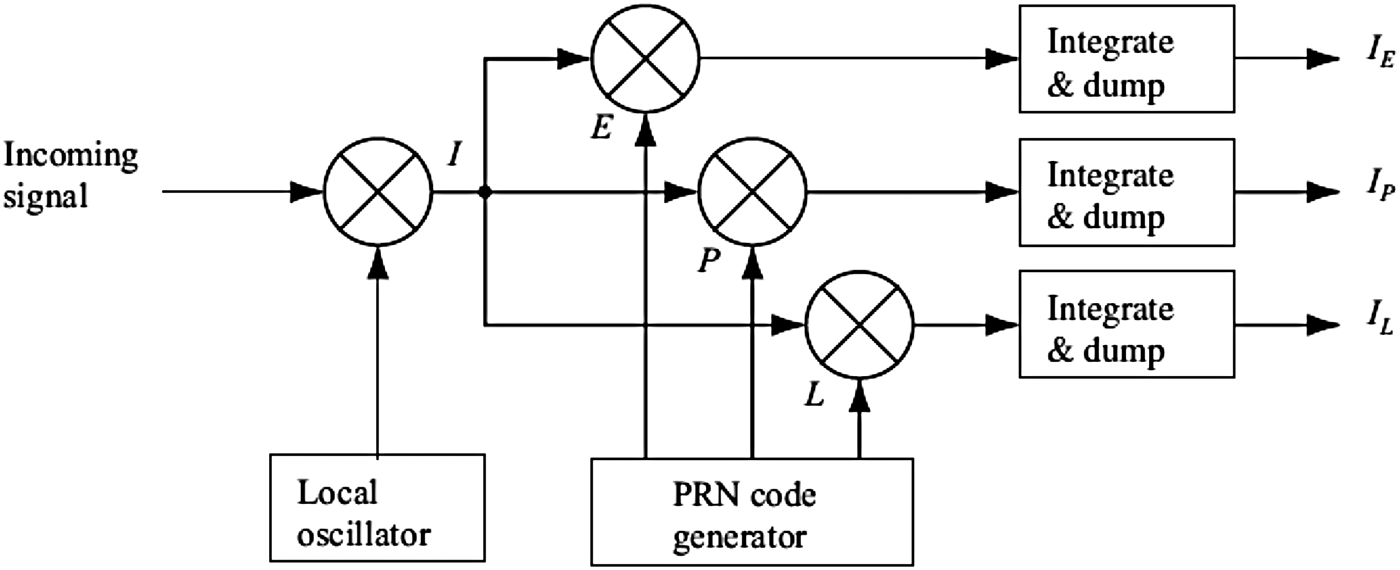
Where γ is calculated based on loop filter bandwidth. The next step is to remove the code Ck(n) from the signal by correlating the signal with a local code replica. The purpose of code tracking loop is to keep tracing the code phase of current Pseudo-Random-Noise (PRN). The code tracking is most often implemented as a Delay-Lock-Loop (DLL) where three replicas are generated and correlated with the incoming signal. These three replicas are referred to as the early, prompt and late replica, respectively. Outputs of this multiplication are integrated and dumped which indicate how well the specific code replica correlates with the received signal. An infinite-length code of truly random chips has an autocorrelation function:
 $$R(\tau ) \approx \left\{ {\matrix{ {1 - \displaystyle{{ \vert \tau \vert} \over {{T_C}}};} & {{\rm for}\; \vert \tau \vert \lt {T_C}} \cr {0}\quad ; & {{\rm otherwise}} \cr}} \right.$$
Where R represents the autocorrelation function, and τ is the lag value in units of chips. We obtain the early-late correlation values for the range of ±0·5 chips from the prompt correlator.
Based on this introduction and Figure 2, the first step in the tracking loop is converting the C/A code to baseband, by multiplying the incoming signal and replica of the carrier wave.

Figure 2. Code tracking loop block diagram (Borre et al., Reference Borre, Akos, Bertelsen, Rinder and Jensen2007).
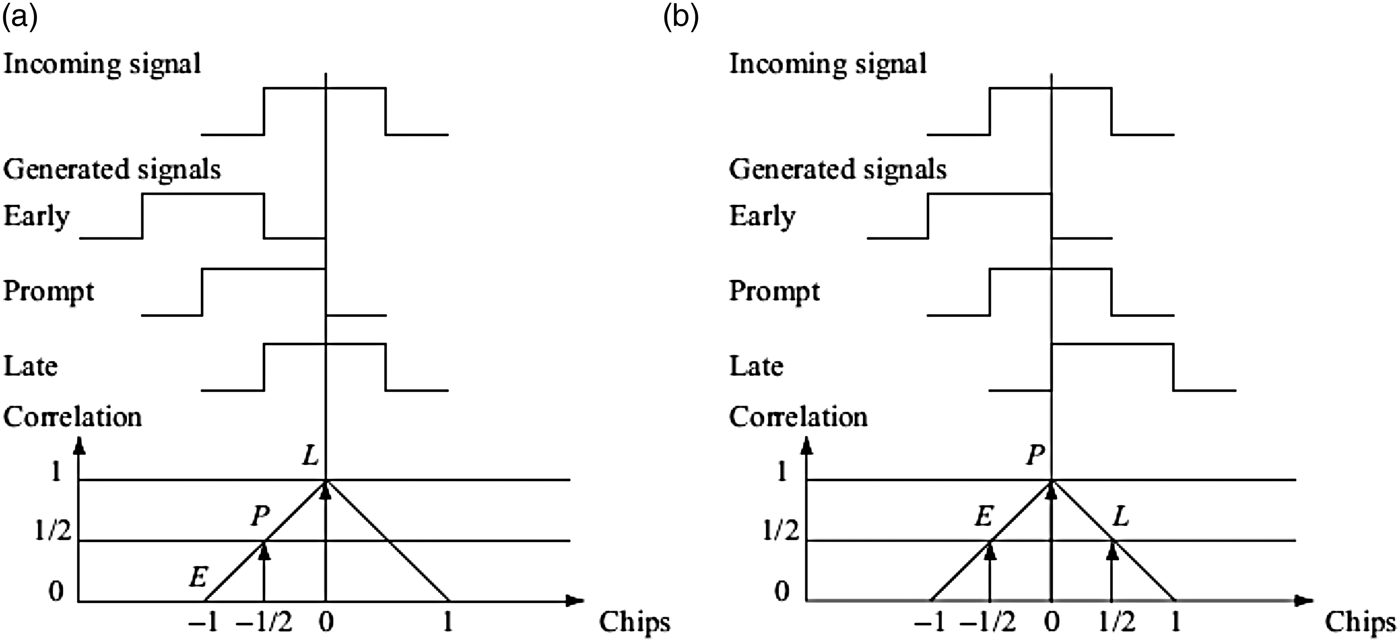
The three correlation outputs IE, IP and IL are then compared to observe which one is highest. Figure 3 shows an example of code tracking (Borre et al., Reference Borre, Akos, Bertelsen, Rinder and Jensen2007). In Figure 3(a), the late code has the highest correlation, so the code phase must be decreased (i.e., the code sequence is delayed). In Figure 3(b), the prompt is the highest and the early and late replicas have equal correlation. In this case, the code phase is correctly tracked.

Figure 3. Code tracking: (a) the late replica (b) the prompt code has the highest correlation (Borre et al., Reference Borre, Akos, Bertelsen, Rinder and Jensen2007).
4.2. Correlation-based Previous Techniques to Reduce Interference
The traditional structure for the above explained code tracking is performed by a delay estimator via a feedback loop. As mentioned in Section 4.1 the most known feedback-delay estimator is the DLL or Early-Minus-Late (EML) loop. The traditional EML fails in multipath environments. So, in the last two decades, several improved methods have been proposed. A series of enhanced EML techniques based on the narrow space chip between the early and late correlations known as narrow band EML (NEML) (Dierendonck et al., Reference Dierendonck, Fenton and Ford1992). Another family of discriminator-based DLL variants is the so-called Double-Delta (ΔΔ) technique, which uses more than three correlators. The ΔΔ technique offers better multipath rejection in medium-to-long delay multipath with a good carrier-to-noise-density ratio. Some well-known particular cases of ΔΔ technique are the High Resolution Correlator (HRC) (McGraw and Braasch, Reference McGraw and Braasch1999), the strobe correlator, the pulse aperture correlator and the modified correlator reference waveform (Weill, Reference Weill2003).
Extending these ideas and referring to described relevance between multipath and replay spoofing in Section 3, two anti-spoofing solutions are suggested as follows.
4.3. Spoof Reduction based on HRC
This section describes a simple solution which decreases spoofing effect in the tracking loop. First, two important correlation properties of the C/A codes are stated as follows to better understand the methodology:
A) All the C/A codes are nearly uncorrelated with each other. That is, for two codes Ci and Ckof satellites i and k, the cross correlation can be written as:
 $${r_{ik}}(m) = \sum\limits_{l = 0}^{1022} {{C^i}(l){C^k}(l + m) \approx 0} $$
B) All C/A codes are nearly uncorrelated with themselves, except for zero lag (Borre et al., Reference Borre, Akos, Bertelsen, Rinder and Jensen2007). This property makes it easy to find out when two similar codes are perfectly aligned. The auto-correlation feature for satellite k can be written as:
 $${r_{kk}}(m) = \sum\limits_{l = 0}^{1022} {{C^k}(l){C^k}(l + m) \approx 0} $$
The C/A code is a unique spreading sequence of 1023 chips, with 1·023 Mcps chip rate giving a period of 1 ms. Since the summation starts from ‘0’, the upper limit should be 1022. To avoid big parts of the interference influence, the narrow correlator concept was developed (Jahromi et al., Reference Jahromi, Broumandan, Nielsen and Lachapelle2012). The idea of this research has been implemented in the tracking loop of a Software Receiver (SR) to compensate interference effects. However, instead of using a standard correlator with one chip spacing, as presented in Figure 4(a), the chip spacing of a narrow correlator is smaller; usually 0·1. HRC is in the family of double difference correlators that uses two correlator pairs instead of only one. To provide spoofing mitigation, we implemented this type of correlator as illustrated in Figure 4(b). The wide pair has exactly twice the chip spacing of the narrow pair. The narrow and wide pairs have chip spacing of ±0·1 and ±0·2, respectively.

Figure 4. (a) Narrow correlation function and (b) HRC in the tracking loop.
Code discriminators are based on linear combination of two early minus late discriminators. The first one is made up of an early E1, prompt P1 and late L1. The second is made up of an early E2, prompt P2 and late L2 (Benachenhou et al., Reference Benachenhou, Sari and Hammadouche2009).
4.4. Spoof Reduction based on MultiCorrelator
In this structure, a bank of correlators is used in a multicorrelator structure (Zahidul et al., Reference Zahidul, Bhuiyan, Hu, Lohan and Renfors2009). After converting the Radio Frequency (RF) input signal to Interference Frequency (IF) signal and wiping-off the carrier, the received post-processed signal is passed through the correlator bank. Figure 5 shows a diagram of the performed algorithm. In some situations, some of the correlators in the bank can be kept inactive. As shown in Figure 5, the Numerically-Controlled-Oscillator (NCO) and PRN generator block produces a bank of early-late versions of replica codes based on the delayed authentic signal. The correlator spacing is Δ, and the number of correlators is N.

Figure 5. Block diagram for multicorrelator-based DLL implementation.
This large number of correlators is needed in the feed-forward techniques, which make use of these correlators for estimating the channel properties while taking decisions about the code delay. The theoretical basis of this method is the maximum likelihood estimation theory. The objective function is to minimise the Mean-Square-Error (MSE) given as:
Where s(t) and r(t) are authentic and spoof signals, respectively. The simplest solution for this problem is reached by setting the partial derivatives of the MSE as defined in Equation (8). Previous mathematical studies lead to the following solution for this equation system (Leick, Reference Leick2004):
 $$\eqalign{& {{\hat{\rm \tau}} _{\rm i}} = \mathop {\max} \limits_{\rm \tau} \left[ {{\mathop{\rm Re}\nolimits} \left( {\left( {{{\rm R}_{{\rm XX}}} - \sum\limits_{{\rm X} = {\rm i}}^{\rm M} {{{\hat{\rm a}}_{\rm X}}{\rm R}({{\rm \tau} _{\rm i}} - {{\hat{\rm \tau}} _{\rm X}})} \exp ({\rm j}{{\hat{\rm \theta}} _{\rm X}})} \right)\exp ( - {\rm j}{{\hat{\rm \theta}} _{\rm i}})} \right)} \right] \cr & {{\hat{\rm \theta}} _{\rm i}} = \arg \left[ {{{\rm R}_{{\rm XX}}}({{\hat{\rm \tau}} _{\rm i}}) - \sum\limits_{{\rm X} = {\rm i}}^{\rm M} {{{\hat{\rm a}}_{\rm X}}{\rm R}({{\rm \tau} _{\rm i}} - {{\hat{\rm \tau}} _{\rm X}})} \exp ({\rm j}{{\hat{\rm \theta}} _{\rm X}})} \right]} $$
Where Rxx is the in-phase/quadrate down-converted correlation function and R(Δτ) is the reference correlation function. The main idea of the multicorrelation process is performing curve fitting in a non-linear way. The advantage of the multicorrelation technique is that curve fitting is done by taking into account M + 1 signals and not only the direct path signal. The evaluation of the multicorrelation technique performance can be done by evaluation of the lower bounds of observable code and carrier.
 $$\Delta {\rm \tau } = \displaystyle{{\rm c } \over {{\rm T }_{\rm c}}}\sqrt {\displaystyle{{{{\rm N}_{{\rm TLoop}}}{\rm d}} \over {2{{{\rm C}} {\big/ { { {{\rm No}}}}} }}}}; \Delta {\rm \theta } = \displaystyle{{\rm \lambda } \over {2{\rm \pi }}}\sqrt {\displaystyle{{{{\rm N}_{{\rm TLoop}}}{\rm d}} \over {2{{{\rm C}} {\big/ { { {{\rm No}}}}} }}}}$$
Where c is light speed, C/N0 the carrier to noise ratio, NTLoop is the equivalent noise bandwidth of the tracking loop and d is the early late spacing in chips relative to the code tracking loop.
In the EML tracking loop, the corresponding early-late spacing is 2Δ. The received signal is correlated with each replica in the correlator bank, and the outputs of the correlator bank are a vector of samples in the correlation envelope. The discriminators in Figure 5 utilise the correlation values as input, and generate the estimated line of sight delay as output, which is then smoothed by a loop filter. Lastly, the average of the initial and final points is utilised as the input of the discriminator. Based on simulation results, ten correlators have the best trade-off between accuracy and computational complexity. Selected chip spacing was ±0·1.
5. SPOOF CANCELLATION BASED ON ADAPTIVE FILTERING
The block diagram of the suggested mitigation system is shown in Figure 6. The main objective of interference cancellation is estimating the troublemaker signal and subtracting it from the input signal that is a combination of the original and interference signals. The elimination of spoofing error is possible only if the main source that includes the fake signal is available. The received signal is processed in the RF filter, then is down converted and sampled to digital IF signal. The tracking module performs the correlation function in the PLL and DLL. The spoof estimator is used to estimate the correlation parameter of the forgery signal. This is realised with a modified adaptive filter by employing a duplicated signal and a digital IF signal. As shown in Figure 6, the estimated signal parameters are then sent to the correlation decomposer and the correlation value of the fake signal is determined in the spoof cancellation area. The estimated signal is recreated at the modified adaptive filter and subtracted from the correlation value of the received signal.

Figure 6. Block diagram of spoof mitigation system.
The model of an authentic GPS signal at the A/D output can be shown as:
Where P(n−τ0) is the spread-spectrum code. A0, τ0 and ϕ 0 are GPS signal amplitude, code delay and carrier phase, respectively. w0 is the IF angular frequency. Consequently, the total authentic GPS signal and spoof signals are expressed as:
 $$y(n) = \sum\limits_{i = 0}^M {{A_m}P(n - {\tau _i})\cos ({w_i}n + {\Phi _i})} $$
Where A m, τ i and ϕ i are the amplitude, delay code and carrier phase, respectively. In this way, as an input GPS signal we have:
 $$y(n) = \sum\limits_{i = 0}^M {{A_m}} P(n - {\tau _i})\cos ({w_i}n + {\Phi _i}) + \eta (n)$$
Where η(n) is the white Gaussian noise distribution added into the A/D. Figure 7 shows the diagram for the adaptive filtering algorithm. Inputs to the adaptive filter are DLL and PLL outputs multiplied and delayed within τ d. Afterwards, the output is estimated by applying the appropriate weights. Moreover, the estimator reference input is a multiplication of code and carrier replicas output from the DLL and PLL, respectively. It has been shown that:
Where τerr and ϕ err are measurement delay and carrier phase, respectively. τd is the value of delay element and kτ d is the maximum delay of all the spoofing signals; i = 1 here. In other words, it is assumed that we have a single spoof signal. IF digital signal is estimated as:
 $$\mathop {\tilde y}(n) = \mathop \sum\limits_{t = 0}^{\tilde {\!M}} {{{\,\,\mathop{\tilde {\!\!\!A}}}_i}} p(n - {\tilde \tau _i})\cos (wn + {\tilde \varphi _i}) + \eta (n)$$
Where ![]() ${\rm wi} = {{\hat{\rm A}}_{\rm i}}\cos ( - {{\hat \varphi} _{\rm i}})$ is an adjustable weight. In order to minimise the cost function shown in Equation (15), the filter weights will be optimised.
${\rm wi} = {{\hat{\rm A}}_{\rm i}}\cos ( - {{\hat \varphi} _{\rm i}})$ is an adjustable weight. In order to minimise the cost function shown in Equation (15), the filter weights will be optimised.

Figure 7. Block diagram for adaptive filtering algorithm.
The IF digital signal given in Equation (14) can be considered as the desired signal. After the converging of the learning algorithm, the estimated parameters will be achieved. Thus, the delayed signal can be removed from the input signal and the authentic signal will be estimated. The reference signal that produced each output delay component was shown in Equation (13). Accordingly, if the algorithm converges, the estimated parameters will be obtained from the filter weights and delay component. After processing with the adaptive filter, the correlation discriminator separates them into authentic and spoof parameters. Finally, the estimated parameters for calculating correlations are used to deceive. Correlation with the delay and phase of the carrier signal deception is estimated by:
Where C(τ) is autocorrelation function ![]() $({\rm E}[{\rm p}({\rm n}){\rm p}({\rm n} - {\rm \tau })])$ of pseudo-random GPS signal. In the spoof cancelation section, spoof signal correlation (Cp) will be subtracted from spoof signal correlation (Cr) that is shown as:
$({\rm E}[{\rm p}({\rm n}){\rm p}({\rm n} - {\rm \tau })])$ of pseudo-random GPS signal. In the spoof cancelation section, spoof signal correlation (Cp) will be subtracted from spoof signal correlation (Cr) that is shown as:
An adaptive algorithm such as the Least Mean Squares (LMS) algorithm or the Back Propagation (BP) learning algorithm is often utilised to adjust the weights of the Adaline.
5.1. Least Mean Squares (LMS) Algorithm
From a stochastic point of view, the optimisation problem leads to Wiener filter theory. The performance function that is described for the Wiener filter and can be written as:
Access to the minimum of the MSE function using direct or indirect methods requires certain statistics such as averaging of whole samples from the beginning until now, which may not be possible in practical applications. To solve this problem, the signal can be assumed to be ergodic. Therefore, instantaneous averaging of the error signal can be used instead of ensemble averaging.
In order to achieve this goal for search methods, very rough estimates of the required statistical characteristics are used. The LMS algorithm is one of the most fundamental weight reforms because of the simplicity of the concept utilised for this purpose. Moreover, implementations of such algorithms are widely used in various branches of the correction weights in neural networks. This algorithm is based on probability and statistics to find the optimal point, and then weights are altered accordingly. Equation (19) shows the error signal or cost function. The desired signal is estimated according to Equation (20):
Where w(n) and x(n) are achieved from Equations (21) and (22), respectively.
According to Equation (23), an instantaneous value of the square of the error signal is used as an estimation of the MSE.
Equation (23) after simplification can be reduced to:
Where μ is the algorithm step-size and controls the speed of the convergence. This algorithm after convergence can reduce spoofing influence. To improve the structure of the adaptive filtering, a Back Propagation (BP) algorithm can be used instead of the LMS algorithm.
5.2. Back Propagation Algorithm
In this case, we used gradient descent to minimise the square error between the output and the objective function. The utilised adaptive filter applies a BP technique. BP is a kind of supervised learning algorithm used in a multilayer perceptron. To train a multilayer perceptron with a BP algorithm, the perceptron must have at least three layers: input, hidden, and output layer. BP has two phases: feed-forward and error-back propagate. The feed-forward propagates an input vector through the layers to produce the output vector. The Root Mean Square (RMS) error is then calculated between the perceptron output and the desired output for the input vector. The error-back propagates the error back through the layers from output to hidden and input layer. In each layer and each neuron in the layer, the synaptic weights are updated. The progress is repeated with all input vectors over and over until the perceptron has converged to the solution. The algorithm is stopped when the value of the error function has become sufficiently small. Finally to gain weight, Equations (25) and (26) are used.
Based on Equation (20) and the definition of L in Equation (15), we have:
 $${\hat{\rm Y}}({\rm n}) = \sum\limits_{{\rm i} = 1}^{\rm k} {{{\rm w}_{\rm i}}} ({\rm n}){{\rm x}_{\rm i}}({\rm n}) + {{\rm w}_{\rm b}}({\rm n}){{\rm x}_{\rm b}}$$
Similarly wb(n + 1) can be obtained by:
By using BP we can avoid inherent limitations in the LMS and improve filter convergence rate. Thus, the BP is the simplest self-learning algorithm that adapts itself to achieve an optimal solution.
6. PERFORMANCE ANALYSIS AND SIMULATION RESULTS
The performance of the proposed techniques was validated using several spoof data sets. The spoofing data collection process is described briefly and then the performance of suggested algorithms will be analysed in various schemas.
6.1. Spoofing Data Generation
The counterfeit data collection procedure provides a batch data set to evaluate the suggested techniques. A SR was combined with a transmitting RF front-end for practical implementation of an intermediate attacker. First, a software spoofing data set was produced from the IF signals of the collected data set; the input signal was delayed and then was combined with the authentic signals. Changing the delay time and amplitude of counterfeit signal creates different data sets. All inputs in the first data set are made up in the laboratory, 37 seconds long and with a size of about 200 Mbytes. In the second data set, the RF signals generated by a GPS signal simulator were combined instead of IF signals. The block diagram of the total implemented system for the second data set is shown in Figure 8.

Figure 8. Block diagram of the total implemented system.
The processed signal in civil receivers takes the form (Kaplan and Hegarty, Reference Kaplan and Hegarty2007):
Consequently, the constructed counterfeit signal can be expressed as:
 $$\eqalign{{C_{L{1_{CA}}}}(t) = \ & A_C^A C_i^A (t)D_i^A (t)\sin ({w_{L1}}(t - \Delta {t_A}) + \phi _{L1}^A ) \cr & + A_C^D C_i^D (t)D_i^D (t)\sin ({w_{L1}}(t - \Delta {t_D}) + \phi _{L1}^D )}$$
Where A and D present the authentic and delayed signal, respectively. Equation (33) is the spreading signal for deception. After providing the faked signal and transmitting, the signal of the victim receiver can be expressed as:
We know that power of the received GPS signal is low on the surface of the Earth (Cheng et al., Reference Cheng, Cao, Xu and Li2009). To negate the authentic signal in a stationary GPS receiver, the power of the constructed counterfeit signal can be increased and adjusted to be higher than the authentic one. Neglecting ΔtA, Equation (34) can be corrected as:
The remainder of this section will analyse acquired results of the algorithms. The function acquisition in SR employs the parallel code phase search algorithm in frequency steps of 0·5 kHz. The correlation results are saved and the function proceeds with the next frequency step. Thus the function steps through all frequency bands (user-defined Doppler space). Next the function looks for a maximum correlation value. After the peak is detected, the function looks for the second highest correlation peak in the frequency bin of the highest peak. Then, the ratio of the two peaks is used for the signal detection rule. This ratio, defined as acquisition level, is compared to the value pre-set in the receiver variable acq_threshold by default amount of 5·8. In this way, SR was set up and the satellites with acquisition level more than 5·8 were recognised. Figure 9 shows acquisition results for authentic and fake signals; the green colour indicates valid and detected satellites. As observed, PRN3 is lost and the acquisition level of others are changed due to the spoofing attack.

Figure 9. Acquisition results for (a) authentic and (b) fake signals.
Figures 10 and 11 show the results of the navigation solution for authentic and fake signals. The above figures represent the positioning results in East, North and Up (ENU) coordinates at the ENU system. As can be seen, positioning deviation has been greatly increased in the forged signal. In the lower right of the figures, lost or added satellites are shown.

Figure 10. Navigation solution of authentic data.

Figure 11. Navigation solution of authentic plus interference data.
Longitude, latitude and altitude of GPS receiver position are shown in the lower-left for almost 60 seconds. As can be seen, the spoofing has caused unusual divergence. Figures 12 to 14 show the ENU variations for the authentic and spoofed data and are plotted in the same figure, so that a more visible and clear comparison can be made.

Figure 12. E coordinate of counterfeit and authentic signals.

Figure 13. N coordinate of counterfeit and authentic signals.

Figure 14. N coordinate of counterfeit and authentic signals.
There are different amounts of spoofing errors in the first and second data sets. In order to evaluate the proposed algorithms, the authors randomly selected five data sets from each one. In other words, we have five inputs that are randomly selected from the software spoofing data set. Similarly, five sets of spoofing data were randomly picked out among measurement data sets.
6.2. Test Results of HRC Approach
ENU Coordinate variations before and after applying the suggested algorithm are depicted in Figure 15. As can be observed, the proposed interference cancelling technique powerfully nullified the undesirable deviation caused by attack. DLL discriminator output error before and after applying the algorithm is shown in Figure 16. As can be seen, DLL discriminator error rate in estimated signal has been reduced.

Figure 15. Navigation results before and after applying HRC.

Figure 16. DLL discriminator output error before and after applying HRC.
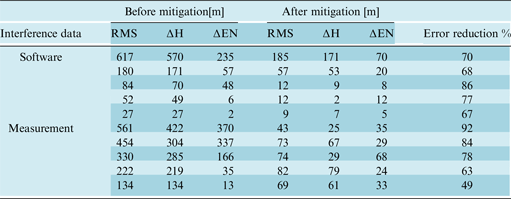
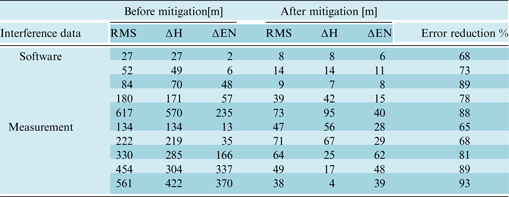
Table 1 shows anti-spoofing results of using HRC for software and measurement data sets. In these tables, RMS refers to position differences between navigational solutions based on authentic and spoof signals, ΔH is height difference and ΔEN is variation in surface horizons. For example, the first line of the table belongs to a data set with 617 m spoofing error which reduced to 185 m after applying the HRC approach in tracking loop. Also, ΔH is corrected from 570 to 171 m and ΔEN from 235 to 70 m. In summary, this method could reduce the effect of software interference data sets in average of 74%, with a tolerance of 19%. Similarly, in the measurement data, effects of interference declined in average 73%, with a tolerance of 43%. It is worth noting that the difference between the highest and lowest spoofing reduction percentage for each set of spoofing data is reported as tolerance in the right column of the table.
Table 1. Results of error mitigation using HRC approach.

6.3. Test Results of the Multiple-correlator Approach
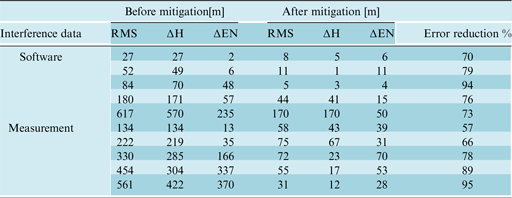
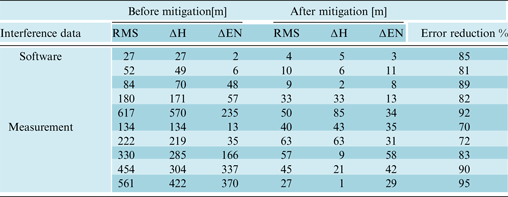
Results of this technique are reported in Table 2 for software and measurement data sets. It can be easily calculated that the suggested method reduces spoofing error of software data sets by an average of 78%, with a tolerance of 19%. Similarly, measurement data effects of interference declined on average by 77%, with a tolerance of 37%. As can be seen, compared to the first method, we have 5% and 4% improvement in software and measurement data sets, respectively. This improvement is due to the larger number of correlators, which improves the accuracy of the estimated correlation function. This large number of correlators is needed in order to include the feed-forward techniques in the comparison, because feed-forward techniques make use of these correlators for estimating the channel properties while taking decisions about the code delay.
Table 2. Results of error mitigation using multicorrelator approach.

In fact, this method tracks an average between correlators, so the general form of the correlation function is estimated with a good approximation. Therefore, the resulting correlation output is similar to the authentic correlation function. ENU coordinate variations before and after applying the second algorithm are depicted in Figure 17. As observed, the proposed technique based on multicorrelator, cancelled the effect of the forged signal. DLL discriminator output error before and after applying the algorithm is shown in the Figure 18. In this technique, DLL discriminator error rate has more reduction compared to the first method.

Figure 17. Navigation results before and after applying multicorrelator algorithm.

Figure 18. DLL discriminator output error before and after applying multicorrelator.
6.4. Test Results of the LMS Algorithm
Table 3 shows the results of using the LMS algorithm to reduce the effects of spoof signals for the software and measurement data set. Spoofing error in both software and measurement data sets are reduced by 79% on average. Tolerances of mitigations are 21% for the software data set and 28% for the measurement data set. Scrutiny in results shows that slight improvement is achieved compared to the two previous methods. Moreover, Figure 19 shows ENU coordinate variations before and after applying the LMS algorithm as reduction of spoof signal effects. As we know, spoof attacks change the navigation data bits.

Figure 19. Navigation results before and after applying LMS algorithm.
Table 3. Results of error mitigation using LMS algorithm.

6.5. Test Results of the BP Algorithm
As mentioned above, to improve the result of estimation methods we use BP instead of the LMS algorithm. Table 4 shows the results of using BP algorithm. ENU coordinate variations before and after applying the BP algorithm is depicted in Figure 20.

Figure 20. Navigation results before and after applying BP algorithm.
Table 4. Results of error mitigation using BP algorithm.

From our results it can be extracted that in the adaptive filter technique, the spoof reduction percentage is larger than for the correlator-based approaches. The reason for these results is that in the first approaches we used different correlators to decrease spoof influence, but in later approaches, the spoof signal was estimated and subtracted from the input signal to achieve the authentic signal. Therefore, they are more accurate.
7. PERFORMANCE COMPARISON
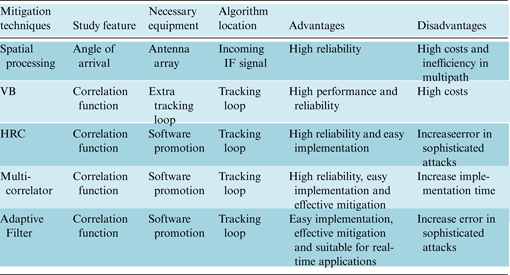
Table 5 shows a quantitative comparison between the proposed methods. According to these results, the BP algorithm is the most improved technique because it has the highest reduction and lowest variation. Furthermore, Table 6 shows the qualitative comparison between previous and proposed techniques. As can be seen, the overall effectiveness of the proposed methods is superior to others. Previous techniques that have been used to reduce the effect of spoof in the tracking loop have high implementation costs, because they add extra hardware. In addition to the benefits of the previous methods, the suggested techniques in this paper require no additional hardware and have simple implementation.
Table 5. Comparative performance of spoof mitigation techniques on spoof data sets.

Table 6. Comparative performance of spoof mitigation techniques.

8. CONCLUSION
The main focus of this paper was the vulnerability assessment of GPS receivers to structural interference signals and the authenticity verification of received fake GPS signals. We proposed two groups of novel methods for modelling and mitigating spoofing influence in the tracking loop of civil GPS receivers. Also, different data sets were collected and used for verifying the submitted scheme. The suggested approaches assessed the GPS position deviation effected under spoofing. The first technique was proposed based on correlators. Initially we used HRC; to improve its performance, multicorrelator technique with different chip spacing was used. It could be seen from the results that the RMS values of the spoofing errors had been reduced after using both of techniques, but the multicorrelator technique had better performance compered to HRC, because of utilising more correlators.
The basis of the proposed techniques are previously utilised in multipath mitigation. Here we reorganised them in the case of correlator's coefficients and chip spacing. In the second method, we used adaptive filtering to estimate the spoof signal and subtract it from the input signal, to achieve an authentic signal. As was observed, BP algorithm compared to the LMS algorithm had improved performance. In addition, both techniques are better than the original method. The main novelty of this paper is in the second group of techniques. In these techniques estimators are utilised in order to model the spoofing signal in the tracking loop. As a result, the input signal will be corrected earlier than navigation level. Moreover, BP and LMS have been designed by completely different parameters.


