Introduction
Bushmeat hunting is a threat to wildlife populations in many parts of sub-Saharan Africa (Barnett, Reference Barnett1997; Cowlishaw et al., Reference Cowlishaw, Mendelson and Rowcliffe2005; Sinclair et al., Reference Sinclair, Mduma, Hopcraft, Fryxell, Hilborn and Thirgood2007) and this pressure is increasing with the rapid growth in the human population. This is especially true where ecosystems contain large populations of migratory wildlife, such as the Serengeti, in Tanzania (Barrett & Arcese, Reference Barrett and Arcese1998; Loibooki et al., Reference Loibooki, Hofer, Campbell and East2002; Knapp, Reference Knapp2007; Sinclair et al., Reference Sinclair, Mduma, Hopcraft, Fryxell, Hilborn and Thirgood2007). Studies have found that bushmeat is consumed regularly by 45–60% of households in the north-west Serengeti (Barnett, Reference Barnett1997; Campbell et al., Reference Campbell, Nelson and Loibooki2001) and hunting, which was traditionally a subsistence activity, has become increasingly commercial (Barrett & Arcese, Reference Barrett and Arcese1998; Campbell et al., Reference Campbell, Nelson and Loibooki2001; Loibooki et al., Reference Loibooki, Hofer, Campbell and East2002).
The annual migration of c. 1.3 million wildebeest Connochaetes taurinus and 200,000 zebra Equus burchelli defines the ecological boundaries of the greater Serengeti ecosystem. Migratory wildlife are particularly affected by illegal bushmeat hunting (Campbell & Borner, Reference Campbell, Borner, Sinclair and Arcese1995; Barrett & Arcese, Reference Barrett and Arcese1998; Loibooki et al., Reference Loibooki, Hofer, Campbell and East2002; Holmern et al., Reference Holmern, Mkama, Muya and Roskaft2006; Knapp, Reference Knapp2007; Ndibalema & Songorwa, Reference Ndibalema and Songorwa2008) as their predictable seasonal movement patterns make them easy targets. Although bushmeat from the Serengeti has been reported to reach many cities and towns throughout East Africa, the size of the market is unknown (Campbell et al., Reference Campbell, Nelson and Loibooki2001). Here, we focus on locally-consumed bushmeat but acknowledge that distant markets probably add significantly to the total offtake.
A variety of methods have been used to estimate the offtake of Serengeti wildlife and these have yielded various conclusions. Estimates range from 60,000 wildebeest per year, based on assumed consumption patterns (Barrett & Arcese, Reference Barrett and Arcese1998), to 118,000 wildebeest per year, based on estimates of poacher numbers in the surrounding areas (Campbell & Hofer, Reference Campbell, Hofer, Sinclair and Arcese1995). A study in the adjoining Maasai Mara Game Reserve of Kenya (Ogutu et al., Reference Ogutu, Piepho, Dublin, Bhola and Reid2009) discovered that many of the key ungulate populations had decreased significantly, and this was attributed largely to poaching.
Other estimates of offtake are based on an ecological model of wildebeest dynamics that uses long-term datasets of wildebeest population trends and rainfall (Pascual & Hilborn, Reference Pascual and Hilborn1995; Mduma et al., Reference Mduma, Sinclair and Hilborn1999). This method examines data on ungulate population trends, age structure and recruitment, and generates an estimate of offtake consistent with observed wildebeest population dynamics (Mduma et al., Reference Mduma, Hilborn and Sinclair1998, Reference Mduma, Sinclair and Hilborn1999; Metzger et al., Reference Metzger, Sinclair, Campbell, Hilborn, Hopcraft, Mduma and Reich2007). Mduma et al. (Reference Mduma, Sinclair and Hilborn1999) concluded that wildebeest populations are regulated by dry season rainfall more than by anthropogenic offtake and predation. They estimated that wildebeest mortality from poaching was < 40,000 animals per year and that the migratory population could not sustain offtake of > 80,000 animals per year. However, without comprehensive knowledge of offtake and utilization by local communities, estimates of the effect of poaching on large populations of migratory wildlife are largely conjectural.
We used a novel dataset to quantify local consumption of bushmeat as a tool for directly measuring the effect of bushmeat hunting on migratory wildebeest. Our objective was to determine the extent of bushmeat use by communities adjacent to protected areas throughout the Serengeti ecosystem and to assess the effect of local consumption on key migratory wildlife populations. We estimated an annual offtake of 97,796–140,615 wildebeest per year (6–10% of the current population), which is consistent with prior estimates based on consumption or poaching activity and higher than estimates based on ecological models, suggesting that the ecological models have underestimated the extent of poaching in the Serengeti.
Study area
The Serengeti ecosystem covers almost 27,000 km2 in northern Tanzania and consists of a mosaic of protected areas (Fig. 1). Wildlife is not confined to the protected areas and animals face a greater risk of being hunted when they travel beyond protected area boundaries (Campbell & Borner, Reference Campbell, Borner, Sinclair and Arcese1995; Campbell & Hofer, Reference Campbell, Hofer, Sinclair and Arcese1995; Knapp et al., Reference Knapp, Rentsch, Schmitt, Lewis and Polasky2010).

Fig. 1 Serengeti National Park, Tanzania, with adjacent protected areas and study sites. Black circles indicate the eight study villages.
This study was conducted in communities adjacent to the western boundary of the Ikorongo and Grumeti Game Reserves, the Ikona Wildlife Management Area, and Serengeti National Park (Fig. 1). The Game Reserves and Wildlife Management Area largely function as buffer zones between local communities and the National Park, and thus the communities along the boundaries of these areas are the major source of illegal wildlife hunters in the region (Campbell & Hofer, Reference Campbell, Hofer, Sinclair and Arcese1995; Loibooki et al., Reference Loibooki, Hofer, Campbell and East2002).
Methods
Monthly dietary recall survey
We collected dietary recall data from eight villages in the Serengeti and Bunda districts to the west of Serengeti National Park during 2007–2010. These districts have been shown to have the highest levels of bushmeat hunting around the Serengeti ecosystem (Campbell et al., Reference Campbell, Nelson and Loibooki2001). The villages, located immediately adjacent to Serengeti National Park or Ikorongo and Grumeti Game Reserves, were selected at random, with the requirement that no two villages could border each other. Two enumerators from each village were employed to assist with data collection and received extensive training in the use of the questionnaire and the selection of random households. Four sub-villages were selected at random from each village (villages typically contain 6–10 sub-villages). Four to five households were selected from each sub-village, selecting the first household at random by choosing a random compass direction and then skipping four households before approaching the next household. A panel of 132 households was revisited monthly for 34 months by local enumerators.
Dietary recall has been shown to be an effective method for deriving the sources of food consumed by a large population (Hebert et al., Reference Hebert, Ockene, Hurley, Luippold, Well and Hamatz1997). Weekly dietary recall questionnaires provide a broad time horizon for assessing varied diets (Gersovitz et al., Reference Gersovitz, Madden and Smiciklas-Wright1978; Day et al., Reference Day, McKeown, Wong, Welch and Bingham2001) and have greater reliability when estimating village-level involvement in bushmeat consumption compared to other self-response survey techniques (Knapp et al., Reference Knapp, Rentsch, Schmitt, Lewis and Polasky2010). Our questionnaire consisted of a dietary recall survey of the meat-based protein sources cooked and consumed in the household each day over the previous week, including beef, goat, sheep, chicken, pork, fish, dagaa (small fish), bushmeat and eggs. Enumerators also recorded information on meat preparation (dried vs fresh), source, quantity (in kg) cooked for the household and price per unit (usually per kg). The local enumerator visited each household on the same date (plus or minus one day) each month. Any questions that were unanswered or coded incorrectly by the enumerator were indicated as missing data in the analysis.
Estimates of offtake
Although consumption data are available for a variety of species, we focus on wildebeest for several reasons. Wildebeest make up the largest biomass of mammals and their migration is the defining attribute of the ecosystem, thus any existential threat to wildebeest is a fundamental conservation issue. Furthermore, because wildebeest are the primary source of bushmeat they provide the most robust data within the sample.
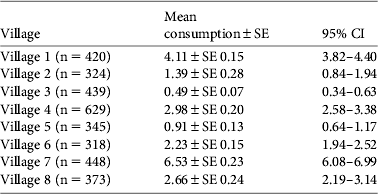
We extrapolated the weekly number of bushmeat meals in wards adjacent to the protected areas in the western Serengeti from the mean mass (kg) of bushmeat per meal per household per week in the study villages. Data on the total population and number of households in each ward came from the 2002 Tanzanian National Census (Tanzania National Bureau of Statistics, 2002). Because the accuracy of these estimates depends on a number of assumptions, we created low-, medium- and high-offtake scenarios. The high estimate is based on the upper 95% confidence interval of estimated meals that contain bushmeat consumed in each village, assumed to be the same in all villages within the same ward. The medium estimate is based on the mean number of bushmeat meals consumed per household per week, excluding village number 7, which appeared to be an outlier (with a mean of > 6 bushmeat meals per week vs a mean of 2.7 for the other seven villages; Table 1). The low estimate of offtake is based on the lower limit of the 95% confidence interval (excluding village number 7).
Table 1 Mean number of meals containing bushmeat consumed per household per week (n = 3,296, 132 households over 34 months) in communities in the vicinity of Serengeti National Park, Tanzania (Fig. 1), presented by village.

Cross-sectional consumption data
In 2006 the research-based NGO Savannas Forever Tanzania collected baseline data on socio-economic status and children's health. During August–September 2006 they surveyed the eight villages targeted in our dietary recall survey; six additional villages along the boundary of Maswa Game Reserve in the south-west of the ecosystem were surveyed in October 2006. Anthropometric measurements were made for children of volunteering mothers, and the mothers (n = 1,898; 1,104 in the north-west and 794 in the south-west were asked to list the protein sources consumed during the previous 7 days.
Anti-poaching records
Poaching data were made available for Grumeti and Ikorongo Game Reserves (courtesy of the Grumeti Fund) and parts of Maswa Game Reserve (Table 3; courtesy of the Friedkin Conservation Fund). Information about carcass species and abundance was based on data collected on daily foot patrols performed year-round. Anti-poaching patrols report any illegal activity within the reserves, including the number of poachers arrested, their home village, the types of animals hunted, and the hunting methods used. Data on the abundance of large animal species were obtained from the annual total count, carried out by helicopter, by the Grumeti Fund.
Consumption estimates for the south-west Serengeti ecosystem
The area adjacent to the Maswa Game Reserve in the south-west region of the Serengeti ecosystem is predominantly populated by Sukuma people, who have been known historically to consume substantial quantities of bushmeat (Holmern et al., Reference Holmern, Johannesen, Mbaruka, Mkama and Røskaft2004). Ninety-four percent of households in this region claimed to consume bushmeat, with 55% reporting that bushmeat was their most important source of protein and that it was consistently cheaper than domestic meat (Barnett, Reference Barrett and Arcese1997). The 2006 cross-sectional socio-economic survey conducted by Savannas Forever Tanzania found that the proportion of households in south-west Serengeti villages reporting monthly bushmeat consumption was not significantly different from that in the north-west (Schmitt, Reference Schmitt2010). Therefore, we assume that the pattern of bushmeat consumption for households in the south-west is similar to that in the north-west.
However, we assume that the south-west districts have access to wildebeest for fewer months than those in the north-west as the migrating wildebeest typically spend less time in this area (Maddock, Reference Maddock, Sinclair and Norton-Griffiths1979; Campbell & Hofer, Reference Campbell, Hofer, Sinclair and Arcese1995) and wildebeest account for only 20% of the carcasses found by anti-poaching patrols in the south-west (Table 3). We therefore assume wildebeest account for only 20% of the bushmeat consumed there. To provide a minimum estimate of the overall consumption of bushmeat in the south-west Serengeti we used the lower bound of the 95% confidence interval of the mean consumption of bushmeat (kg) per household per week in the north-west. For the medium estimate we assumed that consumption in the south-west was equal to that in the north-west, and used the mean consumption (kg) per household per week, excluding village number 7, yielding an estimate of 1.8 kg per household per week. For the upper bound we used the overall mean number of meals per household per week (2.2) for the north-west Serengeti (Table 4).
Results
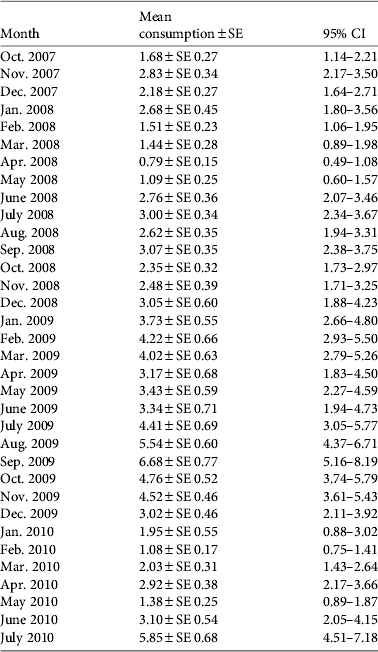
The monthly dietary recall panel survey of 132 households during October 2007–July 2010 yielded a total of 3,296 weekly data points (some households were not available every month, others moved away from the study area after the survey began). Bushmeat consumption varied from month to month, in the range of 0.79–6.68 meals per household per week (Table 2), and was highest during or immediately after the months when migratory wildlife were present in the area.
Table 2 Mean number of meals containing bushmeat consumed per household per week (n = 3,296, 132 households over 34 months) in communities in the vicinity of Serengeti National Park, Tanzania (Fig. 1), presented by month.

Approximately half of the 3,296 weekly data points (1,749) reported bushmeat consumption in the previous week. In households that reported the species of bushmeat consumed, 47% of the bushmeat meals consisted of wildebeest. We tested whether the proportion of wildebeest in the diet depended on relative species abundance in the ecosystem or consumer preference by comparing observed levels of bushmeat consumption with (1) the Grumeti Fund's 2006 and 2007 aerial censuses, and (2) the relative abundance of carcasses found during routine anti-poaching patrols during 2006–2009 (Fig. 3). The relative frequency of the top four species consumed was correlated with the relative abundance of that species (0.97) and the number of carcasses found on patrols (0.99). In the absence of comparable monthly protein consumption data for the south-west Serengeti we estimated relative species consumption in this region, based on the number of carcasses encountered by Tanzania Game Tracker Safaris during anti-poaching patrols in and around Maswa Game Reserve (Table 3).

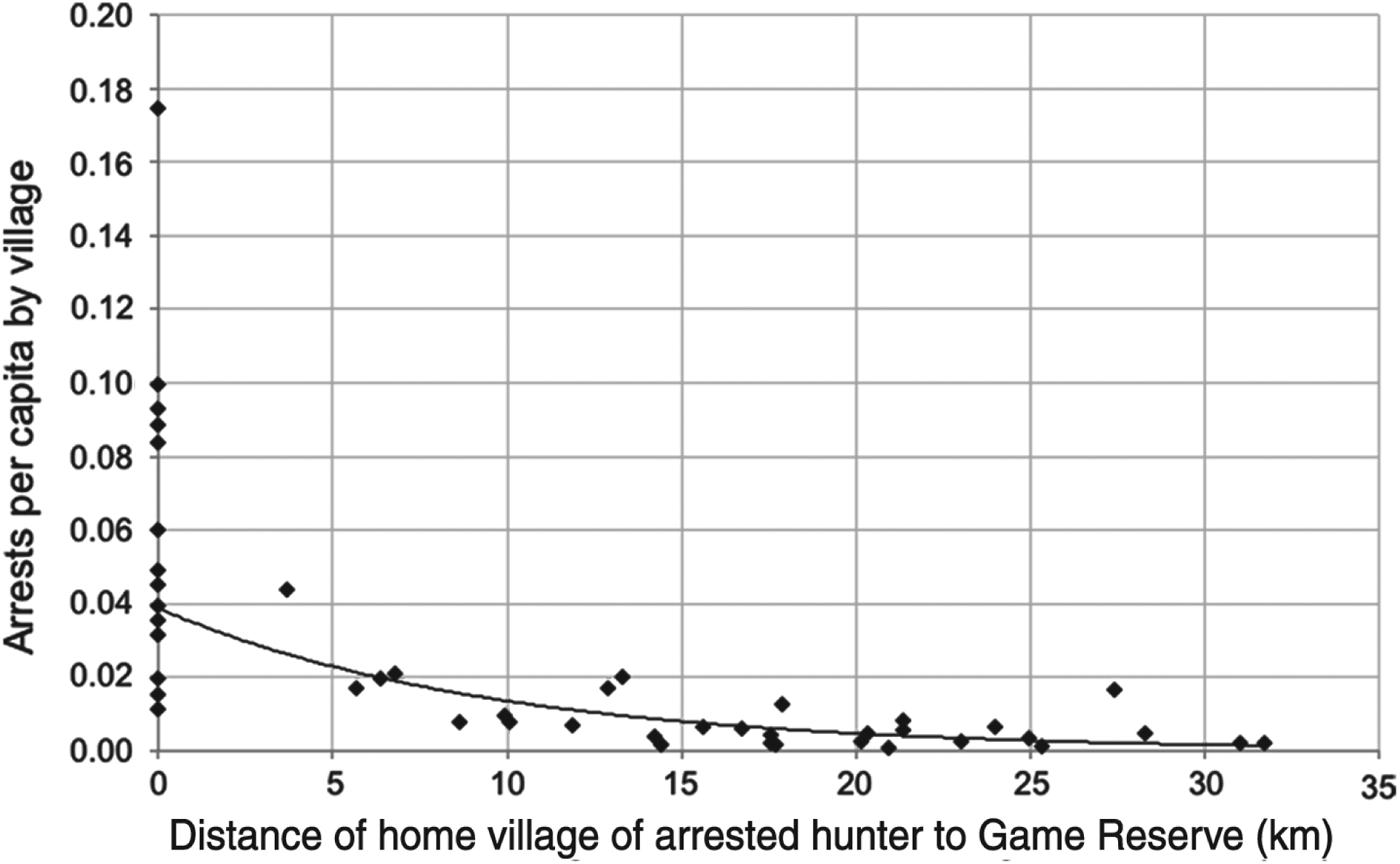
Fig. 2 Number of arrests of poachers per capita by village during 2004–2009, with distance from Ikorongo and Grumeti Game Reserves. A distance of 0 km indicates that villages are immediately adjacent to a Reserve.

Fig. 3 Relative proportions of wildlife species consumed in the eight study villages in the vicinity of Serengeti National Park (Fig. 1) during 2007–2008, with relative abundance estimated from aerial counts in Grumeti and Ikorongo Game Reserves in 2006 and 2007, and relative proportions of carcasses found by anti-poaching patrols in the National Park during 2006–2009. *See footnote, Table 3.
Table 3 Numbers of carcasses located during anti-poaching patrols in Maswa Game Reserve in 2004 (source: Friedkin Conservation Fund).

* Includes impala Aepyceros melampus, Grant's gazelle Nanger granti and Thomson's gazelle Eudorcas thomsonii
The estimated annual growth rate of the human population in the Mara Region (Bunda and Serengeti Districts) is 2.5% and that for Shinyanga Region (Magu, Bariadi and Meatu Districts) is 3.3%, indicating that in 2010 there were c. 600,000 people living immediately adjacent to the western boundary of Serengeti National Park (US Census Bureau, 2010). Based on these data and the quantity of bushmeat consumed per household per week, and assuming that the mean yield per wildebeest is 26.4 kg of meat (Campbell et al., Reference Campbell, Nelson and Loibooki2001), we estimate that communities living next to the protected areas in the north-west Serengeti consumed 63,488–87,344 wildebeest per year during 2007–2010, with a medium offtake estimate of 79,970 wildebeest per year (Table 4).
Table 4 Human population (based on population growth projections from US Census Bureau) and offtake of wildebeest in 2010, based on reported consumption of bushmeat by communities adjacent to protected areas in the western Serengeti.

Combining these estimates with those from the south-west (Table 4) we estimate the number of wildebeest killed for bushmeat across the entire Serengeti ecosystem is c. 119,662 per annum, based on the medium offtake scenario for 2007–2010 (Table 4). The minimum and maximum estimates are 97,796 and 140,615 per annum, respectively.
Discussion
Previous studies have shown that the communities immediately adjacent to Game Reserves in the north-west of the Serengeti had the easiest access to wildlife and thus the highest consumption of bushmeat in the area (Campbell & Hofer, Reference Campbell, Hofer, Sinclair and Arcese1995; Campbell et al., Reference Campbell, Nelson and Loibooki2001; Holmern et al., Reference Holmern, Mkama, Muya and Roskaft2006). Based on records of hunters operating within Ikorongo and Grumeti Game Reserves during 2003–2009 (Fig. 2) and village population size (Tanzania National Bureau of Statistics, 2002), we found that the majority of hunters originated from villages bordering the protected areas, with substantially fewer originating > 30 km away. Most bushmeat is sold and/or consumed within the hunter's home village (Campbell et al., Reference Campbell, Nelson and Loibooki2001; Loibooki et al., Reference Loibooki, Hofer, Campbell and East2002).
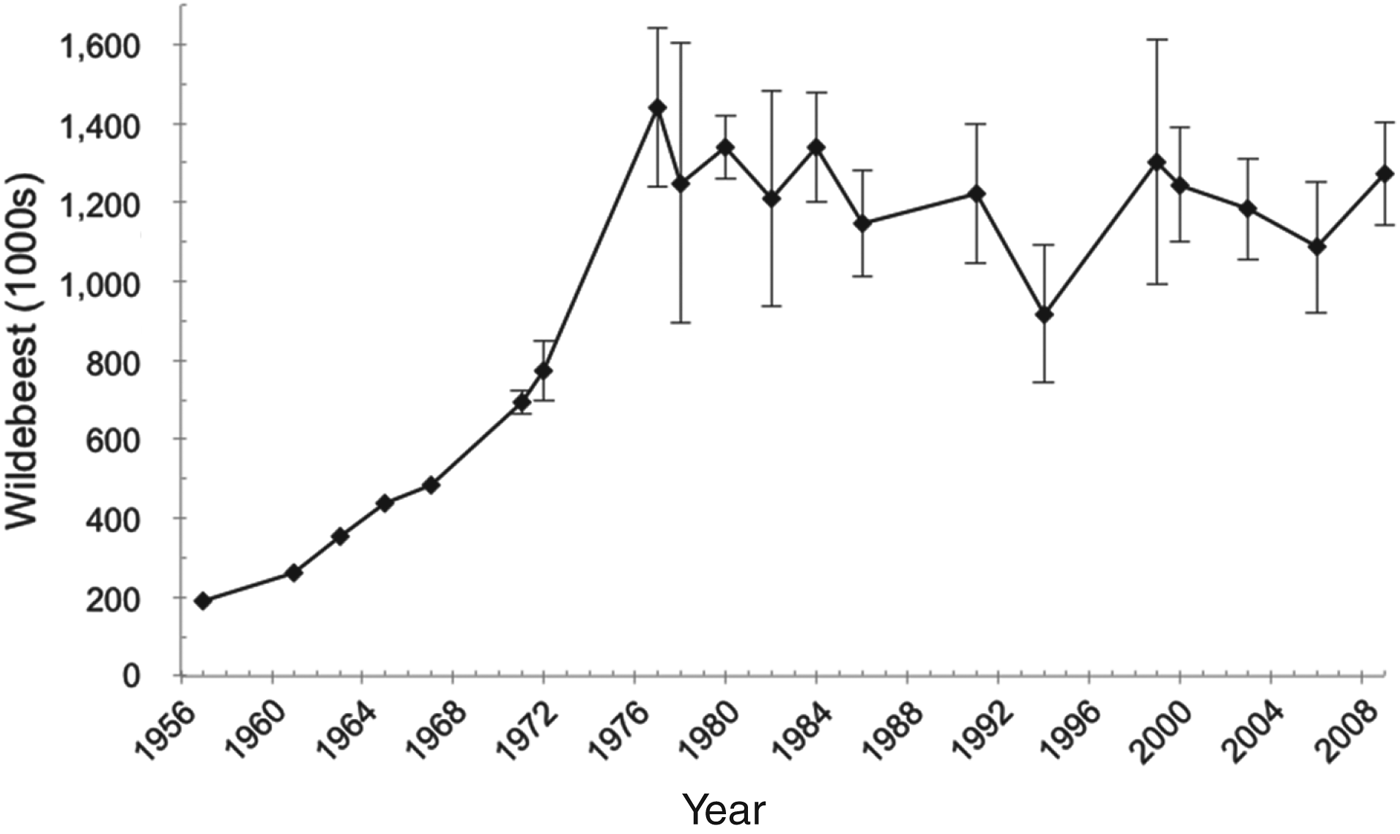
Our results suggest that bushmeat consumption in the Serengeti ecosystem is significantly higher than was previously inferred from population models (Mduma et al., Reference Mduma, Sinclair and Hilborn1999). We estimate that the wildebeest harvest for local bushmeat consumption probably exceeds 80,000 per year, which, based on the previous ecological model (Mduma et al., Reference Mduma, Sinclair and Hilborn1999), would cause the population to collapse. However, the 2009 wildebeest census data (Fig. 4) indicate that the population had remained reasonably stable during the previous 30 years. What could account for the difference between the population model and the consumption-based offtake assessment?

Fig. 4 Population estimates of wildebeest Connochaetes taurinus in the Serengeti ecosystem from aerial censuses conducted by Tanzania Wildlife Research Institute in collaboration with Frankfurt Zoological Society.
The ecological model is based on wildebeest recruitment data for 1992–1993, when the population was recovering from the effects of drought (Mduma et al., Reference Mduma, Sinclair and Hilborn1999) and the human population in the western Serengeti was c. 370,000, compared to nearly 600,000 in 2010 (U.S. Census Bureau, 2010). Although the levels of household consumption at that time are unknown, human population size inevitably affects the level of consumption of wildebeest. Relying solely on wildlife population trends to assess hunting offtake patterns ignores socio-economic drivers that may change through time. Climatic stress is also likely to affect rural communities, whose livelihoods typically depend on grazing and small-scale agriculture (Kaltenborn et al., Reference Kaltenborn, Nyahongo and Tingstad2005; Knapp, Reference Knapp2007). Hunting often becomes a fall-back livelihood when migratory wildlife competes with livestock for limited grazing lands and water sources (Barrett & Arcese, Reference Barrett and Arcese1998). Thus, the offtake may be higher during times of drought.
Offtake from hunting was previously assumed to affect equal proportions of male and female wildebeest (Pascual & Hilborn, Reference Pascual and Hilborn1995; Mduma et al., Reference Mduma, Sinclair and Hilborn1999). However, bachelor herds spend a greater proportion of their time in less desirable habitats than calving females and typically migrate through human-inhabited areas ahead of the females (Estes, Reference Estes1966; Fitzgibbon, Reference Fitzgibbon and Caro1998; Estes et al., Reference Estes, Raghunathan and Van Vleck2008), making them potentially more vulnerable to hunters (Campbell & Hofer, Reference Campbell, Hofer, Sinclair and Arcese1995). Offtake by bushmeat hunters in the Serengeti was significantly male-biased (3.5 : 1 male-to-female ratio), although the sample size (n = 18) was too low to draw definitive conclusions (Holmern et al., Reference Holmern, Mkama, Muya and Roskaft2006). At this offtake ratio our upper estimate of c. 140,000 wildebeest would reflect an annual harvest of c. 30,000 females, which is still below the upper limit of 40,000 females proposed by Mduma et al. (Reference Mduma, Sinclair and Hilborn1999) and in line with predictions by Campbell & Hofer (Reference Campbell, Hofer, Sinclair and Arcese1995) and Campbell et al. (Reference Campbell, Nelson and Loibooki2001). Note, however, that we made no attempt to estimate the extent of bushmeat consumption further away from the ecosystem boundaries.
These are the first estimates of wildebeest offtake that are based on direct measures of household consumption, and they are consistent with recent studies in the Mara Region, where levels of meat and fish intake exceed the national mean (Tanzania National Bureau of Statistics, 2010). Our enumerators were familiar to the study participants, which encouraged them to be open and honest about their consumption habits. Any initial trepidation was assuaged when the respondents saw that there were no negative effects from honestly reporting their bushmeat consumption. However, because bushmeat hunting is illegal, respondents might have denied eating bushmeat in the previous week, and therefore our weekly survey data probably underestimate overall bushmeat consumption in the western Serengeti.
The human population in the western Serengeti is predicted to reach 940,000 by 2050 (U.S. Census Bureau, 2010), with higher population pressure in communities adjacent to Serengeti National Park, which are growing by 3.5% per annum, in contrast to communities closer to Lake Victoria, which are growing by 2.5% per annum (Estes et al., Reference Estes, Kuemmerle, Kushnir, Radeloff and Shugart2012). Offtake of wildebeest cannot be sustainable as long as communities continue to grow at an exponential rate and the per capita demand for bushmeat remains at the current level, and therefore new strategies to address bushmeat hunting are needed to ensure persistence of the wildebeest population. Additionally, evidence from Serengeti and other systems indicate that meat consumption, especially bushmeat, increases with household expenditure (Brashares et al., Reference Brashares, Golden, Weinbaum, Barrett and Okello2011; Rentsch & Damon, Reference Rentsch and Damon2013).
Increasing human population pressure in East Africa will result in greater demand for livestock pasture, fertile agricultural land, and fish from Lake Victoria. Despite considerable investment in anti-poaching measures and efforts to improve detection of poachers (Thirgood et al., Reference Thirgood, Mlingwa, Gereta, Runyoro, Malpas, Laurenson, Borner, Sinclair, Packer, Mduma and Fryxell2008), the mean consumption of bushmeat is 2.2–2.8 meals per household per week. As local human populations continue to expand, the challenges of combating illegal hunting will also increase.
Acknowledgements
This study was carried out with permission from the Tanzanian Wildlife Research Institute and Tanzania National Parks and with the cooperation of communities in the study area. Funding was provided by Savannas Forever Tanzania, Rufford Small Grants for Nature Conservation, Frankfurt Zoological Society, the European Union's HUNT and CREATE projects, the Conservation Biology Programme and the Office of International Programmes of the University of Minnesota, Cleveland Metroparks Zoo, Columbus Zoo and Aquarium, the Lewis and Clark Fund for Exploration and Field Research, and the Grumeti Fund. We thank A. Lendii and M. Andimile for assistance with data collection, and Amy Damon, Anna Estes and the reviewers for their insights.
Biographical sketches
Dennis Rentsch has worked in Tanzania since 2004, where he is overseeing the implementation of several projects with co-funding support from the European Union and German Development Cooperation. These projects aim to engage local communities in the Serengeti Ecosystem in the conservation of wildlife and other natural resources, and to empower them to adopt conservation-compatible livelihoods. Craig Packer has conducted research in East Africa since 1972 and has worked in the Serengeti and Ngorongoro Crater since taking over the Serengeti Lion Project in 1978. He has served as a member of the Tanzanian delegation to CITES and founded an NGO to measure the effectiveness of foreign aid projects in rural Africa.


