INTRODUCTION
Anecdotally, household clustering of gastroenteritis cases is common and presumably usually relates either to a common exposure source or to secondary spread of infection within families. Many previous reports of household transmission of gastroenteritis focus on recognized outbreaks or on laboratory-confirmed cases of disease caused by a single pathogen [Reference Ethelberg1–Reference Werber11], approaches which tend to underestimate the total number of potentially linked cases at a household level. Since surveillance for gastroenteritis rarely detects small, intra-household outbreaks, there is minimal information on the frequency of case clustering, the predominant transmission mechanism, or the proportion for which a microbiological diagnosis is made.
The aim of this report is to describe the temporal clustering of gastrointestinal symptoms, the nature of the clusters, and the aetiological findings within household cases of gastroenteritis in a cohort of 600 families followed for 15 months.
METHODS
Six hundred households in Melbourne, Australia were enrolled into a community-based study assessing the relationship between drinking water quality and human health effects. The full methodology has been reported previously [Reference Hellard12], but in brief households consisted of at least four members comprising at least two children aged 1–15 years. Recruited households were supplied with either a real or sham water-treatment unit (WTU) fitted to their kitchen tap, and participants completed a weekly health diary for 15 months (68 weeks) which included information on the presence, duration and severity of any gastrointestinal symptoms. All participants were instructed to collect stool samples within 1 week of onset of gastroenteritis episodes during the study. The main study found no difference in rates of gastroenteritis or in pathogens in householders with a real or sham WTU.
Definitions
Participants were considered to have had an episode of highly credible gastroenteritis (HCG) if they had ⩾2 loose stools, ⩾2 episodes of vomiting, one loose stool plus abdominal pain or nausea or vomiting, or one episode of vomiting plus abdominal pain or nausea. Clusters inferred that more than one householder had HCG, and were defined as development of gastrointestinal symptoms in household members within 5 days of each other. Each cluster was considered to have ended if 5 days elapsed with no symptoms reported by any member of the household. Participants could appear in more than one cluster over the period of observation. Sporadic HCG was defined as cases of HCG that occurred outside of a cluster.
Transmission within clusters was considered to be simultaneous, indeterminate or secondary. Simultaneous transmission was defined as ⩾2 people within a cluster reporting symptom onset within a 48-h period. Secondary transmission was defined as ⩾1 householders with symptom onset >4 days (96 h) from the first day of symptoms of another household case, but within 5 days of the last day of symptoms of any other case in the cluster. Indeterminate transmission was defined as one or more members of the household reporting symptoms >48 h but <96 h after another case.
Faecal specimen analysis
Faecal specimens were examined for rotavirus, adenovirus, norovirus, pathogenic E. coli, Giardia spp., and Cryptosporidium spp. Samples were also cultured for Salmonella spp., Shigella spp., Campylobacter spp., Vibrio spp., Yersinia spp., Aeromonas spp., Plesiomonas spp., and Clostridium difficile. Details of faecal specimen testing have been published previously [Reference Sinclair13].
Data analysis
The data were entered into a Microsoft Access database (Microsoft Corporation, USA) and were analysed using Stata version 10.1 (StataCorp, USA). All statistical tests, estimates and confidence intervals took the clustered family design and repeated measures of individuals into account. The methods used depended on context, and included generalized estimating equations (GEE) with robust variance for regression situations (linear, binary, ordinary and zero-truncated Poisson, and multinomial logit regression), and cluster-corrected (design-based) F tests for cross-tabulations. These are indicated in the text and/or table notes. Two-sided P values ⩽0·05 were considered statistically significant.
RESULTS
In total there were 600 households included in the study, consisting of 2811 participants. A total of 173 298 person-weeks of health diary data were recorded out of a possible 191 148 (91%). Of the 2811 participants, 1440 were male and 1371 were female (51·2% and 48·8%, respectively). There were 648 (23%) participants aged <6 years, 945 (34%) aged between 6 and 16 years, and 1218 (43%) were ⩾17 years.
There were 2669 cases of HCG during the study (0·80 cases/person per year), 1121 (42%) episodes of which were part of a cluster, and 1548 cases (58%) of which were sporadic. There was a total of 426 clusters involving ⩾2 household members with HCG, and these were distributed over 258 (43%) of the households. The total number of people resident in the 258 affected households was 1232, of whom 774 (63%) were involved in ⩾1 clusters. The mean number of clusters per household in those that recorded at least one cluster was 2·0 (median 1·5), and the maximum number of clusters within a household was 8. The minimum number of people within a cluster was 2, and the maximum was 5 (mean 2·5, median 2). There was no evidence of a correlation between the number of household members and the number of people involved in the cluster (P=0·42).
The mean age for those in at least one cluster was 15·7 years (median 8 years), compared to a mean of 21·3 (median 14 years) for those not in an HCG cluster (P<0·001). Those in a cluster were more likely to be aged <6 years (OR 2·7, 95% CI 2·3–3·3, P<0·001) and to be attending child care/kindergarten (OR 2·6, 95% CI 2·0–3·2, P<0·001) (Table 1). For participants involved in at least one cluster, HCG symptoms were recorded on a mean of 2·4 days per person (range 1–28 days, median 2 days), and those reporting HCG events outside of a cluster (i.e. sporadic HCG) also recorded symptoms for a mean of 2·4 days (range 1–113 days, median 1 day). This difference was not statistically significant (P=0·86).
Table 1. Demographics of the individuals not in versus in a highly credible gastroenteritis (HCG) cluster
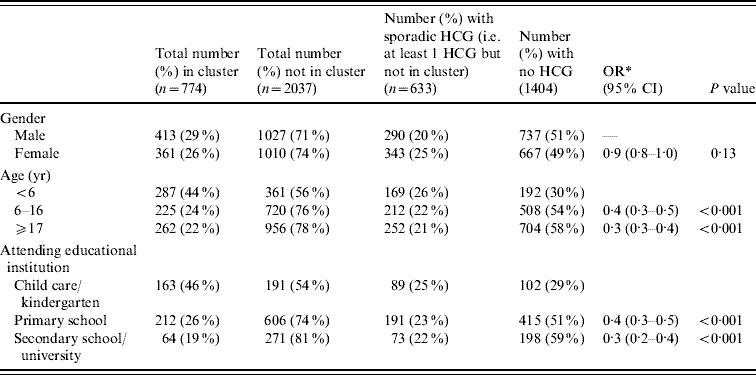
OR, Odds ratio; CI, confidence interval.
* OR comparing being in a cluster vs. not being in a cluster, using GEE binary regression.
Simultaneous transmission took place within 189 (44%) of the clusters, indeterminate transmission took place within 163 (38%), and secondary transmission occurred in 184 (43%) of the identified clusters. (For clusters involving more than two people, more than one type of transmission could take place within a cluster.) Figure 1 gives an indication of the relative frequency of the number of days between symptom onset in the first case in the household and any subsequent cases. There was no significant association between number of people in the household and transmission type (P=0·58, P=0·31, P=0·51, for simultaneous, secondary and indeterminate, respectively). Females were more likely than males to be involved in clusters of simultaneous transmission (OR 1·4, 95% CI 1·1–1·7, P=0·003), and people aged >16 years were more likely to be involved in clusters of presumed secondary transmission (OR 1·3, 95% CI 1·1–1·7, P=0·01).
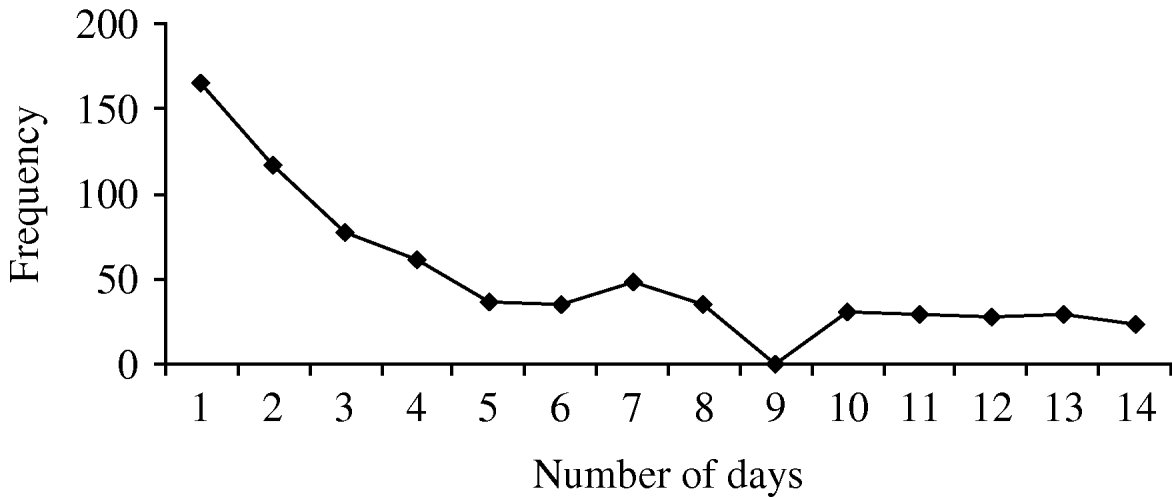
Fig. 1. Frequency of number of days between first case in household and subsequent cases. If more than one household member experienced symptoms on the same day in relation to the first household case, the subsequent simultaneous cases are counted once only in this graph.
Faecal specimens and pathogens within clusters
Of the 774 individuals with HCG included in a cluster, 223 (29%) individuals gave ⩾1 specimens. At least one specimen was submitted in 162 (38%) of the 426 clusters, with about half (77 clusters) having only one household member submit a specimen, and half (85 clusters) having ⩾2 members submit a specimen. The probability of a family submitting at least one specimen during a cluster was significantly related to the proportion of household members affected (P=0·044) and marginally with the duration of the HCG cluster (P=0·057), but not with the number of affected children aged <6 years (P=0·13) or gender (P=0·52) (Table 2).
Table 2. Household characteristics and faecal specimen submission for the 426 households involved in a cluster
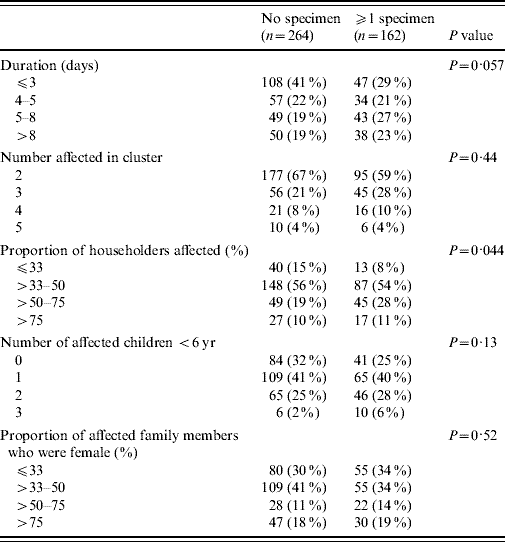
P values obtained by cluster-corrected F tests.
At least one pathogen was detected in 59 clusters, but in only 18 clusters was there more than one specimen positive for a pathogen(s) (Fig. 2). In clusters where multiple household members submitted a specimen, concordance was 16/85 (18·8%), and in clusters with at least one identified pathogen, concordance was 16/38 (42%). There were two clusters where the submitted specimens returned discordant results.
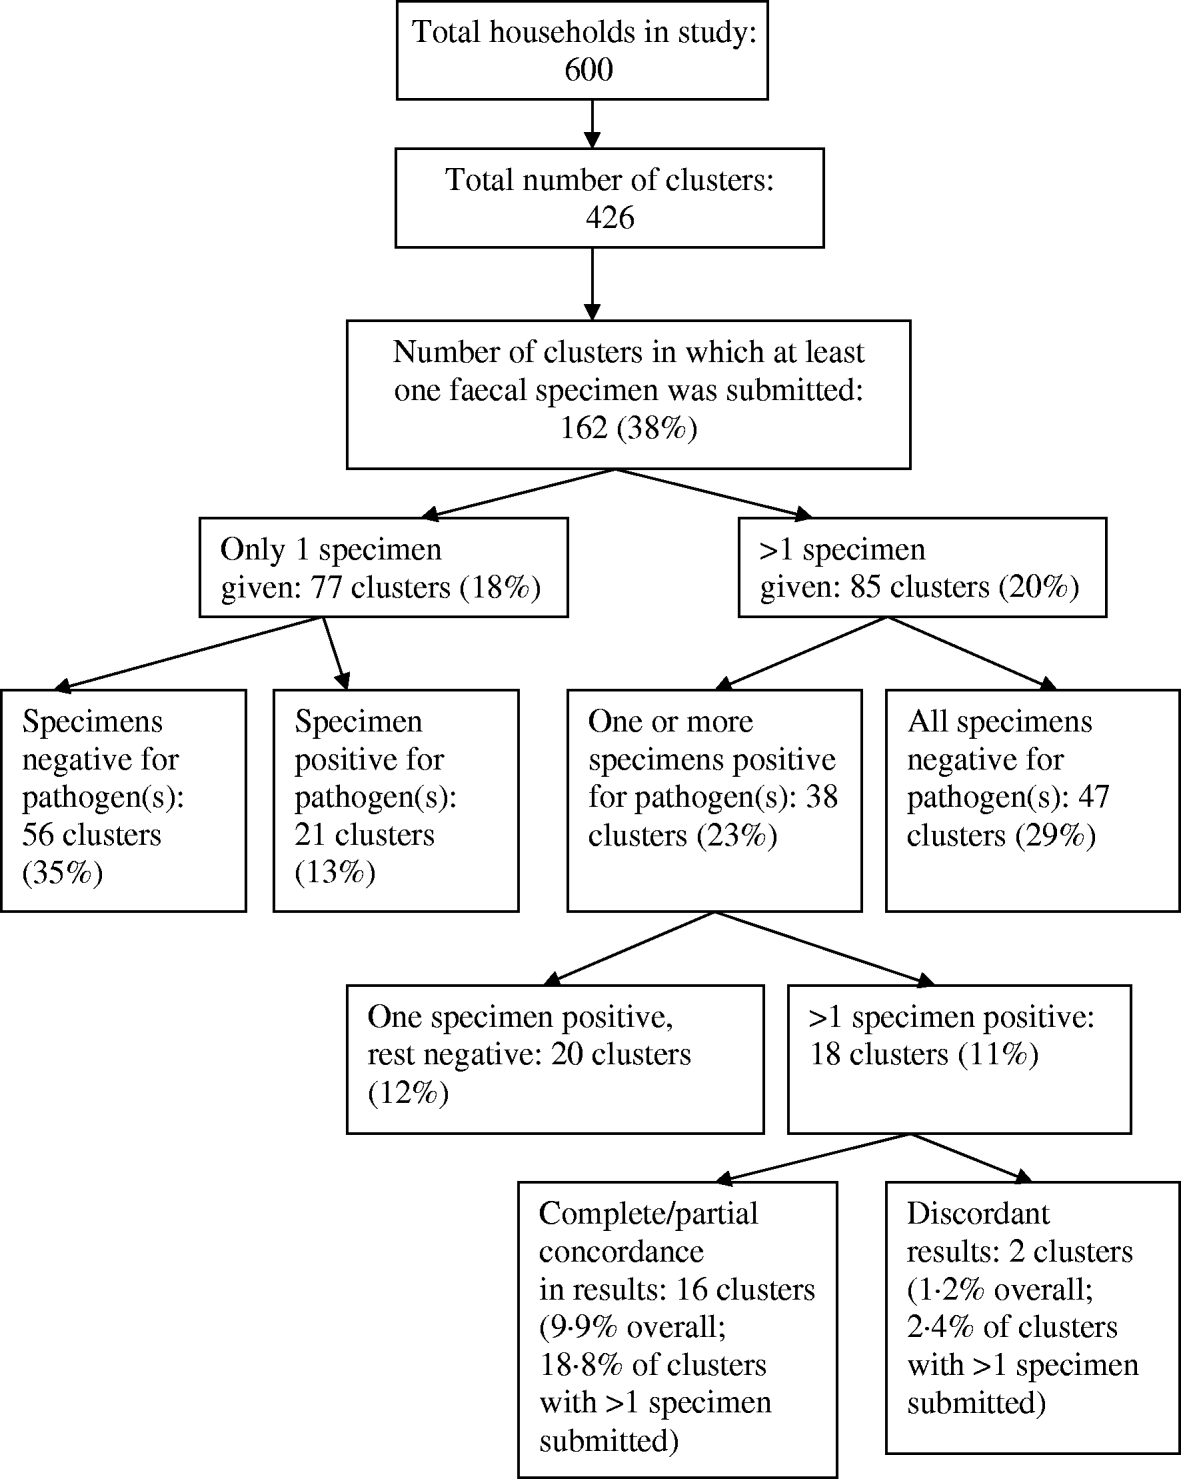
Fig. 2. Distribution of positive specimens within clusters.
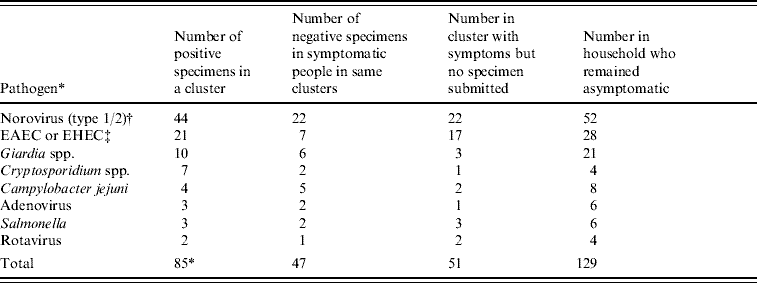
Eight different pathogens were detected from samples submitted by people who were part of a cluster. The most common pathogens were norovirus (44) and enteroaggregative E. coli (EAEC) or enterohaemor rhagic E. coli (EHEC) (21), followed by Giardia spp. (10), Cryptosporidium spp. (7), Campylobacter spp. (4), Salmonella spp. (3), adenovirus (3) and rotavirus (2). Table 3 shows the number of cases for whom a pathogen was detected in relation to undiagnosed cases who were symptomatic at the same time and in relation to the number of people in the household at the time of a cluster who remained asymptomatic. It appears that during clusters, between a quarter and a third of household members tested positive for a pathogen, one third were symptomatic but remained undiagnosed, while 40% remained unaffected by symptoms. This appeared to be the case irrespective of which pathogen was identified, although the small number of cases for each limits the statistical power to assess this. The type of transmission also appeared unaffected by pathogen type (data not shown).
Table 3. Distribution of pathogens within clusters
EAEC, Enteroaggregative E. coli, EHEC, enterohaemorrhagic E. coli.
* Eight specimens were positive for >1 pathogen.
† For all clusters containing >1 specimen with norovirus, the same norovirus group was found in all specimens.
‡ For all clusters containing >1 specimen of EAEC or EHEC, the same group was found in clustered specimens but full typing information was not available.
DISCUSSION
This paper examines household clusters of HCG in 600 households completing health diaries over a 15-month period. In contrast to previous reports of family clustering of gastrointestinal symptoms stemming from recognized outbreaks or laboratory surveillance data, this prospective observational study is more likely to accurately reflect levels of community-based clustering of gastrointestinal symptoms. Clusters of HCG were common, with 43% of households reporting a cluster over a 15-month period, and more than one cluster often reported (mean 2). The reach of illness into the household was extensive, with 63% of household members affected by symptoms during clusters. The main demographic features associated with presence in a cluster of gastroenteritis were age <6 years and attending child care or kindergarten, which reinforces previous research [Reference Gotz6, Reference Parry and Salmon10, Reference Werber11, Reference Thompson14–Reference Wilson19].
Clustering of gastrointestinal symptoms within families can be due either to common exposure, secondary spread, or due to simultaneous occurrence of unrelated sporadic cases in households. Using some assumptions (common sporadic HCG rate of 0·0089/person per week, 4 persons per family, follow-up period of 68 weeks, and independent occurrence of sporadic HCG), the effect of the latter can be estimated, with probability calculations indicating that an expected 18·9 families out of the 600 would have an apparent cluster of HCG that is due to independent sporadic events. This number is small compared to the observed number of 258 families with clusters, which indicates that any misclassification would have little impact. It is also possible that some identified clusters resulted from a cluster of reporting rather than a cluster of symptoms, although the magnitude and effect of any existing reporting bias is impossible to ascertain.
Both HCG and clusters have been variably defined in other studies. Gastroenteritis is defined in some studies as three episodes of diarrhoea within a 24-h period, whereas we used a somewhat less stringent definition. Additionally, our definition of a cluster required symptoms of HCG in more than one household member within 5 days of each other, which was based on the probable incubation and infective periods for many organisms causing gastroenteritis. If the definition of a cluster had been relaxed to be within 14 days of each other, the frequency of the number of days between the first case in the household and subsequent cases would be as shown in Figure 1. Using our specified cut-off definitions of 48 h and 4 days (96 h) to delineate between likely simultaneous vs. secondary transmission, we estimated that simultaneous transmission took place in 44% of clusters and secondary transmission in 43% of identified clusters. However, the incubation periods and periods of communicability vary significantly for different pathogens. For example, the incubation period for most viral gastroenteritis and for salmonellosis is usually between 6 h and 24 h, whereas for giardiasis this may be 10–21 days [Reference Heymann20]. The periods of communicability range from a few days for many viruses, up to many months for salmonellosis, cryptosporidiosis and giardiasis [Reference Heymann20]. Thus studies examining gastrointestinal symptoms caused by a range of pathogens cannot definitively exclude or prove linkage of cases on the basis of time clustering alone nor differentiate between different transmission modes with certainty, particularly in the absence of an identified pathogen. Nevertheless, the cut-off definitions we used are relevant for the commonest pathogens we detected (e.g. norovirus and pathogenic E. coli) and have some precedent from other studies [Reference Werber11, Reference Perry18].
Estimated secondary attack rates for gastroenteritis vary according to the transmission characteristics of the pathogen(s) involved, individual hygiene practices, age profile of householders, number of close contacts, search strategies employed to identify secondary cases, and definitions used to differentiate transmission types. A Canadian survey of people with gastrointestinal symptoms found that, in 35% of households, more than one resident was affected [Reference Sargeant, Majowicz and Snelgrove21]. A study of all-cause gastroenteritis in householders in California found a secondary attack rate of 9%, with most household transmission occurring within a median of 4 days [Reference Perry18]. A study in children involved in day-care outbreaks of gastroenteritis found an overall secondary attack rate of 11% in family members [Reference Pickering8]. A Danish study also found pronounced household clustering in up to 10% of culture-confirmed cases of bacterial gastroenteritis [Reference Ethelberg1]. In that study, clustering was most pronounced within a median of 6 days, but the time separating recorded infection dates varied according to the specific organism. Reported secondary attack rates for specific pathogens in household contacts include 19–43% for Cryptosporidium parvum [Reference Newman2, Reference Perera and Lucas3], 19–32% for norovirus [Reference Baron4–Reference Gotz6], 26–27% for shigellosis [Reference Khan7, Reference Pickering8], 17% for Giardia [Reference Pickering8], 15% for Campylobacter jejuni [Reference Oosterom9], and 8–15% for toxigenic E. coli [Reference Parry and Salmon10, Reference Werber11]. Intra-familial clustering suggestive of person-to-person spread has also been observed with other organisms, including Helicobacter pylori [Reference Drumm22–Reference Roma-Giannikou27], rotavirus [Reference Pickering8, Reference Rodriguez28] and adenovirus [Reference Ruuskanen, Mertsola and Meurman29].
Many reports of gastroenteritis clustering rely on detection of pathogen(s) in a faecal specimen. In our study, householders voluntarily agreed to participate and indicated significant motivation to comply with study requirements by persisting with longitudinal symptom reporting. However, despite the fact that participants were strongly encouraged to supply a specimen whenever they experienced symptoms, only 223/774 people (29%) who reported symptoms as part of a cluster submitted a faecal specimen. The greater the proportion of householders affected, the greater the chances that faecal specimens were submitted. In only 20% of clusters did more than one member submit a specimen, and even in clusters where a number of specimens were submitted, there were only 18 clusters (4·2%) with more than one specimen positive for pathogen(s). Negative faecal tests can be result from poor sensitivity of diagnostic tests, delays in submission of specimens, or actual absence of pathogens. Overall, only 79/223 submitted specimens (35%) revealed a pathogen(s). Although the laboratory methods used reflect normal diagnostic practice, the lack of DNA-based virology (other than for norovirus) may have contributed to the low rate of pathogen detection. The results shown for the contribution of different pathogens to the burden of household HCG clusters should therefore be interpreted with some caution and may not be generalizable.
In clusters where a pathogen was detected in >1 specimen, there was a high degree of concordance in the identified pathogen(s), with only two instances of complete inconsistency. However, overall concordance in laboratory-confirmed pathogens from clusters where >1 specimen was submitted was only 18·8%, which highlights that surveillance which relies on pathogen notification data to indicate clustering is likely to substantially underestimate the true number of cases of involved. If an assumption is made that most cases of HCG within a cluster are likely to be caused by the same pathogen, it would appear that for every laboratory-confirmed case in a cluster, there is on average about one other case with no specimen submitted and/or no pathogen identified. Although there may be limitations to the generalizability of these findings, the estimated degree of under-diagnosis of pathogens that occurred during clustered cases of gastroenteritis gives some indication of the degree of under-reporting of notifiable pathogens that is likely to occur as part of community surveillance.
Key strengths of this study are that it provides a description of gastroenteritis symptoms within households involved in a prospective longitudinal community-based study. This is likely to provide more reliable information regarding the frequency of illness clustering in households than data obtained from outbreak investigations or from laboratory notification data. Potential limitations of our study include the possibility that some symptoms were misclassified and were not due to infectious gastroenteritis. Moreover, this study was done in an entirely urban cohort of people in Melbourne, with all participants considered to be of moderate-to-high socioeconomic standing. Therefore the findings may not be generalizable to rural or more deprived areas, or to locations with greater household crowding or poorer sanitary conditions. There may have been some bias introduced if a lower threshold for reporting symptoms existed when more than one family member was unwell, thereby resulting in an overestimation of household clustering. Finally, no DNA fingerprinting of detected pathogens was performed to prove whether isolates found of the same species were identical. However, given the small number of clusters where more than one positive specimen was detected, this is unlikely to have significant influence on our descriptive findings.
In summary, we have reported on the frequency, presumed mechanism, and microbiological findings of clustered cases of gastroenteritis detected in 600 families observed for 15 months. During clusters, just under one third of householders tested positive for a faecal pathogen, one third were symptomatic but remained undiagnosed, and the remainder were asymptomatic. Our findings confirm that clustering of symptoms is common and that reliance on microbiological confirmation will underestimate cases compared to symptom reporting.
ACKNOWLEDGEMENTS
We acknowledge and thank all members of the Water Quality Study team who collected data for this study. We are also grateful to all community members who voluntarily participated in this research. Additionally, we acknowledge the Cooperative Research Center for Water Quality and Treatment, the Water Services Association of Australia, the Victorian Department of Human Services, Melbourne Water Corporation, South East Water Limited, Yarra Valley Water Limited and City West Water Limited who supported the study. Finally, thanks to the Victorian Public Health Training Scheme for allowing author D.W. to work on this study. Financial support for the study (known as the Melbourne Water Quality Study) was received from the Cooperative Research Center (CRC) for Water Quality and Treatment, the Water Services Association of Australia, the Victorian Department of Human Services, Melbourne Water Corporation, South East Water Limited, Yarra Valley Water Limited and City West Water Limited.
DECLARATION OF INTEREST
None.


