Introduction
The heat- and mass-balance cycles of sea ice are strongly influenced by the input and spatio-temporal partitioning of shortwave radiation, particularly during the summer melt season. the partitioning is in turn directly modulated by seasonal variations in the inherent optical properties of the ice and snow and by a range of melt and freeze processes that affect the structure of the surface and interior of the ice. this gives rise to a group of feedback processes between the ice and the incident solar radiation that acts to accelerate the intensity of the summer melt, influence the length of the melt season, and modulate the onset rate of fall freeze-up.
To date, this collection of processes has been considered primarily in terms of changes in the surface albedo and has been referred to as ‘ice–albedo feedback’. the surface albedos range from spatially uniform high values during the cold season, when the ice is snow-covered, to uniformly lower values with large spatial variations during the summer melt season. an accurate representation in global climate models and large-scale energy-balance models of the processes involved is critical for describing how the annual ice cycle will respond to climate changes.
Recent results (Reference Perovich, Cota, Maykut and GrenfellPerovich and others, 2002; light and others, unpublished information) have reported a detailed analysis of the variations in surface albedo during the summer melt season for both first-year (FY) and multi-year (MY) sea ice. one striking result was the realization that the albedo for bare melting MY ice is nearly constant throughout the melt season because the surface scattering layer maintains about the same thickness and structure throughout the summer. since the albedo of open water is also well known and quite stable (Reference Pegau and PaulsonPegau and paulson, 2001), the general problem reduces to specifying the evolution and areal coverage of melt ponds. to this end, Reference Eicken, Grenfell, Perovich, Richter-Menge and FreyEicken and others (2004) have formulated a model for melt-pond albedo evolution based directly on the physics of the ice.
The corollary question with regard to the partitioning of solar radiation is how much is absorbed within the ice and how much is transmitted to the upper ocean. this requires knowledge of the spectral extinction coefficients of the ice. observations of these optical properties of both FY and MY sea ice have been reported (Reference Grenfell and MaykutGrenfell and maykut, 1977 (hereafter GM77); Reference Perovich and GrenfellPerovich and others, 1993). they are primarily based on total transmittance, and although they are consistent with values of radiation attenuation from thermal balance (untersteiner, 1961; perovich and Reference GrenfellGrenfell, 1981), the depth dependence of the optical properties had to be inferred from models rather than measured directly. in this paper, we present the results of direct observations of the irradiance profiles within the ice using improved high-resolution spectrophotometric instruments.
Instruments and Methods
During the SHEBA (surface heat budget of the arctic ocean) field experiment and later in the coastal sea-ice zone near barrow, alaska, USA, we measured spectral transmission over the course of the melt season. the advent of new sensors with significantly improved sensitivity, spectral resolution, reliability and recording speed has made possible greatly improved measurements of the apparent optical properties of sea ice from which the spectral irradiance attenuation or extinction coefficients can be determined. improvements in optical fiber technology have made in-ice observations of the solar radiation much more efficient and substantially more accurate.
We present the results of transmission profile measurements carried out at a variety of sites including drained bare ice and melt-pond covered ice for both FY and MY ice. during the course of these observations, three separate spectrophotometers were used, a spectron engineering se 590, an analytical spectral devices dual channel instrument and an ocean optics s2000. these instruments covered the wavelength range 400–1000nm and were equipped with 10m optical fibers with irradiance receptors, whose deployment is shown schematically in figure 1.
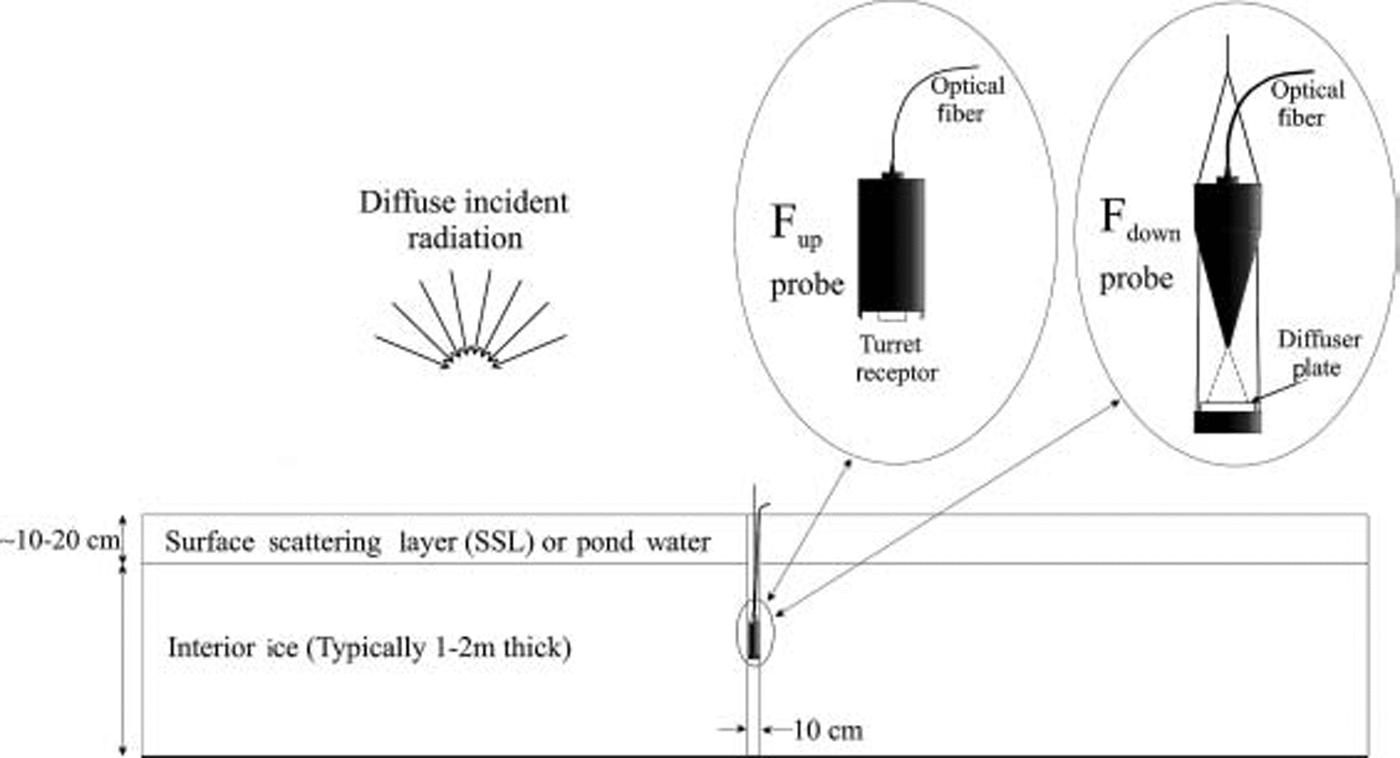
Fig. 1. Experimental configuration for profile observations. The up-or downwelling irradiance receptor probe was connected to the spectrophotometer by a 10 m long optical fiber. For each profile, the probe was lowered in 0.05–0.10m increments down the hole to record irradiance vs depth.
Because of the strong attenuation of red and infrared radiation by snow and ice, the solar infrared radiation is almost completely absorbed in the uppermost 0.10–0.2m of the ice or by the water in the melt ponds. the spectral range of interest was thus limited to about 400–750 nm, which was well within the range of the instruments. the spectral resolution was typically 2–4 nm.
Vertical profiles of upwelling and downwelling irradiance within the ice were measured at intervals of approximately 0.1 m using an upward-looking receptor and a downward-looking receptor guided with a metal arm. both probes could be used in a water-filled hole so that refraction effects at the lateral boundaries were negligible. the upward-looking profiler consisted of an optical fiber probe aimed at a diffusely reflecting spectralon target. the probe was designed to block the 15˚ central cone to avoid recording light coming directly down the borehole. for incidence angles of 15–80˚, the directional sensitivity was within a few percent of a cosine response. interpretation of observations of this type was carried out using a two-dimensional cylindrical radiative transfer model (Reference Light, Maykut and GrenfellLight and others, 2003) to include the effects of the borehole and the presence of the detector. these calculations showed that below the surface scattering layer and for conditions of diffuse incident radiation, the depth gradients of the vertical irradiance profiles should be observationally indistinguishable from those of the undisturbed ice. thus we determine the extinction coefficients, Kλ , at each wavelength using the following finite-difference equation:
Where z is the depth below the upper surface of the ice, Fλ is the depth-dependent irradiance and the Δ in both the numerator and the denominator represents the central difference at z (i.e. Δz = (z + dz) - (z = dz) where dz is a small increment in z, and ΔF = F(z + dz) - F(z = dz)), and where we have considered depth ranges for which the profile is locally exponential. accurate results are thus obtained as long as the gradient is correct, even though the absolute light levels may be modified by the presence of the borehole and the detector. for each profile, variations in the incident radiation were monitored to correct the profile for drift. in some cases, a distinct exponential zone was difficult to determine and a graphical best-fit averaged value was used. errors in the derived extinction coefficients arise from uncertainties in this fitting procedure coupled with real site-to-site variations in the inherent optical properties of a given ice type.
To avoid the effects of the surface scattering layer and to insure that the probe was deep enough in the ice to maintain proper orientation, results of profile data from depths of 0.3–0.9 m are reported here. the mixture of ponds and drained ice in the summer pack also gives rise to strong lateral inhomogeneities and resultant three-dimensional (3-d) radiative transfer effects that are not included in the present analysis. the lower depth limit of 0.9m was chosen to minimize the influence of these 3-d effects. our criterion was that the distance to the nearest pond/drained ice boundary should be at least three times the probe depth. to avoid complications associated with the presence of a direct solar beam, including changes in solar elevation and collimated vs diffuse radiation fields, observations were carried out only under overcast conditions.
Sites were selected in pairs including a melt pond and an adjacent bare ice area. a single borehole was drilled at each site to minimize disturbance of the ice, and new sites were selected on subsequent days because meltwater drainage in an existing hole also modified the local ice conditions. here we distinguish among four summer ice types: ponded and drained surfaces for both FY and MY ice. all observations were carried out after the snow cover had melted away.
Results
The melt season during SHEBA ran from about 1 june through about the third week in august. the 2002 melt season at barrow ran from mid-may through early july; however, observations were terminated in late june when the ice decay was sufficiently advanced that deployment on the ice became unsafe. the coastal ice pack broke up and disappeared about a week afterwards.
The temporal distribution in the extinction coefficients is shown in figure 2, which presents values at a wavelength of 600nm spanning the two melt seasons. although temporal variations are present in the data, the experimental uncertainties are sufficiently large and the number of sites small enough that there is not a clear trend. in fact, much of the variability can probably be ascribed to actual spatial variations. as a practical limitation, we could not make meaningful measurements repeatedly at individual sites since the borehole caused brine or meltwater drainage that anomalously altered the ice characteristics. accordingly, we have assumed for the present analysis that all the results from a given ice type throughout the melt season can be averaged together to obtain a ‘summer-melt’ value for that category. there were indications that this is not true during the early stages of the melt season, but we consider here only the sites observed once the melt was well established. a detailed description of the full set of apparent and inherent optical properties of the individual sites is in preparation (light and others, unpublished information).
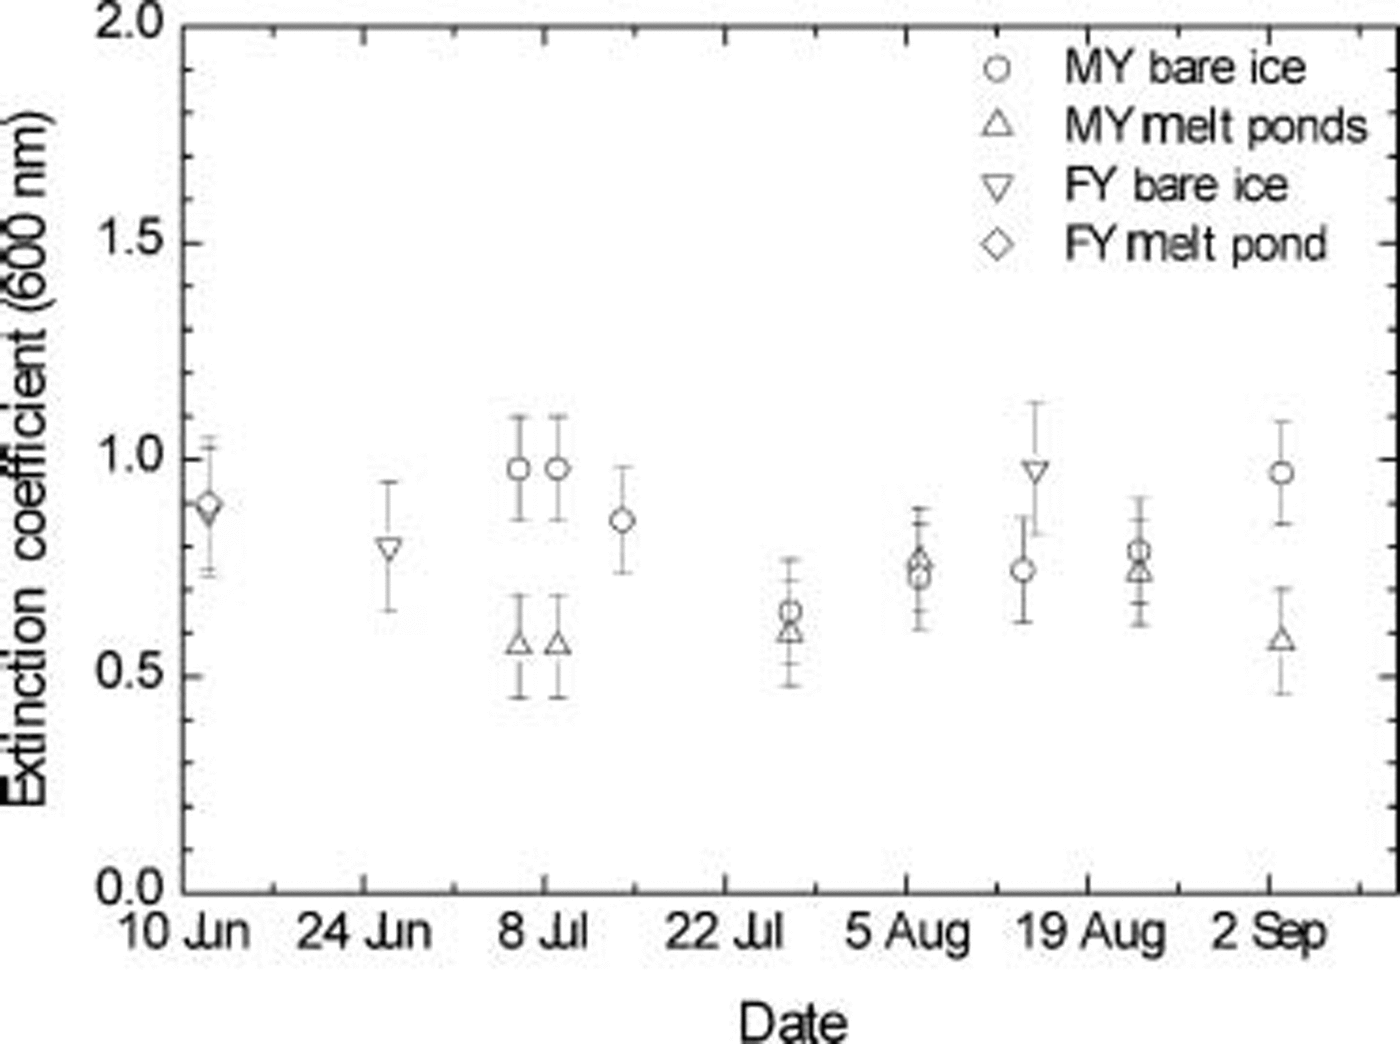
Fig. 2. Extinction coefficient at 600 nm for the various sites vs date of observation. The results for FY ice from Barrow were carried out from 3 to 12 June and are assigned a date of 12 June. All other observations were from the SHEBA site.
At 600 nm, the bare MY ice had a slightly higher extinction than did the corresponding ponded ice, although this was not true for the FY ice. possible reasons for this are explored below. the Kλ results over the full visible spectrum for the four categories are shown in figures 3 and 4. the present values for MY ice for ponds and bare ice are approximately the same to within the limits of the error estimates. the minima lie between 450 and 500 nm, with values of 0.58 m–1 for bare ice and 0.54 m–1 for melt ponds, with uncertainties of as much as 0.15 m–1.

Fig. 3. Average spectral extinction coefficients for bare (a) and pond-covered (b) MY ice from SHEBA (solid lines). Shown for comparison are previous results from Fletcher’s Ice Island (T-3) reported by GM77.
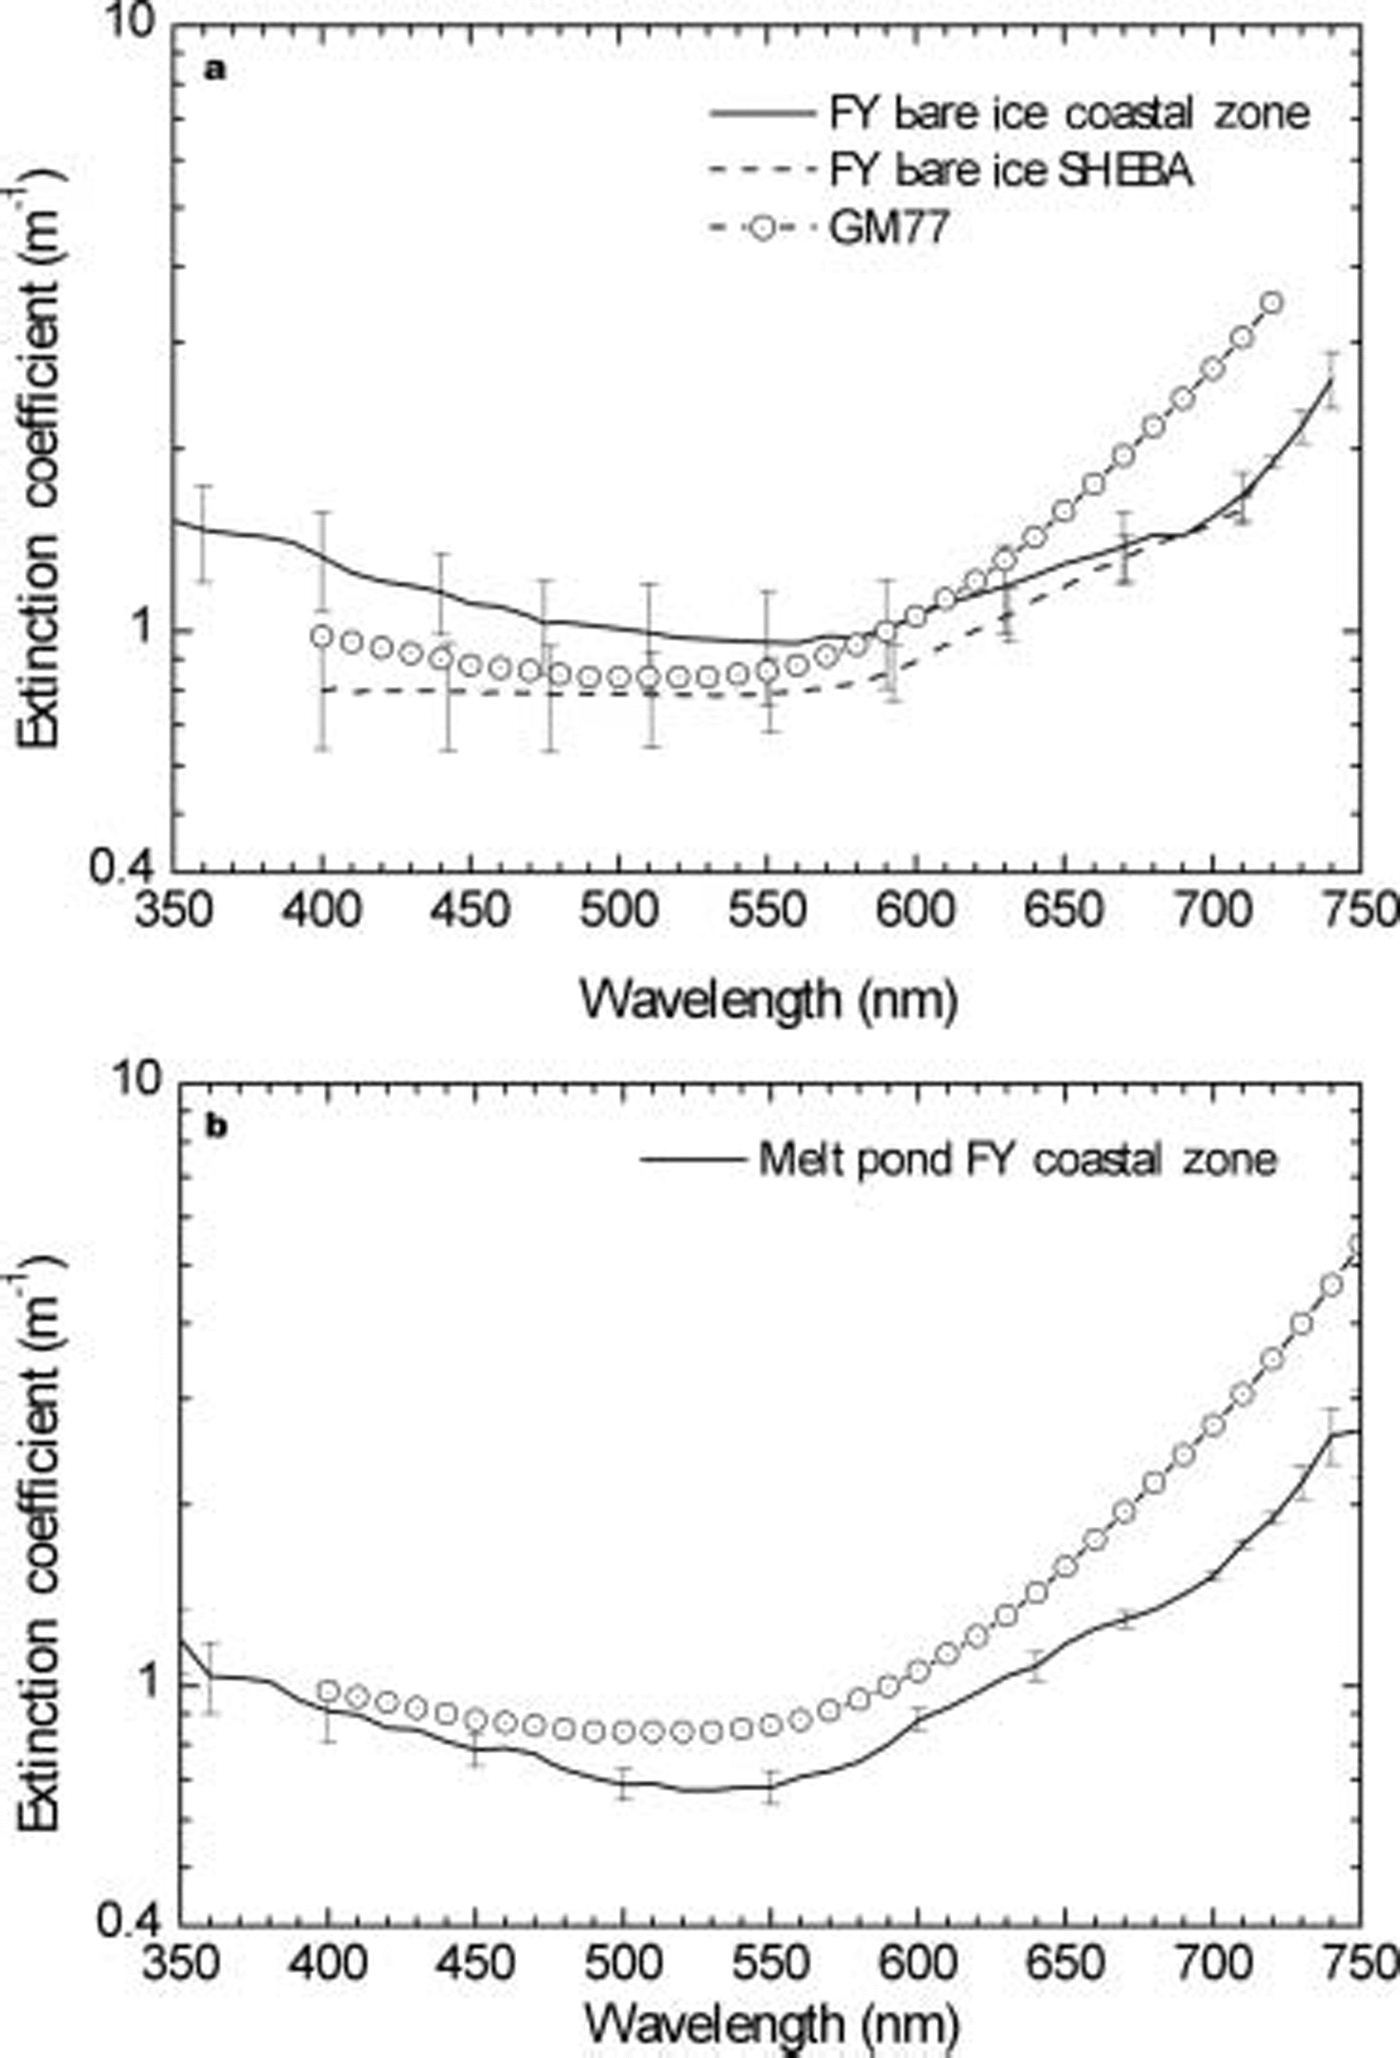
Fig. 4. Average spectral extinction coefficients for drained bare (a) and ponded (b) FY ice from Barrow and SHEBA.
The spectral dependence is nearly constant from 400 to 500 nm, indicating that there was not a strong influence from foreign inclusions such as colored dissolved organic material (CDOM) or suspended particulate material (SPM) and that ice was relatively clean in the upper 0.9 m or so for the cases considered. included in figures 3 and 4 for comparison are previously reported extinction coefficients from observations at fletcher’s ice island (t-3) by GM77. it is apparent that the present values of Kλ for MY ice lie significantly below the GM77 values, although their ‘old melt pond’ results are nearly as low. the spectral dependence in both cases is consistent.
Although the differences in magnitude may be due to real variations in ice structure, the GM77 results were based primarily on optical observations above and below the ice (albedo and total transmission) in conjunction with visual estimation of the layer structure of the ice from ice cores. a simplified two-stream radiative transfer model was used to isolate the interior ice. as a result, the values of Kλ below the near-surface layers are very sensitive to the precision of the visual characterization, particularly for the bare ice, and it is difficult at this stage to assess the relative contributions of actual structural differences and observational uncertainties.
For the FY ice cases (fig. 4), the present results fall in a range comparable to the GM77 values between 400 and 650 nm, with the melt ponds showing a slightly lower extinction than the bare ice. at longer wavelengths the GM77 observations suffered from degraded spectral resolution and relied on a deconvolution process that may have overestimated the extinction coefficients. for the present data, the spectral dependence of Kλ shows a minimum between 525 and 550 nm, particularly for the coastal observations. this minimum is weaker for the SHEBA FY cases than for the coastal-zone bare ice, where it is well defined and displaced to longer wavelength. the values at the short wavelengths are greater than for the corresponding melt-pond results, indicating varying levels of absorbing impurities in the ice, consistent with previous studies (e.g. Reference Perovich and GrenfellPerovich and others, 1993; grenfell and others, 1998; Reference Light, Eicken, Maykut and GrenfellLight and others, 1998). the lack of a local maximum at 420 nm indicates that most of the modification to the optical properties, relative to clean ice, is primarily due to SPM or CDOM rather than to chl a, consistent with the analysis of Reference Perovich and GrenfellPerovich and others (1993) and Reference Light, Eicken, Maykut and GrenfellLight and others (1998). the coastal bare ice contained somewhat more foreign material than the ponds, as consistent with the removal of some of this material from the melt-pond ice by water drainage during pond formation and evolution.
The optical properties described above are consistent with the study by Reference Light, Eicken, Maykut and GrenfellLight and others (1998); however, we did not measure the SPM/CDOM concentration profiles in the ice. thus we cannot make an improved determination of the optical properties of the foreign material.
Discussion
The averaged extinction coefficients for MY bare and ponded ice shown in figure 3 are nearly the same to within the error estimates. recalling that these represent an average over the full MY dataset, we further combine the bare- and ponded-ice results and present a set of mean values for interior melting MY ice in table 1. note that the standard deviation is dominated by the seasonal and spatial variations, and the actual experimental error is on the order of a few percent of the extinction coefficient values quoted.
Table 1. Spectral extinction coefficient, Kλ , and its standard deviation for the interior layer (0.3–1.0 m) of MY ice. The uncertainties expressed by the standard deviations are primarily due to real but unexplained spatio-temporal variations rather than experimental error
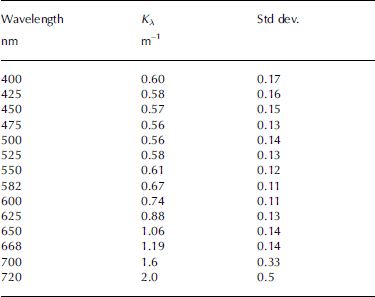
These values apply specifically to the depth range 0.3–0.9 m below the surface of bare ice or the upper 0.6 m layer of the ice beneath melt ponds. since the ice thickness in all cases was >0.9 m, the applicability of the present values to deeper layers is an important question. because melt rates and brine inclusion development in summer sea ice vary with depth, there is uncertainty in the appropriate values to use. based on visual inspection of ice cores from the observational sites, there did not appear to be a significant difference above and below the 0.9m level. thus we recommend that the values presented here can be used as an initial approximation throughout the interior portion of the ice column in undeformed summer MY ice. one of us (b.l.) is currently pursuing a detailed three-dimensional radiative transfer analysis to evaluate this situation to produce suitable extension of the values in table 1.
A question of immediate significance for large-scale modeling of the energy and mass balance of the arctic ice pack is the impact of introducing the reduced values of Kλ reported here for MY ice. to investigate this, we present estimates of the changes in solar radiation transmitted by the interior layers of summer MY ice for a range of ice thicknesses. we have used the averaged interior ice values shown above, assuming they are constant throughout the interior. because the incident radiation field in the summer was diffuse for all the present observations, consistent with summer conditions in general, and because we are considering only the radiation field within the ice, we assume that the diffusion approximation is appropriate. consequently we assume that the variation with depth, z, can be represented below a given reference depth by a decaying exponential of the form e– Kλz. we ignore the effect of the lower boundary that produces a non-exponential radiation profile at the bottom of the ice (Reference GrenfellGrenfell, 1979) since the differential results considered here for net irradiance are insensitive to this. we assume a given level of solar radiation flux at a reference depth, z ref = 0.2 m, and calculate the irradiance ratio:
Where the superscript GM refers to the values reported in GM77.
Shown in Figure 5 are the values of this ratio for total ice thicknesses of 0.5, 1.0 and 1.5 m. This gives a measure of the additional amount of solar radiation transmitted substituting the new results for K⋋ in place of the GM77 values for the ice below zref. The properties of the overlying ice are assumed to be the same in both cases. We present the ratio because the absolute magnitude of the correction as well as wavelengthintegrated results require a knowledge of the particular values of F(⋋, zref), which depend on seasonal variations in cloudiness, solar elevation, atmospheric water-vapor content and the structure of the uppermost layers of the ice. The magnitudes and their seasonal dependence thus vary from year to year and are beyond the scope of the present work.
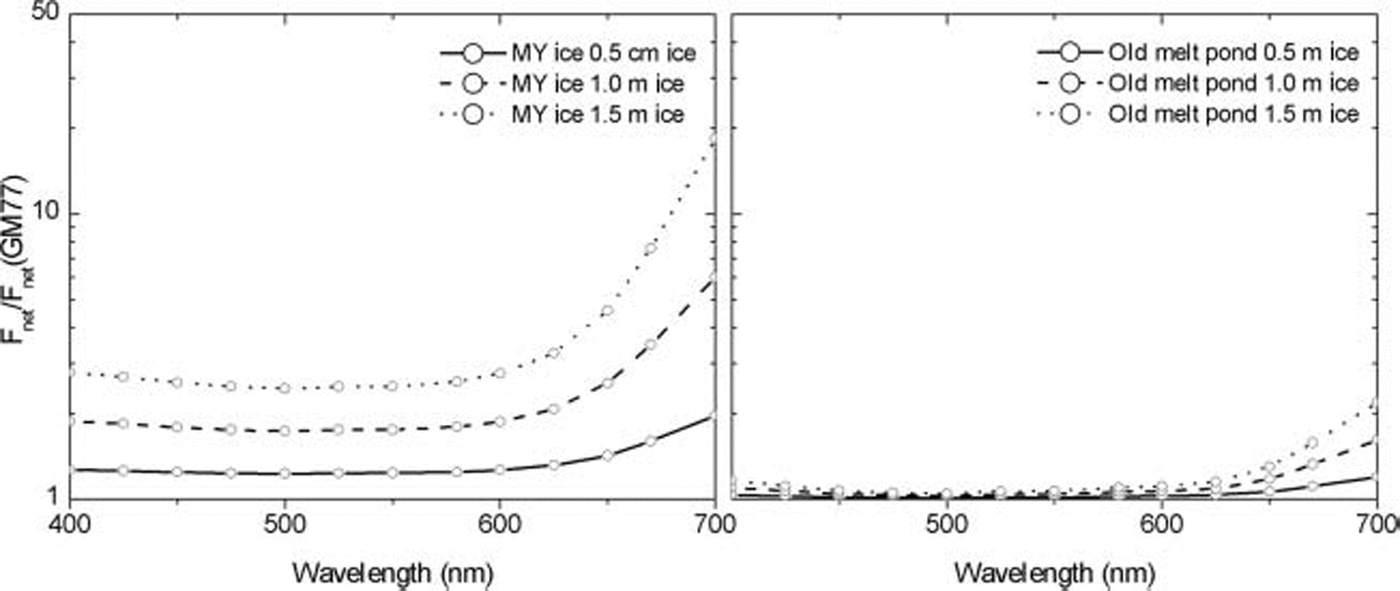
Fig. 5. Excess transmitted irradiance using new Kλ values compared to the results of GM77 for melting MY ice and ‘old melt pond’ ice vs total ice thickness. The reference depth used here is 0.2 m.
The principal point to note here is that modification of the extinction coefficients produces an enhancement to the transmitted radiative energy flux by a factor of approximately 2.5 for 1.5 m thick MY ice. the larger ratios at 650–700nm are less significant because of the much lower light levels at those wavelengths within the ice. the main consideration is the enhancement of transmittance of the thicker ice, as this will add correspondingly more heat to the upper mixed layer, enhancing the oceanic heat flux to the bottom of the ice, and accelerate the bottom melting. the ratio decreases as the ice become thinner, but for thin ice the transmitted light levels are very high in any case, and the ice decay will be very rapid from that stage onward.
The direct consequence for modeling is that solar radiation that would have been assigned to storage as latent heat of fusion in brine inclusions within the ice is instead transmitted to the ocean. more energy is thus made available to produce immediate thinning of the ice rather than delaying the onset of ice growth in the fall. the additional transmission should enhance a feedback involved in bottom melting. since the excess transmissivity increases with ice thickness, it will have significant consequences for ice modeling on all thickness and spatial scales.
The new results for melt-pond cases do not show a strong difference, and they contribute a transmission enhancement of <10% for 1.5m ice, although if larger values of Kλ reported for early-season melt ponds were used in ice mass-balance calculations the enhancement would be correspondingly greater.
For FY ice, the present values do not suggest the need to modify the previous results, as the values of Kλ are much closer to the GM77 values. since they include a significant contribution from foreign inclusions, however, future refinement of the optical properties of FY ice will depend to a considerable extent on the variations in biological activity and incorporation of suspended particulate material associated with overall arctic change. this involves processes beyond the scope of the present work. it is very likely, though, that the impact of such changes will result in a modified thickness and could affect the dynamical regime of the FY ice.
In order to use the present data in rigorous radiative transfer models, it is necessary to determine the scattering and absorption coefficients, σ and К⋋. following various studies (Reference GrenfellGrenfell, 1983; Reference Brandt and WarrenBrandt and warren, 1993) and based on the observation that the scattering inhomogeneities in the ice are very large compared with the wavelength of the radiation, we assume that σ is independent of wavelength. because the observations were made under conditions of diffuse incident radiation and since in most cases an exponential decay was observed, we assume that below 0.3 m we can use the following asymptotic formula relating the extinction coefficient and the scattering coefficient (Reference BohrenBohren, 1987; Reference Brandt and WarrenBrandt and warren, 1993):
Where ![]() is the single scattering albedo,
is the single scattering albedo,
And g is the asymmetry parameter for volume scattering. further, following light and others (1998, 2004), we assume that g = 0.94 and, using values of the absorption coefficient for sea ice used in prior radiative transfer studies (e.g. Reference GrenfellGrenfell, 1983), we minimize a figure of merit, ᵡ 2, to determine the optimal value of σ consistent with the observed extinction coefficients. in particular, we define
Where sdev λ is the standard deviation associated with each of the observations in table 1. the iterative minimization of ᵡ 2 was performed manually using the software program mathcad. the resulting value is σ = 77.0 m–1. although the minimization of ᵡ 2 was carried out to a precision of better than 0.1 m–1, this does not reflect the natural variability of σ. a more realistic estimate of the uncertainty is on the order of 15% based on the observational uncertainties in Kλ combined with the proportionality between Kλ and σ as expressed in equation (3). these results are consistent with values determined by Reference Light, Maykut and GrenfellLight and others (2004 and unpublished information). note that this value of σ is specific to the choice of the asymmetry parameter g = 0.94, and the appropriate values for other choices of g can be derived from similarity parameter arguments (Reference Light, Maykut and GrenfellLight and others, 2004). while the fit could be improved somewhat by arbitrarily allowing σ to depend on wavelength, we do not feel the present observations justify relaxing this constraint. the physics of scattering requires, at most, weak wavelength dependence for the large size parameters of the inhomogeneities in the ice, and minimization of the root-mean-square uncertainty in the absorption coefficients of sea ice is an appropriate way to address this question at present.
Conclusions
We present revised values for the spectral extinction coefficients of the layers of FY and MY summer sea ice located decimeters below the surface scattering layer. we have found that the values for MY ice show a great deal of variance associated with both spatial and temporal variations rather than being dominated by a strong seasonal trend. detailed analysis of these dependences is beyond the scope of the present study, so we present averaged values of Kλ . for melting MY ice these are significantly lower than previously reported Kλ values (GM77). this will enhance the transmittance and reduce in-ice absorption of solar radiation at visible and near-infrared wavelengths in column-type, regional and large-scale energy-balance models of arctic pack ice. a scattering coefficient of 77 m–1 for MY ice independent of wavelength produces a best fit with the present observations to within an uncertainty of 15%.
Prior results for FY ice are consistent with the present observations, keeping in mind the variability due to differences in biological and suspended particulate material included in the ice. extinction coefficients for the lower layers of both bare and ponded ice are uncertain due to three-dimensional effects producing shading and enhancement that occur in the highly spatially inhomogeneous summer ice pack. work is in progress to evaluate this class of effects more precisely.
Particularly in regimes involving persistent thinning and strong retreat of the summer arctic ice pack, it is necessary to think in terms of a more general ‘ice–radiation feedback’ that incorporates an accurate and consistent description of the partitioning of shortwave radiation using detailed radiative transfer theory. the lower values of Kλ for MY ice reported here produce conditions more favorable to a positive transmission feedback that needs to be included in energy-balance models of the arctic sea-ice cover at all spatial scales.
Acknowledgements
This work was supported by the Office of Naval Research (grant N00014-97-1-0765) and the US National Science Foundation (grant OPP-9910888). We are pleased to acknowledge the logistics support by A. Heiberg and D. Ramey that contributed greatly to the success of the field projects. we are grateful for helpful comments by H. Eicken and D. Darby.


