1. Introduction
What are the indicators of journal quality? Even though the quality of research has always been associated with perceived quality of journals in which it was published (Hull & Wright, Reference Hull and Wright1990), this question is becoming increasingly important (Mingers & Yang, Reference Mingers and Yang2017) with the explosion of open-access publishing (Butler, Reference Butler2013). One of the most widely used indicators, the journal impact factor, has always been under scrutiny for its ability to establish the quality of individual research papers and the journal itself (e.g., Saha et al., Reference Saha, Saint and Christakis2003; Simons, Reference Simons2008; Jawad, Reference Jawad2020; Lariviere & Sugimoto, Reference Lariviere and Sugimoto2019; Law & Leung, Reference Law and Leung2020). This is especially true for newer journals (Simons, Reference Simons2008), when researchers are left with nothing but a publisher’s reputation to rely on (e.g., Allen & Heath, Reference Allen and Heath2013; Gabbidon et al., Reference Gabbidon, Higgins and Martin2010). Despite newer comparative studies evaluating various quality indicators (e.g., Mingers & Yang, Reference Mingers and Yang2017; Chavarro et al., Reference Chavarro, Ràfols and Tang2018; Ahmad et al., Reference Ahmad, Sohail, Waris, Abdel-Magid, Pattukuthu and Azad2019) and development of new indices of quality assessment (e.g., Zhang et al., Reference Zhang, Qian, Zhang, Zhang and Zhu2019; Xie et al., Reference Xie, Wu and Li2019), the question remains: how does a journal establish its reputation?
In this study, we attempt to answer this important question for one of the newest, and a priori set as flagship, journals for network research studies—Network Science. Having published its inaugural issue in 2013, it is still establishing itself as a premier research outlet. While its objective citation-based indicators place it in the first quartile of target disciplines (such as sociology and political scienceFootnote 1 ), it is yet to reach the rank of a “top field” journal. Given that many journals do not rise up the ranking after a certain point, does Network Science have what it takes to do so?
Is it too early to tell? We do not think so. Network Science has already issued eight full volumes. Most published articles (with exception of the very new) are fully indexed and are being actively cited. The journal became popular among “big name” academics: out of over 190 articles published through 2020, over half (51%) were authored by at least one scholar with H-index over 20; 69% of articles—by authors who have an i10-Index.Footnote 2 Articles were published across almost twenty very different disciplines, from medicine, to management and economics, to sociology, sports, and political science. Methodological articles, offering new methods, can be universally applied to any discipline. Many of them substantially advance network analytics and have a lot of potential to influence many fields of science. In other words, there appears to be enough evidence that the journal is well on its way to establishing the “canon of research” (Brandes et al., Reference Brandes, Robins, McCranie and Wasserman2013:12) in network science. What is unclear is the exact ways in which its impact is the most pronounced—and it certainly cannot be measured by the journal’s impact factor alone.
The role of journals in science has been conceptualized in a variety of ways (Borgman, Reference Borgman1990). Of course, the most important role of any research outlet is communication, or the exchange of research results. However, journals play a role in individual careers of scientists (e.g., Petersen & Penner, Reference Petersen and Penner2014; Raff et al., Reference Raff, Johnson and Walter2008), since publishing papers in high-impact journals as seen as “crucial” for obtaining professional recognition in most fields (Van Raan, Reference Van Raan2014:24). Most importantly, journals are attributed with development of science in many fields (e.g., Marshakova-Shaikevich, Reference Marshakova-Shaikevich1996; Verbeek et al., Reference Verbeek, Debackere, Luwel and Zimmermann2002; Mingers & Leydesdorff, Reference Mingers and Leydesdorff2015).
While the many roles of journals are not disputed, what differs substantially, however, is the measurement of this role. The “science of science” studies provide an ample review of the historical accounts of scientific attempts to “measure things” (Van Raan, Reference Van Raan2014:21). A review by Fortunato et al. (Reference Fortunato, Bergstrom, Börner, Evans, Helbing, Milojević and Barabási2018) has provided an overview of both the trends in science development and the trends in studying this development. It has the central idea that a “deeper understanding of the factors behind successful science” (Fortunato et al., Reference Fortunato, Bergstrom, Börner, Evans, Helbing, Milojević and Barabási2018:1) may allow us to enhance the science’s prospects of effectively addressing societal problems. So apparently, the “science of science” is an important field in its own right. Moreover, with respect to “science of science,” Fortunato et al. (Reference Fortunato, Bergstrom, Börner, Evans, Helbing, Milojević and Barabási2018) advocated for integration of citation-based metrics with alternative indicators.
Based on the extensive literature review and substantial work done by others before us, we have found two such “alternative indicators” that go beyond the journal impact factor and might shed light on the question we are asking: what are the indicators of journal quality? Not surprisingly, one answer is the quality of research, which is judged by scientists themselves. There are at least two approaches to measuring this quality.
One way for research to make a substantial contribution is by enhancing our theoretical understanding of the studied phenomena—the role that is difficult to overstate (Colquitt & Zapata-Phelan, Reference Colquitt and Zapata-Phelan2007). There are multiple ways in which journals fulfill this role, among them publishing: research at the intersection of disciplines or fields (Zahra & Newey, Reference Zahra and Newey2009); studies that bridge the quantitative–qualitative divide (Shah & Corley, Reference Shah and Corley2006); studies that have practical significance (Corley & Gioia, Reference Corley and Gioia2011); studies that utilize advanced methodology (e.g., Carroll & Swathman, Reference Carroll and Swatman2000; Levy, Reference Levy2003); or studies that have higher societal impact (Bornmann, Reference Bornmann2013). Theory building by a journal cannot be currently evaluated by some measure or a score; a more substantive, qualitative analysis of research published in a journal is usually necessary for doing so.
Another is the pattern of scientists’ references to each other’s work. Methods of evaluating this type have been in use for a long time, from co-citation analysis and citation patterns (since about 1970s, e.g. Small, Reference Small1973), co-word analysis (since about 1980s, e.g., Callon et al., Reference Callon, Courtial, Turner and Bauin1983), and different variants of bibliometric analysis (since about 1990s, e.g., Peritz, Reference Peritz1983). There are too many to list, but recent years have seen substantial advances in statistical analysis of research quality. Quite fitting for Network Science are the methodological advances in network approaches to citation analysis (e.g., Maltseva & Batagelj, Reference Maltseva and Batagelj2020; Caloffi et al. Reference Caloffi, Lazzeretti and Sedita2018; Van Eck & Waltman, Reference Van Eck and Waltman2014; Mane & Börner, Reference Mane and Börner2004), which allow to evaluate how co-citations create “islands of research” or separate scientific subfields. Network Science, bridging together research streams from different fields, could have certainly developed its own islands, quite distinct from traditional disciplines. Over time, this confirmation of research quality and the pattern of co-citation evolves into a contribution that can be summarized as developing the “scientific research program” (Lakatos, Reference Lakatos1968).
So, with these two perspectives at hand, the goal of this study is to answer a question of the role that Network Science, a relatively new journal, plays in developing the field of network science, and implicitly, establishing itself as a premier, high-quality journal. First, we qualitatively examine the journal’s contribution to the field by evaluating the theoretical and methodological contribution of Network Science articles and determine whether any obtained characteristics have an impact on the article’s citation rates. Second, we examine the keywords of the published studies to assess the presence of research islands or topics that may indicate whether the journal has started establishing the “hard core” (Lakatos, Reference Lakatos1968) of network science.
In the next section, we establish the theoretical foundation for our analysis. It is followed by the description of our data set and the methods used to analyze it, in line with the two approaches that we use to reach the study’s objectives. We then focus on results of the study and conclude the paper with a discussion of the obtained findings and potential key directions for future research.
2. Advancing sciences: Theoretical and methodological contribution, article impact as a measure of journal impact, and scientific research program
While the exact meaning of “science” is probably a question for philosophy of science, a hundred-years old definition given by Dewey (Reference Dewey1910) appears to summarize the essence of it for our purposes: science is not ready-made knowledge, it is “an effective method of inquiry into any subject matter” (Dewey, Reference Dewey1910:124). Subject matter is, essentially, content for theory (Biglan, Reference Biglan1973), and debates of what is more important for development of science—theory or method—are clearly outside the scope of this article. Instead, we propose a way to evaluate both the theoretical and the methodological contribution of an article simultaneously and independently of one another, to examine the impact of both in articles of Network Science. We also look at whether these articles have formed the “hard core” of new science, promoted by the journal.
2.1 Theoretical contribution
When it comes to evaluating a study’s theoretical contribution, the network science field faces a special challenge, not typical for other sciences. Some scholars argue that being truly interdisciplinary, it lacks a unifying theory. Instead, network concepts, such as centrality, community, and connectivity, serve as unifying features of multiple theories from different fields (e.g., Patty & Penn, Reference Patty, Penn, Victor, Montgomery and Lubell2017). Others claim that network theory became “one of the most visible theoretical frameworks” that could be almost universally applied to any field (Havlin et al., 2010), but without specifying precisely what “network theory” is. Yet others, such as Borgatti & Halgin (Reference Borgatti and Halgin2011), go into great lengths to delineate network theory from theory of networks, and to separate flow models from bond models. Such difference of opinions is too drastic for the truth to “lie in between.” Much more likely, it appears, is the fact that for some fields, using network concepts to ground theoretical arguments constitutes theory development, while for others, “network theorizing” (Borgatti & Halgin, Reference Borgatti and Halgin2011:1170) is required in order for the contribution to be sufficient.
However, to evaluate an article’s theoretical contribution, it is impossible to examine every field to determine the appropriate “theoretical practices.” What we need is an almost-universally understood and accepted “measuring instrument” that could assess an article’s theoretical contribution without going into the field specifics.
It turns out such a tool does exist. Colquitt & Zapata-Phelan (Reference Colquitt and Zapata-Phelan2007) proposed a taxonomy that allows evaluating an article’s theoretical rigor along two dimensions: theory-testing (hypothetico-deductive reasoning) and theory building (inductive reasoning). The taxonomy was developed using many theoretical and empirical writings in the field of management and philosophy of science. As a result, it incorporated an entire spectrum of theoretical contributions that empirical articles could make.
This taxonomy almost universally applies to studies published in Network Science (with just a few exceptions, described in the Method section), because it fits the universal canons of theoretical measurement (Eran, Reference Eran2017). In almost every discipline, there are existing theories that serve as foundation for current “inquiry into any subject matter” (Dewey, Reference Dewey1910:124). Moreover, as Wasserman & Faust (Reference Wasserman and Faust1994) put it, methods of network analysis were developed to test specific hypotheses about the network structure, creating a “symbiosis” (Wasserman & Faust, Reference Wasserman and Faust1994:4) of theory and method. Therefore, network analysis is grounded in both theory and application (Wasserman & Faust, Reference Wasserman and Faust1994), regardless of the field of study.
In their study, Colquitt & Zapata-Phelan (Reference Colquitt and Zapata-Phelan2007) created a typology of the theoretical contribution of an article along two dimensions, which are summarized in Table 1. The first dimension is the “testing theory” dimension—an evaluation of an extent to which existing theories are used as grounding for the study’s hypotheses. Importance of testing existing theories cannot be overemphasized, as testability is one of the major characteristics of a scientific theory (Simon & Groen, Reference Simon and Groen1973; Simon, Reference Simon1994).
Table 1. Colquitt & Zapata-Phelan (Reference Colquitt and Zapata-Phelan2007) taxonomy
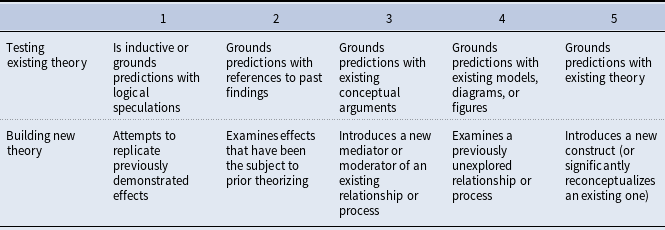
The second dimension is “theory building,” expressed as either supplementing existing theory or introducing components that serve as new theory foundations. We refer the reader to the original article for the detailed description of each dimension, but want to emphasize one important point. This typology allows for further classification of articles. For example, in the original study, Colquitt & Zapata-Phelan (Reference Colquitt and Zapata-Phelan2007) divided all examined articles into “reporters” (low on theory-building and theory-testing dimension), “qualifiers” (medium on both), “builders” (low on testing, high on building), “testers” (high on testing, low on building), and “expanders” (high on both dimensions). They have further examined the trends and the impact of the analyzed articles and found that higher levels of theory-building and theory testing are associated with higher article citation rates. So beyond understanding the level of theoretical contribution, this typology allows for further analysis of the article’s impact.
For most of the articles with a reference to an anchoring theory, estimating the “testing theory” dimension is straightforward. The “building theory” dimension is usually also quite apparent, as authors typically provide the indications of available theoretical gaps and the ways in which they fill them and advance the new knowledge. Therefore, this typology is appropriate for almost any article published in Network Science. The possible exceptions are review articles and introductions to special issues, purely methodological articles that describe formal mathematical extensions of existing methods, etc. We describe the articles that could not be evaluated using this taxonomy in more detail in the method section.
2.2 Methodological contribution
Almost any discipline is a combination of theory and method, and network science is no exception. Moreover, as Barabási (Reference Barabási2016) asserted, not only the subject determines network science but also the methodology. Method is important, even essential, to development of theory in network science. As Wasserman & Faust (Reference Wasserman and Faust1994) stated, social network methods have developed “to an extent unequaled in most other social disciplines,” becoming an “integral part” of advancing social sciences theory, empirical research, and formal mathematics and statistics (Wasserman & Faust, Reference Wasserman and Faust1994:3).
Evaluating the article’s impact, and as a result, the journal’s impact on the field, is impossible without assessing the contribution of methods used. Given that currently, there is no tool for evaluating methodological contribution (Judge et al., Reference Judge, Cable, Colbert and Rynes2007), we have developed our own scale—in essence, a third dimension to Colquitt & Zapata-Phelan’s taxonomy. To create a continuum of method with ordinal anchors, we relied on several popular network science textbooks, starting with the classical text of Wasserman & Faust (Reference Wasserman and Faust1994). Perhaps, it is true to all methods, but in network analysis, books progress “from simple to complex” (Wasserman & Faust, Reference Wasserman and Faust1994:23). Therefore, using the structure of classical texts, we have derived the progressive scale of methodological contribution.
No comprehensive book or guide on all available network methods currently exists, to the best of our knowledge. This was the gap first noticed by Wasserman & Faust (Reference Wasserman and Faust1994), in their first seminal text. That book, however, has since become dated with respect to newest methods (Barabási, Reference Barabási2016), so it alone could not be used as a guide. Currently, methodological texts are available in one of two formats: general interest books or introductory textbooks, which contain the basics of network analysis, and more advanced collections, offered as “lecture notes” on special topics. Regardless of the type, books have one thing in common: they describe rigorously tested, well-known approaches to network analysis, and usually lag the field’s development because of long publishing times (e.g., Greco, Reference Greco2013; Clark & Phillips, Reference Clark and Phillips2014). New, previously unknown methods get community-tested via github (e.g., Cosentino et al., Reference Cosentino, Izquierdo and Cabot2017; Kalliamvakou et al., Reference Kalliamvakou, Gousios, Blincoe, Singer, German and Damian2014; Lima et al., Reference Lima, Rossi and Musolesi2014) or other similar online aggregators (Begel et al., Reference Begel, Bosch and Storey2013; Vasilescu et al., Reference Vasilescu, Serebrenik, Devanbu and Filkov2014); introduced via open-source software such as R packages (e.g., Zhao & Wei, Reference Zhao and Wei2017; Ortu et al., Reference Ortu, Hall, Marchesi, Tonelli, Bowes and Destefanis2018); or, though with delays due to the length of peer review process, get published as journal articles (Galiani & Gálvez, Reference Galiani and Gálvez2017). To this extent, the Network Science journal plays an especially important role: this is one of the main outlets for pioneering methodological research.
To create the scale of methodological contribution, we considered this peculiarity of the field’s development, relying on different books for anchoring the scale and leaving room for methods developed outside the traditional venues. We have used the following texts to derive the ordinal methodological contribution scale: Wasserman & Faust (Reference Wasserman and Faust1994), Brandes & Erlebach (Reference Brandes and Erlebach2005), Carrington et al. (Reference Carrington, Scott and Wasserman2005), Easley & Kleinberg (Reference Easley and Kleinberg2010), Scott & Carrington (Reference Scott and Carrington2011), Kadushin (Reference Kadushin2012), De Nooy et al., (Reference De Nooy, Mrvar and Batagelj2018), Newman (Reference Newman2018). There are many books devoted to network methods, and we do not claim that we selected a full set. These books appear to have made a substantial impact on academia as measured by citation rates (with over 1,000 citations each; most have substantially more). Moreover, they represent a range of books in the field, from purely methodological to devoted to specific applications.
In each of these books, methods progressed from simple to complex. This progression was very succinctly summarized in the description to the Newman (Reference Newman2018) “Networks” book: “…Provides a solid foundation, and builds on this progressively with each chapter.2FFootnote 3 ” We found this to be true for all books we used in our review. Relying on them as a guide, we have generated the anchors and the points on the proposed methodological scale. We have considered data requirements, computational efforts, training, and understanding required to execute certain methods, and availability of software. Resulting scale, with examples from examined books, is presented in Table 2.
Table 2. Scale of methodological contribution with examples from classical network analysis books
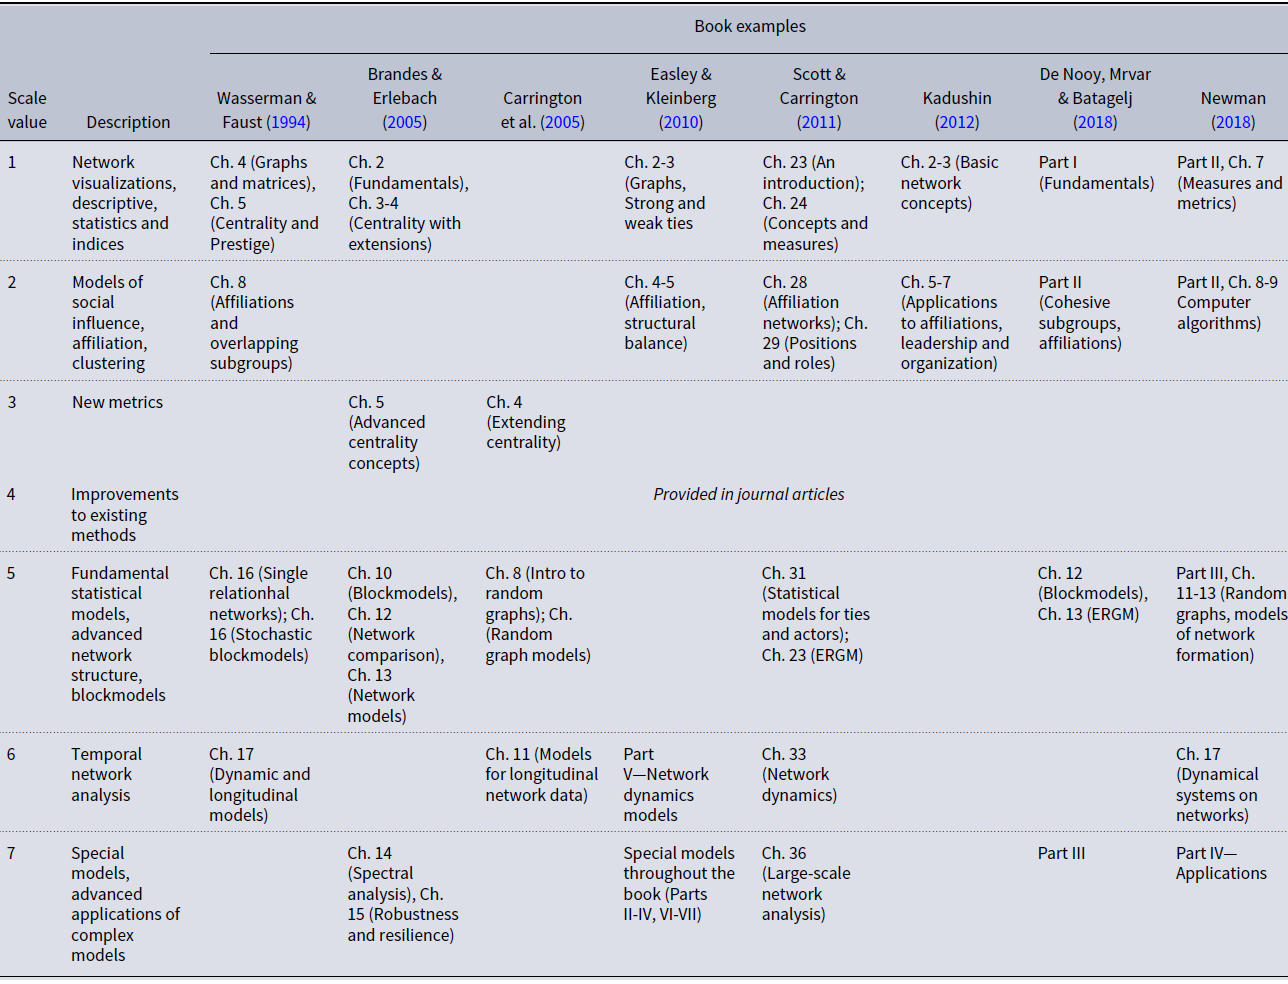
The first two points on the methodological scale represent low levels of network methods contribution. The first point is for methods that are limited to network visualizations, descriptive statistics (numbers of nodes and ties, etc.), and indices (e.g., density, reachability, connectivity, geodesic, eccentricity, diameter, etc.). These are very simple network measures that some books refer to as “fundamentals,” and they are usually the first topics covered in introductory network courses. Given advances in network analysis software, index calculations, and visualizations require minimum effort. These metrics and measures can be provided for any network data, so data also pose minimum requirements. Studies with this level of network-analytic difficulty are usually those where network analysis methods are secondary to some other statistical approach to hypothesis testing (e.g., Bellavitis et al., Reference Bellavitis, Filatotchev and Souitaris2017). While network analysis plays a role in the study’s structure, this role is minimal.
The second point on the scale presents basic network models. Among them, for example, are models of social influence, where network indices may be calculated first, and then used as predictors in multiple regression models (e.g., Singh & Delios, Reference Singh and Delios2017). Also in this category are models that examine community structure (e.g., Smirnov & Thurner, Reference Smirnov and Thurner2017; Smirnov, Reference Smirnov2019); subgroup and affiliation networks; and applications of basic network models to a variety of problems in diverse fields. Computational requirements are usually relatively low, and data are either secondary or can be obtained from social networks and general surveys. Advanced training in formal mathematics of networks for executing these models is usually not required.
The third and fourth points on the scale provide medium levels of methodological contribution. They either introduce new metrics (such as new centrality indices) or suggest improvements to existing methods. New metrics usually find their way into books eventually (e.g., Brandes & Erlebach, Reference Brandes and Erlebach2005; Carrington et al., Reference Carrington, Scott and Wasserman2005). Improvements to existing methods, usually incremental, are published almost exclusively as journal articles, until they become substantially tested by the community and become standard (e.g., Yaveroglu et al., Reference Yaveroglu, Fitzhugh, Kurant, Markopoulou, Butts and Przulj2014; Goodreau, Reference Goodreau2007). Studies using these methods require either advanced understanding of network analysis or substantial computational effort. However, their methodological impact, though important, is not confirmed until substantial testing takes place.
The fifth through the seventh points represent high levels of methodological contribution. The fifth point corresponds to fundamental statistical models, advanced network structure detection models, blockmodeling, and similar approaches. Executing such models requires substantial knowledge and understanding of network-analytic methods. Data usually pose serious requirements, including organization and clean-up. These models also provide nontrivial insights and are designed to test more fundamental research questions. Temporal network analysis is one point higher on the scale because of additional data requirements (longitudinal collection) and higher computational requirements of such approaches as TERGM and SIENA. Special models, which use advanced application of complex models to community detection, epidemiological settings, etc., occupy the highest point on the scale. All methods within the “high contribution” group require substantial training in network analysis, higher computational efforts, and more restrictive data.
However, we found it to be highly unlikely that studies using network methods utilize only one of the above-mentioned approaches. Usually, articles contain network description and visualization, basic network indices, and then model(s) of various difficulty. Because the points on the scale are not mutually exclusive, for actual computation of the article’s methodological contribution we propose a simple sum of all points present in the article. The resulting contribution can vary from 0 (though unlikely for a network-related study) to 28 (though also unlikely given the usual article length). Resulting scale is also ordinal, and we applied it to all examined articles to separate studies with a more advanced approach to analysis from those with lower levels of methodological impact.
2.3 Article impact as measure of journal impact
Citations of research articles are increasingly used to judge the quality and status of academic journals (Judge et al., Reference Judge, Cable, Colbert and Rynes2007). There are some debates about legitimacy of citations as evaluation tool, which started in the early days of scientometrics and are still ongoing (e.g., Ewing, Reference Ewing1966; Garfield, Reference Garfield1979; Lindsey, Reference Lindsey1989; MacRoberts & MacRoberts, Reference MacRoberts and MacRoberts1989; Onodera & Yoshikane, Reference Onodera and Yoshikane2015). While there are some objections to using citations as measures of quality, the alternatives are rather limited (e.g., Phelan, Reference Phelan1999; Jarwal et al., Reference Jarwal, Brion and King2009). Since citation analysis is “here to stay,” apparently (Lister & Box, Reference Lister and Box2009), the next question is what causes the article to be cited.
There are many studies on this topic in diverse disciplines: management (e.g., Judge et al., Reference Judge, Cable, Colbert and Rynes2007), medicine (e.g., Annalingam et al., Reference Annalingam, Damayanthi, Jayawardena and Ranasinghe2014), law (e.g., Ayres & Vars, Reference Ayres and Vars2000), economics (e.g., Johnson, Reference Johnson1997), biotechnology (e.g., Petruzzelli et al., Reference Petruzzelli, Rotolo and Albino2015), to name a few. Despite very different academic cultures, there appears to be a consensus on some of the characteristics that increase article citation rates in any field, and they are divided along two philosophical dimensions—particularistic or universalistic.
Particularistic, or social constructivist perspective (Baldi, Reference Baldi1998), suggests that the source of scientific contribution—the author—may be more important than the merits of the published paper. There is evidence suggesting that citing “big name” academics may count more towards academic promotions (e.g. Austin, Reference Austin1993) and that reputation of authors is important for success of empirical papers (e.g., Mialon, Reference Mialon2010). This “big name” perspective is still thriving in academia, and publication decisions and citations may still be attributable to the personal status of a writer, not the merits of research per se (Judge et al., Reference Judge, Cable, Colbert and Rynes2007).
Particularistic attributes include the author’s past high productivity (usually measured by an H-index or a similar attribute), which may be perceived to enhance the citing authors’ legitimacy (Mitra, Reference Mitra1970) and the higher prestige of a scientist’s university, which may implicitly enhance the author’s respectability (e.g., Helmreich et al., Reference Helmreich, Spence, Beane, Lucker and Matthews1980). The author’s gender, a personal attribute that should be irrelevant to scientific contribution (Bedeian & Field, Reference Bedeian and Feild1980), also appears to have an effect. This effect differs between studies, however: some find that female authors get fewer citations than males (e.g., Cole, Reference Cole1979; Rossiter, Reference Rossiter1993), while others find the exactly opposite effect (e.g., Ayres & Vars, Reference Ayres and Vars2000).
Universalistic perspective places value on scientific progress and attributes an article’s success to its contribution to the development of science (Cole & Cole, Reference Cole and Cole1974). Who wrote the paper is irrelevant; what matters is the article’s solid theoretical foundation and high-quality execution (Judge et al., Reference Judge, Cable, Colbert and Rynes2007). Previous research cites several study characteristics among universalistic predictors of article’s success: refinement of existing theories (Cole & Cole, Reference Cole and Cole1974), extensions of new theories (Beyer et al., Reference Beyer, Chanove and Fox1995), exploration of new paradigms (Newman & Cooper, Reference Newman and Cooper1993), and high quality of a study’s methods (Gottfredson, Reference Gottfredson1978; Shadish et al., Reference Shadish, Tolliver, Gray and Sen Gupta1995).
Given that article citations are widely seen as a measure of a journal’s quality, examining citations of Network Science articles is a reasonable approach for evaluating its contribution. In line with the universalistic perspective, Colquitt & Zapata-Phelan’s (Reference Colquitt and Zapata-Phelan2007) framework, together with scale of methodological rigor, provides the measures of universalistic article quality attributes. Particularistic attributes, given the tendencies for their influence on citations, could be used as controls to account for the variance they explain in citation rates.
2.4 Scientific research program
Lakatos (Reference Lakatos1968) characterized all scientific research programs by their “hard core” (Lakatos, Reference Lakatos1968)—the generally accepted assumptions, tenets, and axioms—the foundation of the discipline; and a “protective belt” of auxiliary hypotheses, which get tested with the core assumptions intact. Network science is no exception. There are certain generally accepted principles of network science “core,” stated and restated in every foundational network science text.
In the editorial to the inaugural issue of Network Science, Brandes et al. (Reference Brandes, Robins, McCranie and Wasserman2013) have set a high goal for the journal—to “excel above and beyond disciplinary boundaries” (Brandes et al., Reference Brandes, Robins, McCranie and Wasserman2013:2). The editors have clearly articulated their vision for the networks field, delineating what they saw as “network theory” and what data constituted “network data.” They further called network science “the emerging science” (Brandes et al., Reference Brandes, Robins, McCranie and Wasserman2013:12), not tied to any field—transcending disciplinary boundaries, an evolving network itself. The role of Network Science journal, then, was to develop “a canon of research”—an outlet for “the most promising and widest-reaching” papers (Brandes et al., Reference Brandes, Robins, McCranie and Wasserman2013:12)—which pushed forward this new science.
Perhaps, then, the principles of network science “core” are summarized most succinctly by Brandes et al. (Reference Brandes, Robins, McCranie and Wasserman2013) and defined as “common grounds” for the field: it is all aspects of study of “relational data,” from collection to analysis, interpretation, and presentation (Brandes et al., Reference Brandes, Robins, McCranie and Wasserman2013:2). The work in the network science field, then, is based on this assumption that somehow, from this relational nature of data, we can extract additional meaning not available otherwise. Having stated that these relational data form the core of network science, Brandes et al. (Reference Brandes, Robins, McCranie and Wasserman2013) nonetheless ask the question of whether such a unity of a foundation does exist. As they say, if it does, then there is a promise of a new scientific discipline, in line with the characteristic of Lakatos (Reference Lakatos1968).
Attempts to examine the intellectual structure of network science have been made previously, mostly with bibliometric analysis tools (but also with network methods, of course). Most studies, to the best of our knowledge, have been somewhat limited in scope and focused on a narrow aspect of network science, such as social media research (e.g., Coursaris & Van Osch, Reference Coursaris and Van Osch2014) or network communities (e.g., Khan & Niazi, Reference Khan and Niazi2017). Perhaps, being an interdisciplinary field, network science is too large of a field to examine in a single study, and therefore such study has not been attempted yet. The question before us, however, is whether the network science “core” has been established by the Network Science journal. Recent advances in bibliometric network analysis (e.g., review by Cobo et al., Reference Cobo, López-Herrera, Herrera-Viedma and Herrera2011) allow us to do so, with potential answers to a question of what constitutes the “core” topics, and where lies the “protective belt” (Lakatos, Reference Lakatos1968).
3. Data and methods
3.1 The dataset
The data set consisted of all Network Science articles published in 2014–2020.Footnote 4 We used 2014 as the starting year of the data collection because it was the year when the journal was indexed in the Web of Science (WoS) Core Collection database. The initial data set contained 195 publications. We excluded papers that were book reviews, since they did not present results of original research, creating a sample of 183 articles. In this set, there were three references to addenda or errata, which we have also removed. Final data set consisted of 180 articles, and the same set was used for both parts of the analysis.
3.2 Measures
Dependent variable. The dependent variable in the study was the number of citations, the article has received up until the point of data collection. Data for this variable were downloaded directly from the WoS database at the time of data collection.
Independent variables. Independent variables were the article’s theoretical contribution variables (“Testing theory” and “Building theory”) and methodological contribution score (“Method”), which we coded manually for each of the articles. To evaluate the articles’ theoretical and methodological contribution, we downloaded the texts of articles in our data set. We then coded each article with scores of its theoretical and methodological contributions, and a set of article attributes previously identified as having an impact on citation rates.
Each article was coded independently by three subject matter experts. To unify the coding between coauthors and minimize data entry errors, we developed a macro-based data entry form in Excel, with some of the fields, such as authors, title, issue, and pages prefilled. Coders then checked appropriate boxes for each of the attributes, which translated into either 0/1 Boolean score in Excel (indicating absence or presence of a certain attribute) or an actual score for “Theory building” and “Theory testing” variables. To evaluate the rate of agreement between raters, we used the two-way random, absolute agreement interclass correlation coefficient (ICC, Koo & Li, Reference Koo and Li2016). The value of ICC for “Testing theory” variable between the three raters was 0.78; for “Building theory” variable—0.77, which indicates good reliability (Koo & Li, Reference Koo and Li2016). Nonetheless, all the differences between raters were discussed, and all articles with different scores reviewed again until all three raters reached a consensus score.
To assign a code to “Theory building” and “Theory testing” variables, we relied on instructions of Colquitt & Zapata-Phelan (Reference Colquitt and Zapata-Phelan2007). Consistent with their methodology, we allowed for half-points in addition to integers in our coding.
For coding “Method,” we used a simple 0/1 checkmark for every method that was used in the study (each of the methodological scale points was represented by a separate checkbox). Points on our proposed scale were not mutually exclusive. To compute the “Method” score, we added all points together. The resulting contribution could vary from 0 (though unlikely for a network-related study) to 28 (though also unlikely given the usual article length). For ease of interpretation, we linearly transformed the resulting score to have values with a minimum of 0 and a maximum of 10. Because it was a linear transformation, it did not affect any of the variable relationships. Resulting scale, however, was continuous.
To account for the possibility of a nonlinear impact of a “Method” variable on article citations, we also created a “Method squared” variable. Network Science journal is different from many journals in the field given its emphasis on generating new methodological knowledge. Some articles published in a journal introduce highly sophisticated, but limited application methods, which would get a high “Method” score, but might get lower citations because they are applicable to smaller research domains. A squared variable would capture this effect if present.
Control variables were presented by a set of universalistic and particularistic attributes shown to have an impact on citation rates in previous studies. Universalistic controls were article age, length, and the number of references cited. To control for particularistic attributes, we used information about each of the article’s authors, including author H-index (obtained manually from Publons), affiliation (as indicated on the article at the time of publication), gender, and number of authors. Author disambiguation was handled by locating author records in affiliated institutions listed on the articles. Affiliation variable was used to obtain the rank of the author’s university from 2020 QS rating.Footnote 5 Because we performed the analysis on the article level, not the author level, we generated variables that captured the article-level attribute for each: “Maximum H-index” (the highest of all authors for the article), and “Best university rank.” Because of the exploratory nature of the study, we wanted to examine whether “big names” (Leberman et. al., Reference Leberman, Eames and Barnett2016) or higher-ranked universities account for an additional number of citations with all variables in the study.
“Gender” variable was coded as Boolean, with a value of 1 assigned to “female.” We also calculated article-level “Average gender” (the value greater than 0.5 would indicate more female authors for the article). For each article, we also coded the number of coauthors.
We obtained descriptive statistics on all study variables, including zero-order correlations. Then, we ran a series of models to the article impact. Next, we examined trends in theory building, theory testing, and methodological contribution and isolated discrete article types based on the combination of these characteristics. We used data mining software Orange (Demšar et al., Reference Demšar, Curk, Erjavec, Gorup, Hočevar, Milutinovič and Štajdohar2013) to perform hierarchical clustering.Footnote 6 We used Manhattan distance (Sinwar & Kaushik, Reference Sinwar and Kaushik2014) as a measure of dissimilarity between observations (allowing for possible multiple solutions) and complete-linkage method as a measure of dissimilarity between clusters (Jarman, Reference Jarman2020). Data were normalized prior to analysis.
3.3 Analytical approach: Evaluating article’s impact
To examine article impact, we performed regression analysis, assessing the relationship between theory building, testing, method, and article citations on a set of 180 articles. As an analysis method, we used zero-inflated negative binomial regression (Garay et al., Reference Garay, Hashimoto, Ortega and Lachos2011; Moghimbeigi et al., Reference Moghimbeigi, Eshraghian, Mohammad and Mcardle2008; Didegah & Thelwall, Reference Didegah and Thelwall2013) in Stata.
We have chosen this regression method for several reasons. First, the dependent variable is a “counts” type variable, which is typically Poisson-distributed. However, as Table 3 shows, the dependent variable is overdispersed, with standard deviation substantially exceeding the average. This would have suggested the use of negative binomial regression. However, Figure 1 demonstrates that the dependent variable contains a substantial number of zeros (as is expected for recently published articles). Using the Vuong test for non-nested models (Long, Reference Long1997), we determined that excess zeros warranted the use of a zero-inflated negative binomial model (z =1.92, p < 0.0277). Second, this method allowed for substantial post-estimation evaluation, which allowed us to estimate the probability of having excess zeros in the dependent variable over time.
Table 3. Descriptive statistics and zero-order correlations
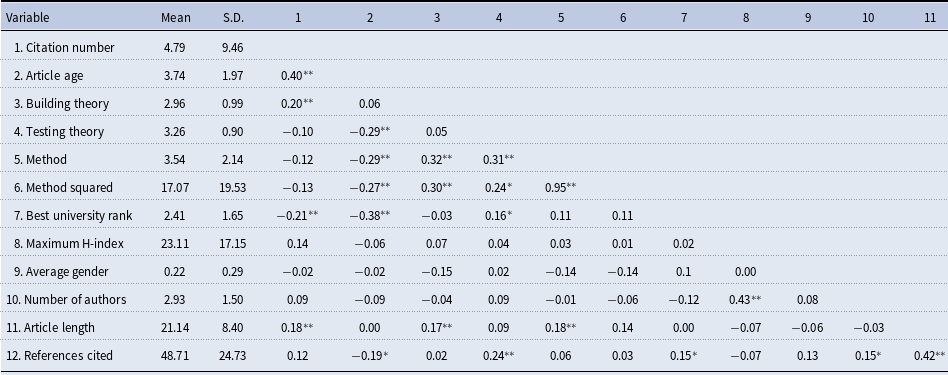
Note: n = 180; * p < 0.05; ** p < 0.01; standard errors in parentheses.
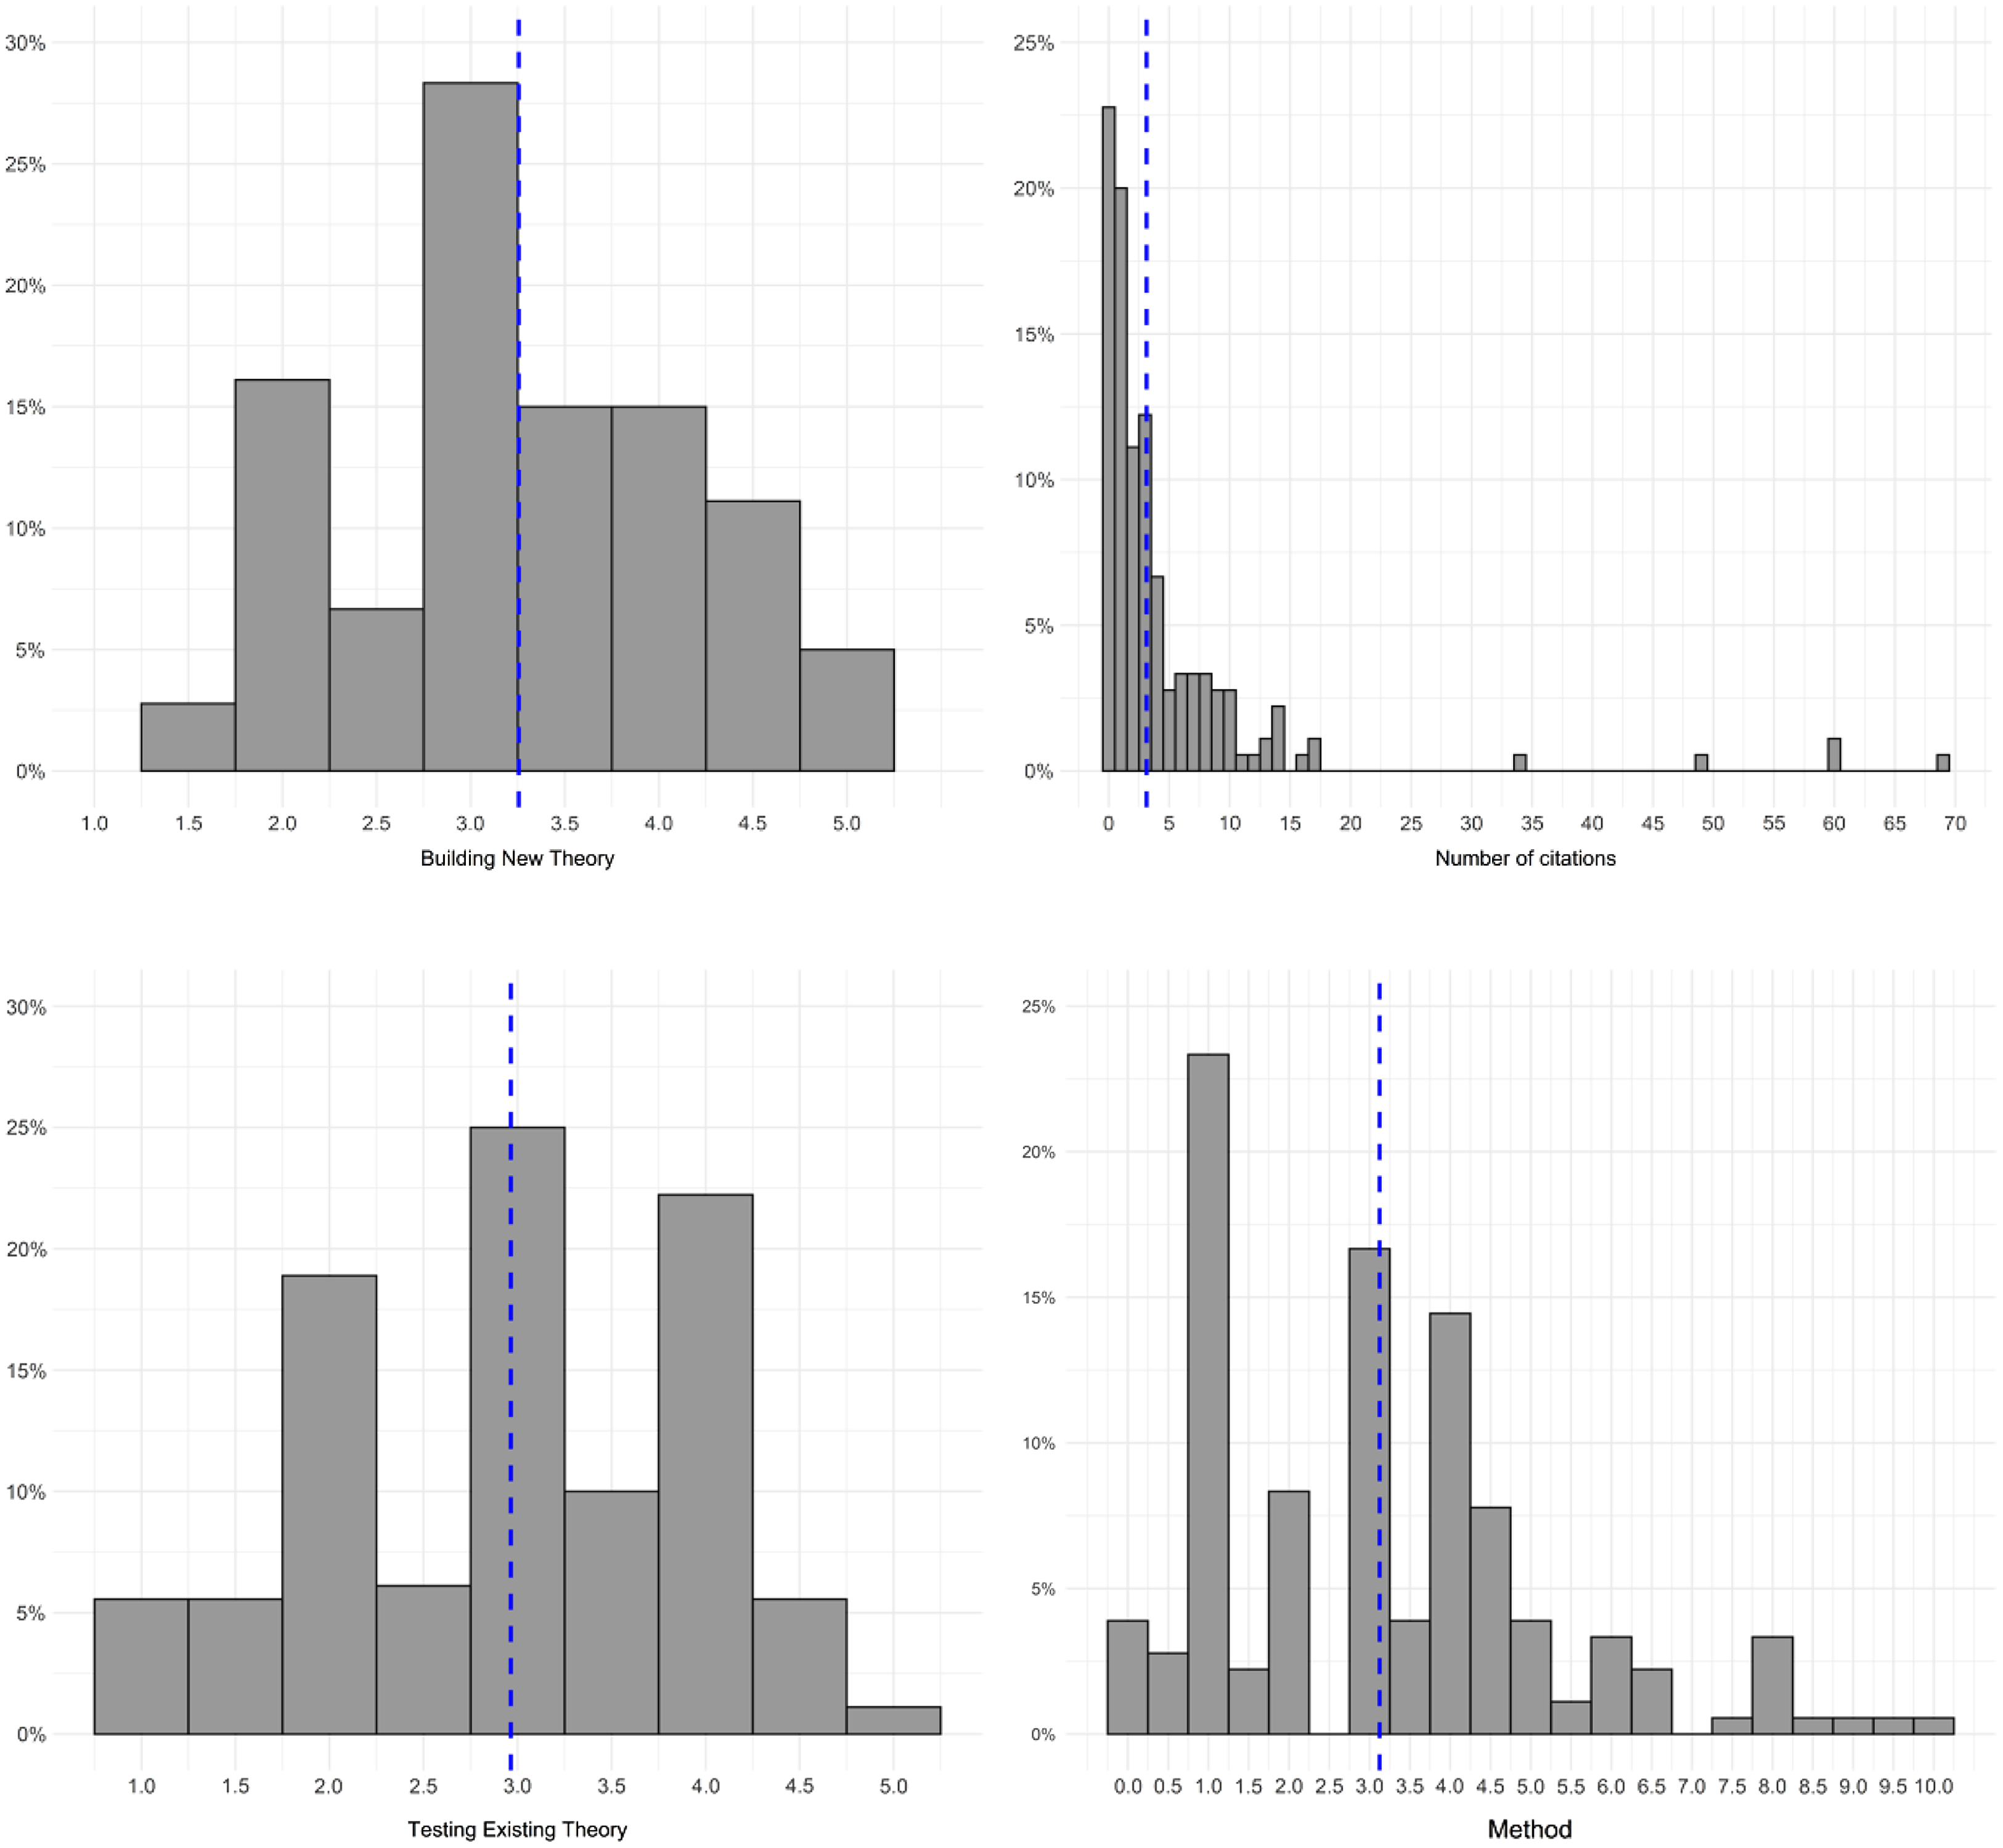
Figure 1. Distributions of the main study variables.
Because our study was largely exploratory, we used a multistep approach, building a series of models that evaluated impact of independent variables on article citation rates in the presence of various controls.Footnote 7 Since the standard R 2 (percentage of variance explained) could not be calculated, we used Craig & Uhler’s pseudo R 2 as the most appropriate for our model (Long, Reference Long1997). This index calculates the improvement from null model to fitted model. Though not the same as the standard R 2, it is indicative of the degree to which model parameters improve the prediction of the model (Long, Reference Long1997). Finally, we have explored the relationship that distinct article types may have with citations, using the obtained article categories as predictors.
3.4 Analytical approach: Exploring the scientific research program
To isolate the “hard core” of the Network Science research program, we used the methodology of bibliometric analysis presented in detail by Maltseva & Batagelj (Reference Maltseva and Batagelj2020) and Caloffi et al. (Reference Caloffi, Lazzeretti and Sedita2018). There are certainly many methods and tools for bibliometric analysis, including networks, which are amply described by Cobo et al. (Reference Cobo, López-Herrera, Herrera-Viedma and Herrera2011). They range from visualization of the co-occurrence network (e.g., Van Eck & Waltman, Reference Van Eck and Waltman2014; Yang et al. Reference Yang, Wu and Cui2012) to the use of Kleinberg’s burst detection algorithm and co-word occurrence analysis (e.g., Mane & Börner, Reference Mane and Börner2004). In one very similar study, Sedighi (Reference Sedighi2016) used word co-occurrence network analysis to map the scientific field in Informetrics. The principal difference of that study with the methods we use is that we go a step further, isolating “islands” within the field.
The main idea of the “island” method (De Nooy et al., Reference De Nooy, Mrvar and Batagelj2018, p. 127; Batagelj et al., Reference Batagelj and Cerinšek2013, p. 54) is to use the word co-occurrence network (which we label as
![]() $nKK$
later in this section) to explore the “hard core” of Network Science. Batagelj et al. (Reference Batagelj and Cerinšek2013) defined an “island” in a network as a maximal subgraph that is connected, and where the values of edges between the nodes in the subgraph are greater than the values of edges between the nodes in the subgraph and the rest of the network. This method allows for effective separation of dense networks into subgraphs that represent relatively cohesive communities and are easier to analyze and describe. The advantage of using the “islands” method for bibliometric analysis is that it allows identifying local communities of different sizes and link strengths in dense networks. It also makes it easier to identify nodes that do not belong to any of the found communities.
$nKK$
later in this section) to explore the “hard core” of Network Science. Batagelj et al. (Reference Batagelj and Cerinšek2013) defined an “island” in a network as a maximal subgraph that is connected, and where the values of edges between the nodes in the subgraph are greater than the values of edges between the nodes in the subgraph and the rest of the network. This method allows for effective separation of dense networks into subgraphs that represent relatively cohesive communities and are easier to analyze and describe. The advantage of using the “islands” method for bibliometric analysis is that it allows identifying local communities of different sizes and link strengths in dense networks. It also makes it easier to identify nodes that do not belong to any of the found communities.
We used the same data set of 180 articles. To transform the data set into a set of networks, we used WoS2Pajek (Batagelj, Reference Batagelj2017). In line with Maltseva & Batagelj (Reference Maltseva and Batagelj2020) methodology, we created the unweighted bimodal keyword network articles-to-keywords (
![]() $WK$
). This network connects articles published in the Network Science journal in the period 2014–2020 to their respective keywords.
$WK$
). This network connects articles published in the Network Science journal in the period 2014–2020 to their respective keywords.
Article keywords were derived from the existing WOS fields. The fields were ID (“keywords plus”—keywords assigned to articles by the WoS platform), DE (“author keywords”—keywords assigned to articles by their authors), and TI (article titles) fields of the WoS records. These keywords were obtained by lemmatization and stopword removal. We used Wos2Pajek (Batagelj, Reference Batagelj2017) software package to transform the Web of Science records into networks ready for further analysis. The lemmatization procedure was performed automatically by WoS2Pajek, which relies on MontyLingua Python library, and applied to both the keywords and the article titles. Procedures that are implemented in this software are described in detail in a study by Maltseva & Batagelj (Reference Maltseva and Batagelj2020a), Batagelj & Maltseva, (Reference Batagelj and Maltseva2020), Maltseva & Batagelj (Reference Maltseva and Batagelj2019), and Batagelj et al. (Reference Batagelj, Ferligoj and Squazzoni2017). These studies also show that the procedure has shown acceptable performance in its history of previous use.
During our data preprocessing procedure, we removed words one character in size and words containing numbers or punctuation. The resulting articles-to-keywords network (
![]() $WKryx$
) consisted of 180 articles and 1,187 words.
$WKryx$
) consisted of 180 articles and 1,187 words.
We then used the articles-to-keywords network (
![]() $WKryx$
), to build a network of word co-occurrence, following Maltseva & Batagelj (Reference Maltseva and Batagelj2020) methodology. To avoid overrating contribution of papers with very large number of words, we used the fractional approach demonstrated previously in the literature (e.g., Maltseva & Batagelj, Reference Maltseva and Batagelj2021; Batagelj & Cerinšek, Reference Batagelj and Cerinšek2013; Batagelj, Reference Batagelj2020). This approach normalizes the contribution of each article, so that its input to the resulting network is equal to 1 but assumes that each keyword has equal importance. Without the normalization, the outdegree is the number of words in the article, and the indegree is the number of articles with the same words. Normalization allows to create a network where the weight of each arc is divided by the outdegree of a node, represented by the sum of weights of all arcs with the same initial node.
$WKryx$
), to build a network of word co-occurrence, following Maltseva & Batagelj (Reference Maltseva and Batagelj2020) methodology. To avoid overrating contribution of papers with very large number of words, we used the fractional approach demonstrated previously in the literature (e.g., Maltseva & Batagelj, Reference Maltseva and Batagelj2021; Batagelj & Cerinšek, Reference Batagelj and Cerinšek2013; Batagelj, Reference Batagelj2020). This approach normalizes the contribution of each article, so that its input to the resulting network is equal to 1 but assumes that each keyword has equal importance. Without the normalization, the outdegree is the number of words in the article, and the indegree is the number of articles with the same words. Normalization allows to create a network where the weight of each arc is divided by the outdegree of a node, represented by the sum of weights of all arcs with the same initial node.
Here, w is an article and k is a keyword. Multiplying normalized transposed
![]() $nWKryx$
by itself has generated the words co-occurrence network
$nWKryx$
by itself has generated the words co-occurrence network
![]() $nKK$
.
$nKK$
.
We used the resulting co-occurrence network,
![]() $nKK,$
built from the normalized
$nKK,$
built from the normalized
![]() $nWKryx$
network, for exploring the “hard core” of Network Science, using the island method of Nooy et al. (2018, p. 127; Batagelj, Reference Batagelj2014, p. 54).
$nWKryx$
network, for exploring the “hard core” of Network Science, using the island method of Nooy et al. (2018, p. 127; Batagelj, Reference Batagelj2014, p. 54).
4. Results
4.1 Descriptive statistics and distinct article types
Table 3 contains the means, standard deviations, and zero-order correlations among study variables used to evaluate article impact. Figure 1 shows the main variable distributions.
The dependent variable, number of citations, has a mean of 4.79 and a standard deviation of 9.46, indicating overdispertion relative to the traditional Poisson distribution. Histogram of citations in Figure 1 shows an excessive number of zeros. The theory-building mean of 2.98 (S.D. = 0.99) indicates that a typical article in Network Science either introduced a new mediator or moderator of an existing relationship, or examined a previously unexplored relationship or a process. The theory-testing mean was 3.26 (S.D. = 0.90), indicating that the typical article grounded predictions with references to past findings or with existing conceptual arguments. The method mean of 3.54 (S.D. = 2.14) indicated that a typical article in Network Science either suggested a new metric or an improvement to an existing method. Distributions of these variables appear to not be creating any analytical problems.
In their study, Colquitt and Zapata-Phelan created discrete categories of articles, which represent the most common combinations of theory building and theory testing. They also describe the article’s contribution (Reporters and Qualifiers represent low levels of theoretical contribution, other types—high). We have also used the methodological contribution, and having three dimensions to analyze, we were able, nonetheless, to map the Network Science articles to the Colquitt & Zapata-Phelan’s (Reference Colquitt and Zapata-Phelan2007) typology.
Addition of methodological dimensions has allowed us to create additional article types, described by high levels of methodological contribution, which we called “explorers” and “pioneers,” increasing the complexity of the existing typology. They are distinct from other article types because they are characterized by high or very high scores on the Method dimension—meaning, they introduce new metrics or methods. For management studies, especially published in an applied journal, development of new methodology is rare, so Colquitt & Zapata-Phelan’s (Reference Colquitt and Zapata-Phelan2007) typology did not account for this contribution type. However, for Network Science, methodological contribution is essential. Network Science is an outlet that is aimed at publishing new or improved methods for analyzing networks, long before they end up in books. Therefore, studies that suggest completely new methods or metrics receive higher scores on the Method dimension.
Table 4 contains the map of the discrete article types. Note that, unlike the study by Colquitt & Zapata-Phelan (Reference Colquitt and Zapata-Phelan2007), we did not find any articles of type “tester” published in Network Science—apparently, there are no studies dedicated to testing existing theory only, without other contributions. This is not surprising, given the scope of the journal.
Table 4. Discrete article types—map to Colquitt & Zapata-Phelan (Reference Colquitt and Zapata-Phelan2007) typology
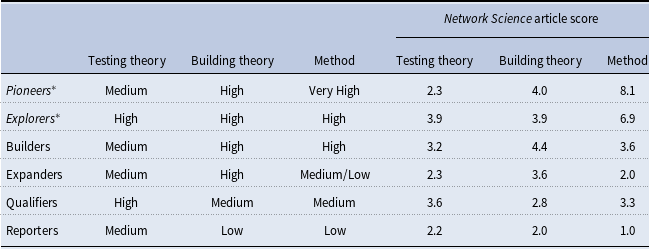
* Note: Not defined by Colquitt & Zapata-Phelan (Reference Colquitt and Zapata-Phelan2007). Low: ≤ 2.0; Medium: < 3.5.
Articles that score high on methodological contribution, as it turns out, also score relatively high on the building theory dimension. Studies that we call “Pioneers” have very high method scores and propose a new approach to modeling while simultaneously allowing to build theory. A typical example of such study is Sewell (Reference Sewell2018), providing a method to build simultaneous and temporal autoregressive network models. This study appears to be “pioneering” in nature because it proposes a substantial improvement that overcomes serious limitations (e.g., dyad conditional independence) of existing methods, extends the method to account for dyad temporal dependence, offers a new visualization method, and demonstrates how to apply this new method to two different settings, each with its own theoretical foundation. Doing so allows the authors to expand the tenets of an existing theory, because relationships that could not be explored in the past can be explored with a new method—at least a point “4” on the Colquitt & Zapata-Phelan’s (Reference Colquitt and Zapata-Phelan2007) taxonomy.
Another previously undefined type, “Explorers” score high on Method, but also relatively high (above 3) on testing and building theory. A typical article in this category is Fujimoto et al. (Reference Fujimoto, Snijders and Valente2018), which examines multivariate dynamics of one- and two-mode networks to explore sport participation among friends. The study scores high on all three dimensions: it tests existing theory of social influence, it explores previously unexplored network evolution by using a longitudinal context, and it uses a relatively complex stochastic actor-oriented multivariate dynamic model. This is substantially more complex than the “Builders” or “Expanders” designations, defined by Colquitt & Zapata-Phelan (Reference Colquitt and Zapata-Phelan2007), allow.
Examining the number of articles of each type, it is also clear that the number of articles of high theoretical contribution types (Builders, Expanders, Explorers, and Pioneers) is higher than articles with lower theoretical contribution. Figure 2 shows the graphical distribution of the automatically obtained clusters present in Network Science. Expanders, the highest level of theoretical contribution according to Colquitt & Zapata-Phelan (Reference Colquitt and Zapata-Phelan2007), constitute a substantial number of articles (49). Together with Pioneers (16), Explorers (6), and Builders (24), articles with high theoretical contribution account for over half of all articles in Network Science. Therefore, it is apparent that the journal publishes articles with a high potential for expanding knowledge.
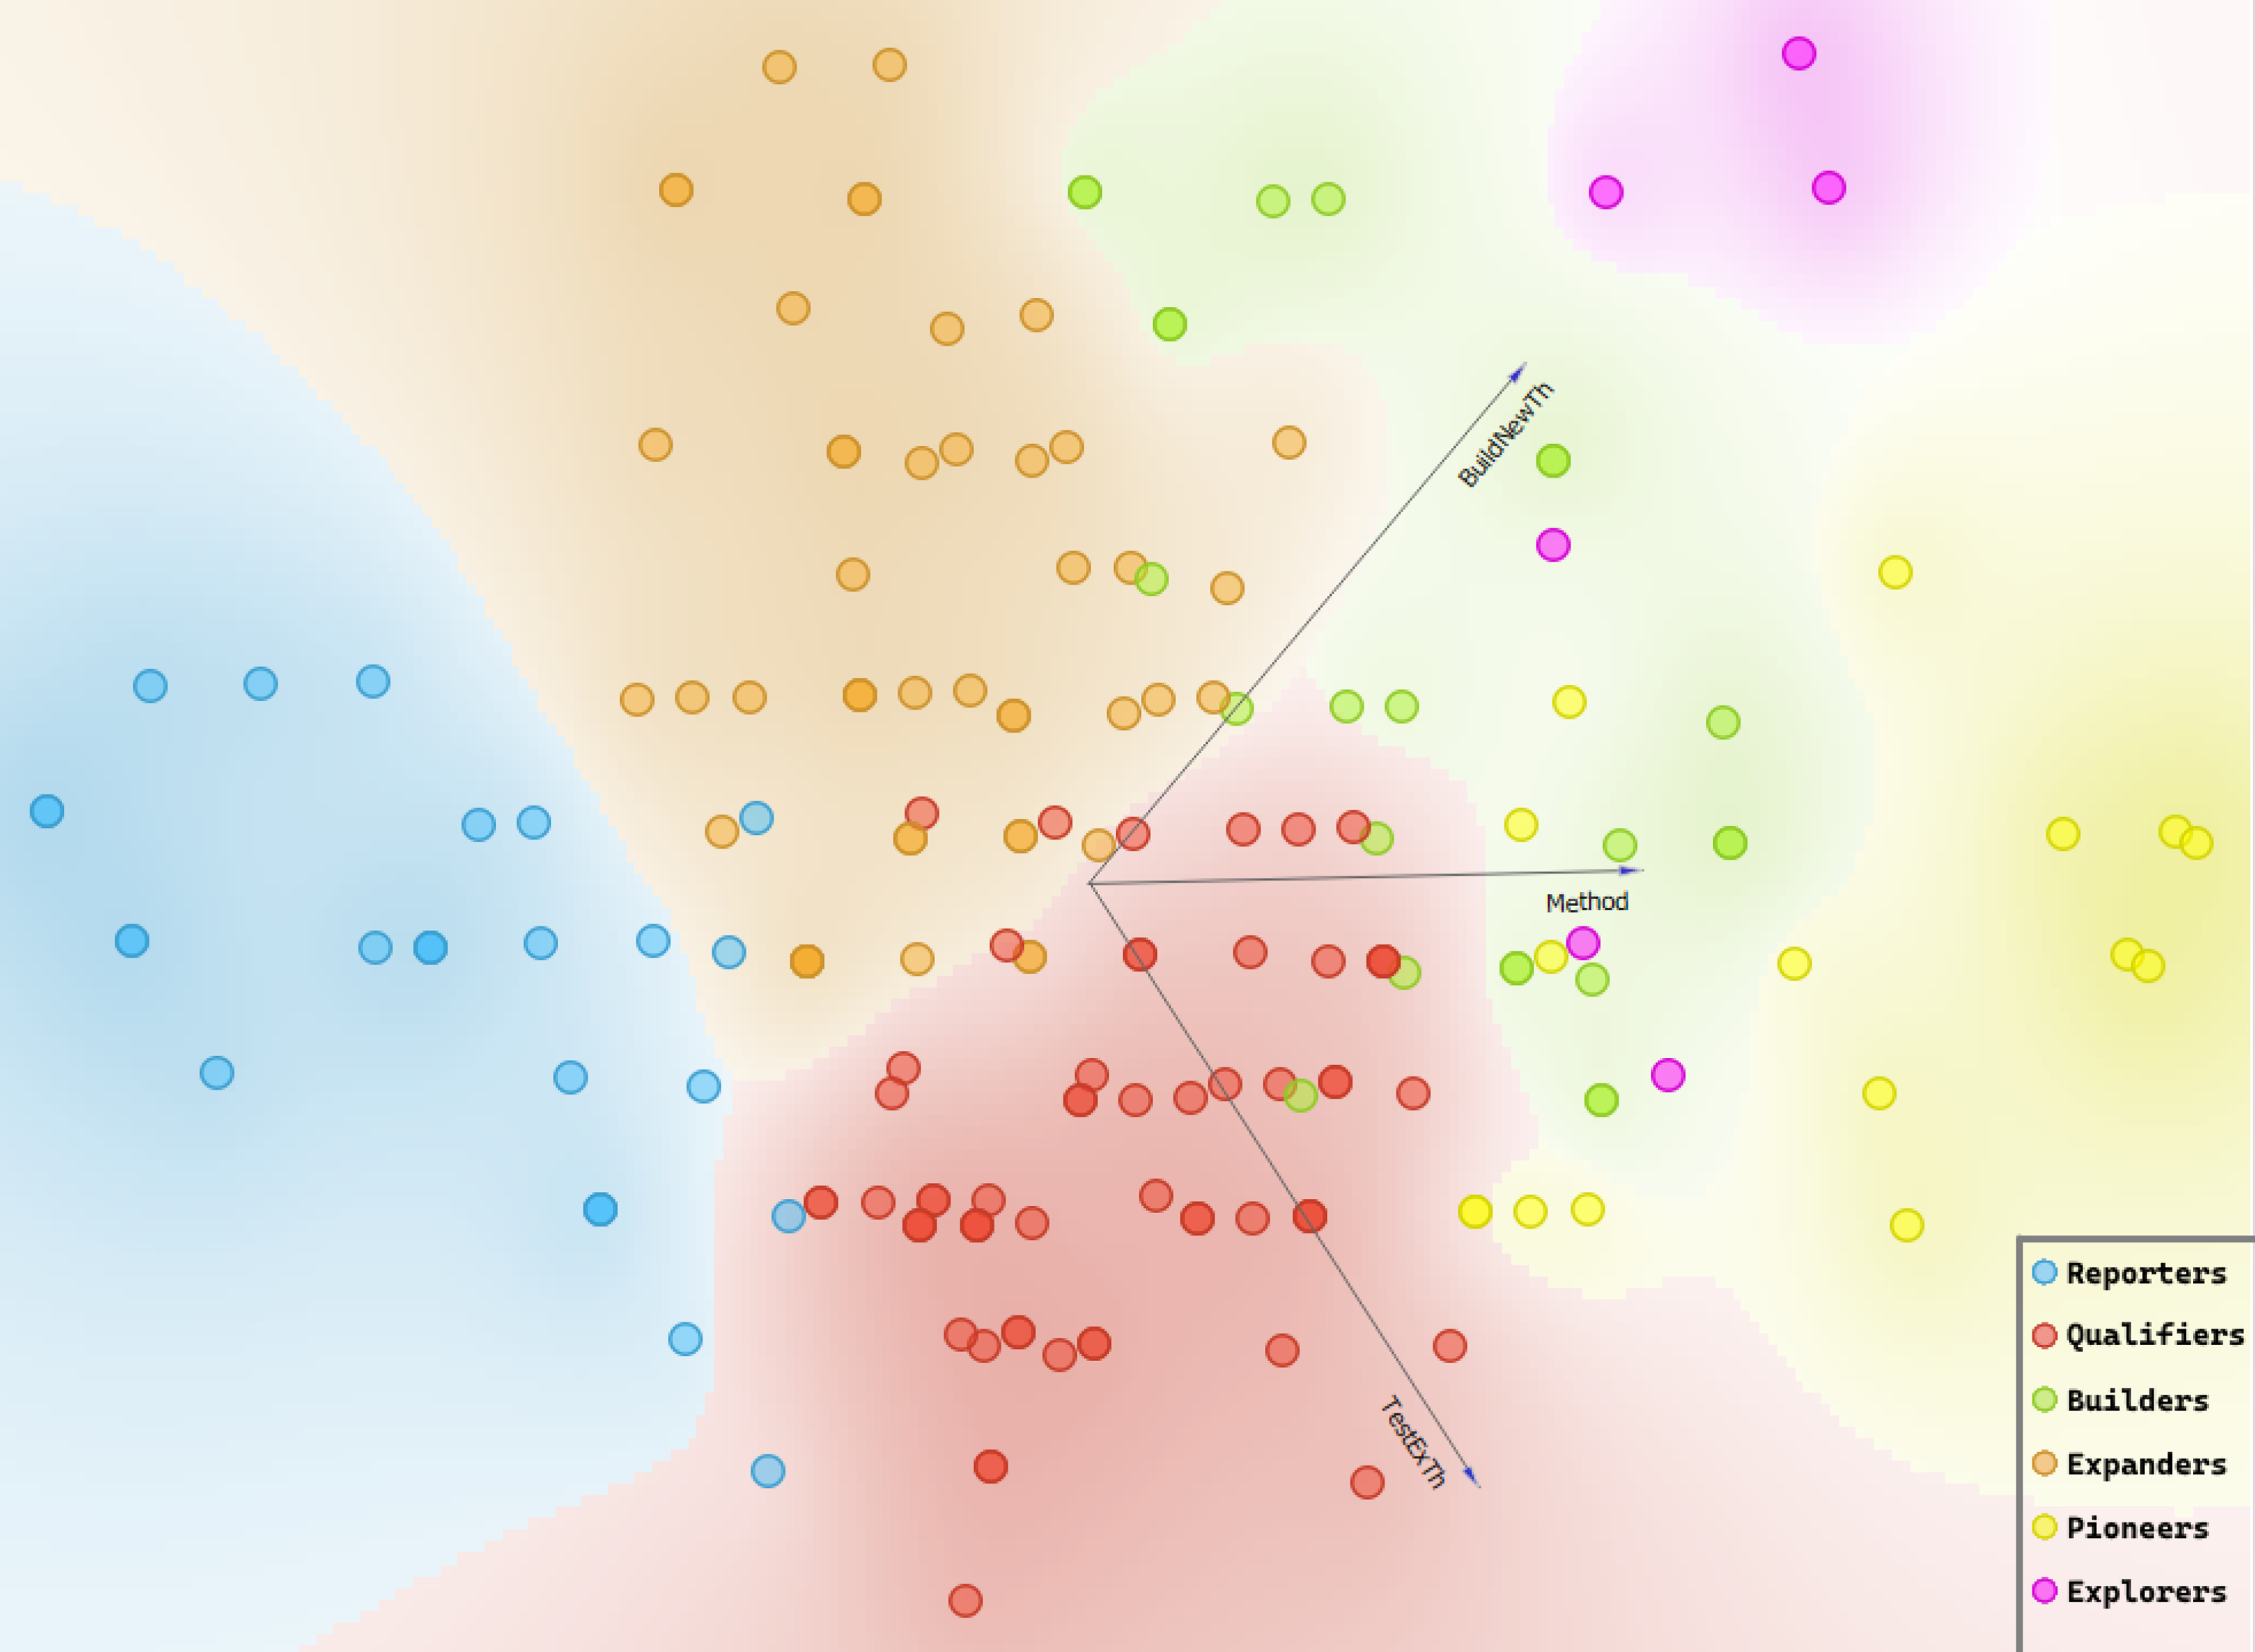
Figure 2. Taxonomy of article contribution: Clusters of studies by contribution type.
4.2 Theoretical/methodological contribution and article impact
Table 5 presents the results of a series of zero-inflated negative binomial regression models, in which we examined the relationship between theoretical and methodological contribution and article citation rates. In line with previous research, we started with controls, with article age as an inflator of excessive zeros. In the sequence of models, we examined universalistic and particularistic controls separately, and then combined (Models 1–3). Then, we evaluated independent variables by themselves, with the Method variable evaluated alone and together with Method squared (Models 4–5). In Models 6–7, we sequentially added universalistic and particularistic controls, and the final model (Model 8) contains only the significant variables. Because the study was largely exploratory, the only hypothesis we were testing was whether a beta coefficient of any variable was significantly different from zero.
Table 5. Theoretical and methodological contribution and article impact: coefficients of the zero-inflated negative binomial regression models
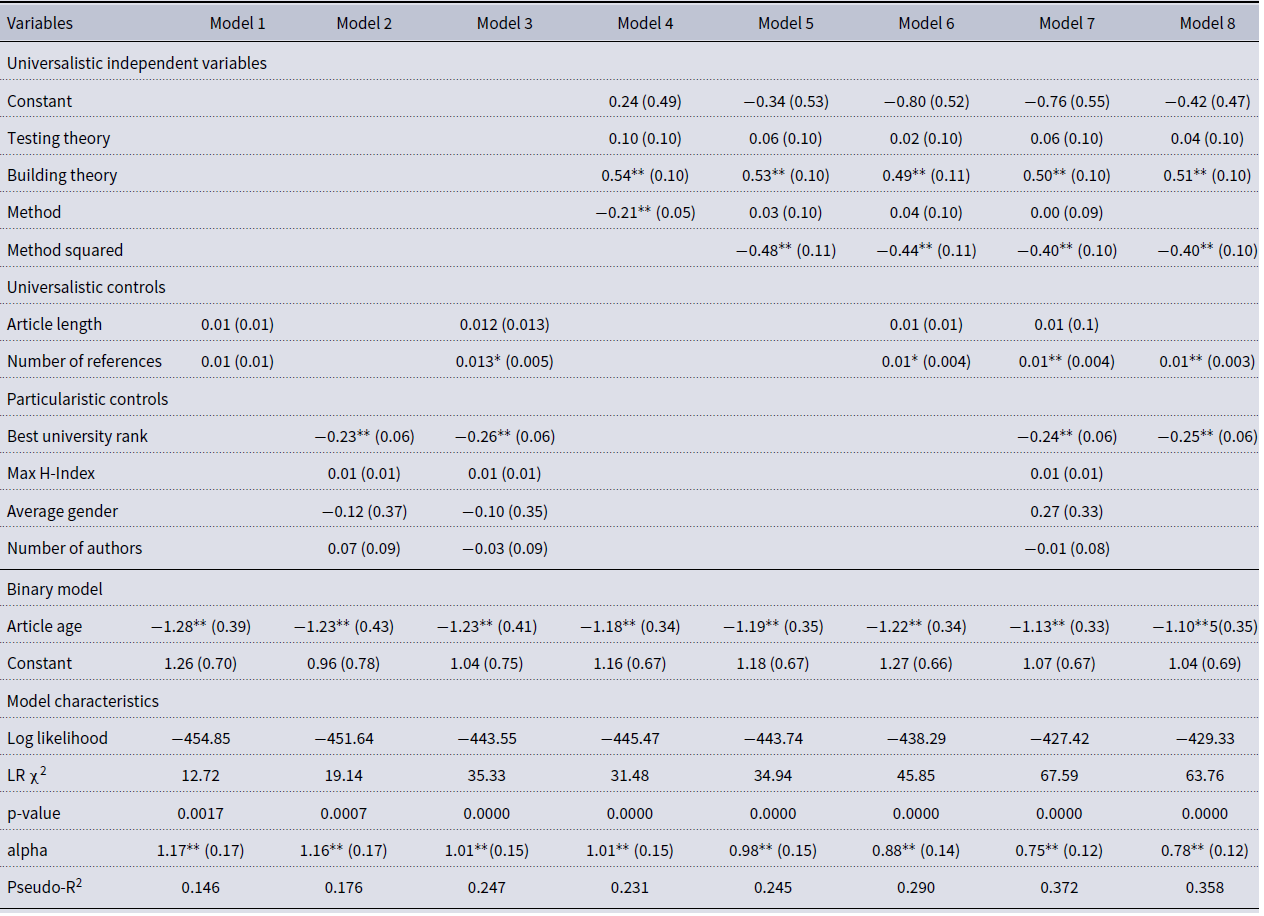
Note: n = 180; * p < .05; ** p < 0.01; standard errors in parentheses.
Table 6. Individual article types and article impact: coefficients of the zero inflated negative binomial regression models
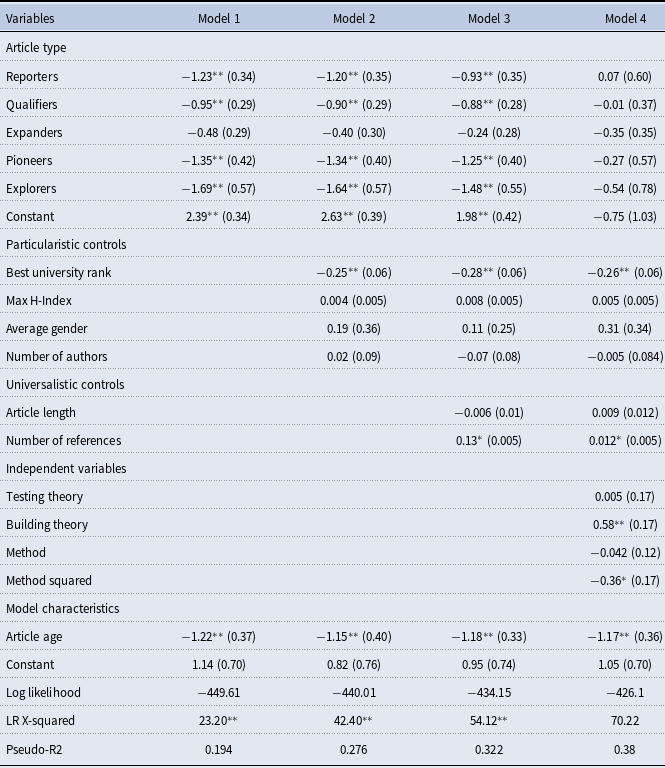
Note: n = 180; * p < .05; ** p < 0.01; standard errors in parentheses.
Model characteristics. All models are significant, as indicated by the likelihood ratio (LR) χ2, which compares the full model to a model without count predictors. Overdispersion coefficient, alpha, for all models is significantly above zero, confirming that zero-inflated negative binomial model is preferred to the zero inflated Poisson. Pseudo-R 2 cannot be interpreted the same way as the R 2 for the OLS models, but for each model, it does provide an indication of a relative improvement in explanatory power when certain variables are evaluated.
Interpretation of control variables. Results indicate that the variable used to explain inflated zeros, Age, is consistently significant and has a negative relationship with excess zeros observed over time. This is an expected result, since newer articles are more likely to have zero citations than older articles. We have performed a post-estimation test to predict the probability of excess zeros. This probability declines sharply, and by year 4, reaches the level of about 2% (Table 3S in the Supplemental Materials). Therefore, it is reasonable to expect that an average Network Science article will have at least one citation three years after publication.
Out of all control variables used in the study, only two—the number of references in the article and the best university rank—are statistically significant in some of the models. When universalistic controls (article length and number of references) are used alone, neither variable is significant. The number of references become significant in the presence of particularistic controls and independent variables. The variation of its coefficient, when combined with other variables, is relatively small. For every additional reference, the difference in the logs of expected citation counts is expected to increase by the 0.01, holding all other variables constant.
Out of particularistic controls, only the best university rank is significant, and again, its variation between the models is negligent. For a one unit increase in the rank of the university, the difference in the logs of expected citation counts is expected to decrease by approximately 0.25. Because university ranks are provided in the reverse order (the lower the better), this negative relationship is intuitive and in line with existing research: authors from better universities receive more citations. We cannot establish a causal relationship with this research, but the apparent positive association with these variables follows the findings of previous research.
Interpretation of independent variables. Out of three independent variables, apparently, theory testing has no association with the citation rates. This variable is insignificant in all the models, with and without controls. Theory building, however, has a highly significant positive relationship—also in all models. For a one unit increase in theory building, the difference in the logs of expected citation counts is expected to increase by approximately 0.5, though this coefficient varies between 0.49–0.54 and between models with various controls.
The method variable has a significant and negative relationship, which is contrary to expectations. So, we further tested the effect of the Method squared variable in Model 5. As hypothesized, the relationship between Method variable and citation rates appears to be nonlinear: the squared term is significant. A negative and significant coefficient (−0.48) indicates an inverted U-shaped relationship: the increase in the method complexity increases citations only to a certain point. The Method variable itself becomes insignificant in the presence of Method squared. This is not surprising given high multicollinearity between a variable and its polynomial. It is also possible that the polynomial variable fully captures the impact of the Method variable, including its negative linear trend.
Note that the Cragg & Uhler’s pseudo-R 2 is lowest for models with either particularistic or universalistic controls. We cannot interpret pseudo-R 2 as we can R 2, but note that models with controls only or with independent variables only have approximately equal value of this coefficient. With a combination of variables, and in a model with significant variables only (Model 8), pseudo-R 2 is the highest. Also, elimination of nonsignificant variables from the model (difference between models 7 and 8) results only in slight decrease of model characteristics (such as log likelihood, LR χ2, pseudo-R 2). Therefore, Model 8 appears to capture well the variables that affect citation counts: building new theory, method squared, number of references used in the article, and best university rank.
Additional analysis. In the last step of the modeling process, we examined whether the article type as created by the Colquitt & Zapata-Phelan (Reference Colquitt and Zapata-Phelan2007) typology is significant (Table 6). We used the same regression approach to model the impact of individual clusters on citation counts. To start, we used article types as factors and the “Builders” type as a baseline (Model 1). Since the choice of the base is arbitrary and can be dictated both by methodological and theoretical reasons, we have selected the type that showed the most differences with other types. Only “Expanders” were not significantly different from Builders; all other types showed lower numbers of citations in comparison.
The differential effect of these two types holds when both the particularistic and the universalistic controls are added (Models 2–3). However, when independent variables are added, none of the article types have significant effects (Model 4). Perhaps, this is because of collinearity: clusters already capture similarities between observations with respect to their Building theory, Testing Theory, and Method characteristics. However, this work confirms the observation made by Colquitt & Zapata-Phelan (Reference Colquitt and Zapata-Phelan2007) that with respect to article quality, it is the combination of characteristics that impacts the citations.
4.3 Exploring the “hard core” of Network Science: Descriptive network analysis
We turn next to the results of our attempt to answer the question poised by Brandes et al. (Reference Brandes, Robins, McCranie and Wasserman2013): is there a unity of a foundation in network science? Was the journal able to establish the Lakatos’ (Reference Lakatos1968) “hard core,” which is indicative of the journal’s solid contribution to the development of its field?
Figure 3 shows the distribution of the number of keywords in the words co-occurrence network,
![]() $nWKryx.$
Most articles cite from four to 29 words. Figure 4 shows the frequency with which words appear in the data set. Large numbers of words are mentioned one (691), two (196) or three (93) times (Figure 4). So, apparently, many keywords are unique—they are rarely used. At the same time, there are words that are used extensively, reflecting the core theories and methods used in Network Science journal. While this result is expected, it serves as a validity check of data used in the analysis.
$nWKryx.$
Most articles cite from four to 29 words. Figure 4 shows the frequency with which words appear in the data set. Large numbers of words are mentioned one (691), two (196) or three (93) times (Figure 4). So, apparently, many keywords are unique—they are rarely used. At the same time, there are words that are used extensively, reflecting the core theories and methods used in Network Science journal. While this result is expected, it serves as a validity check of data used in the analysis.
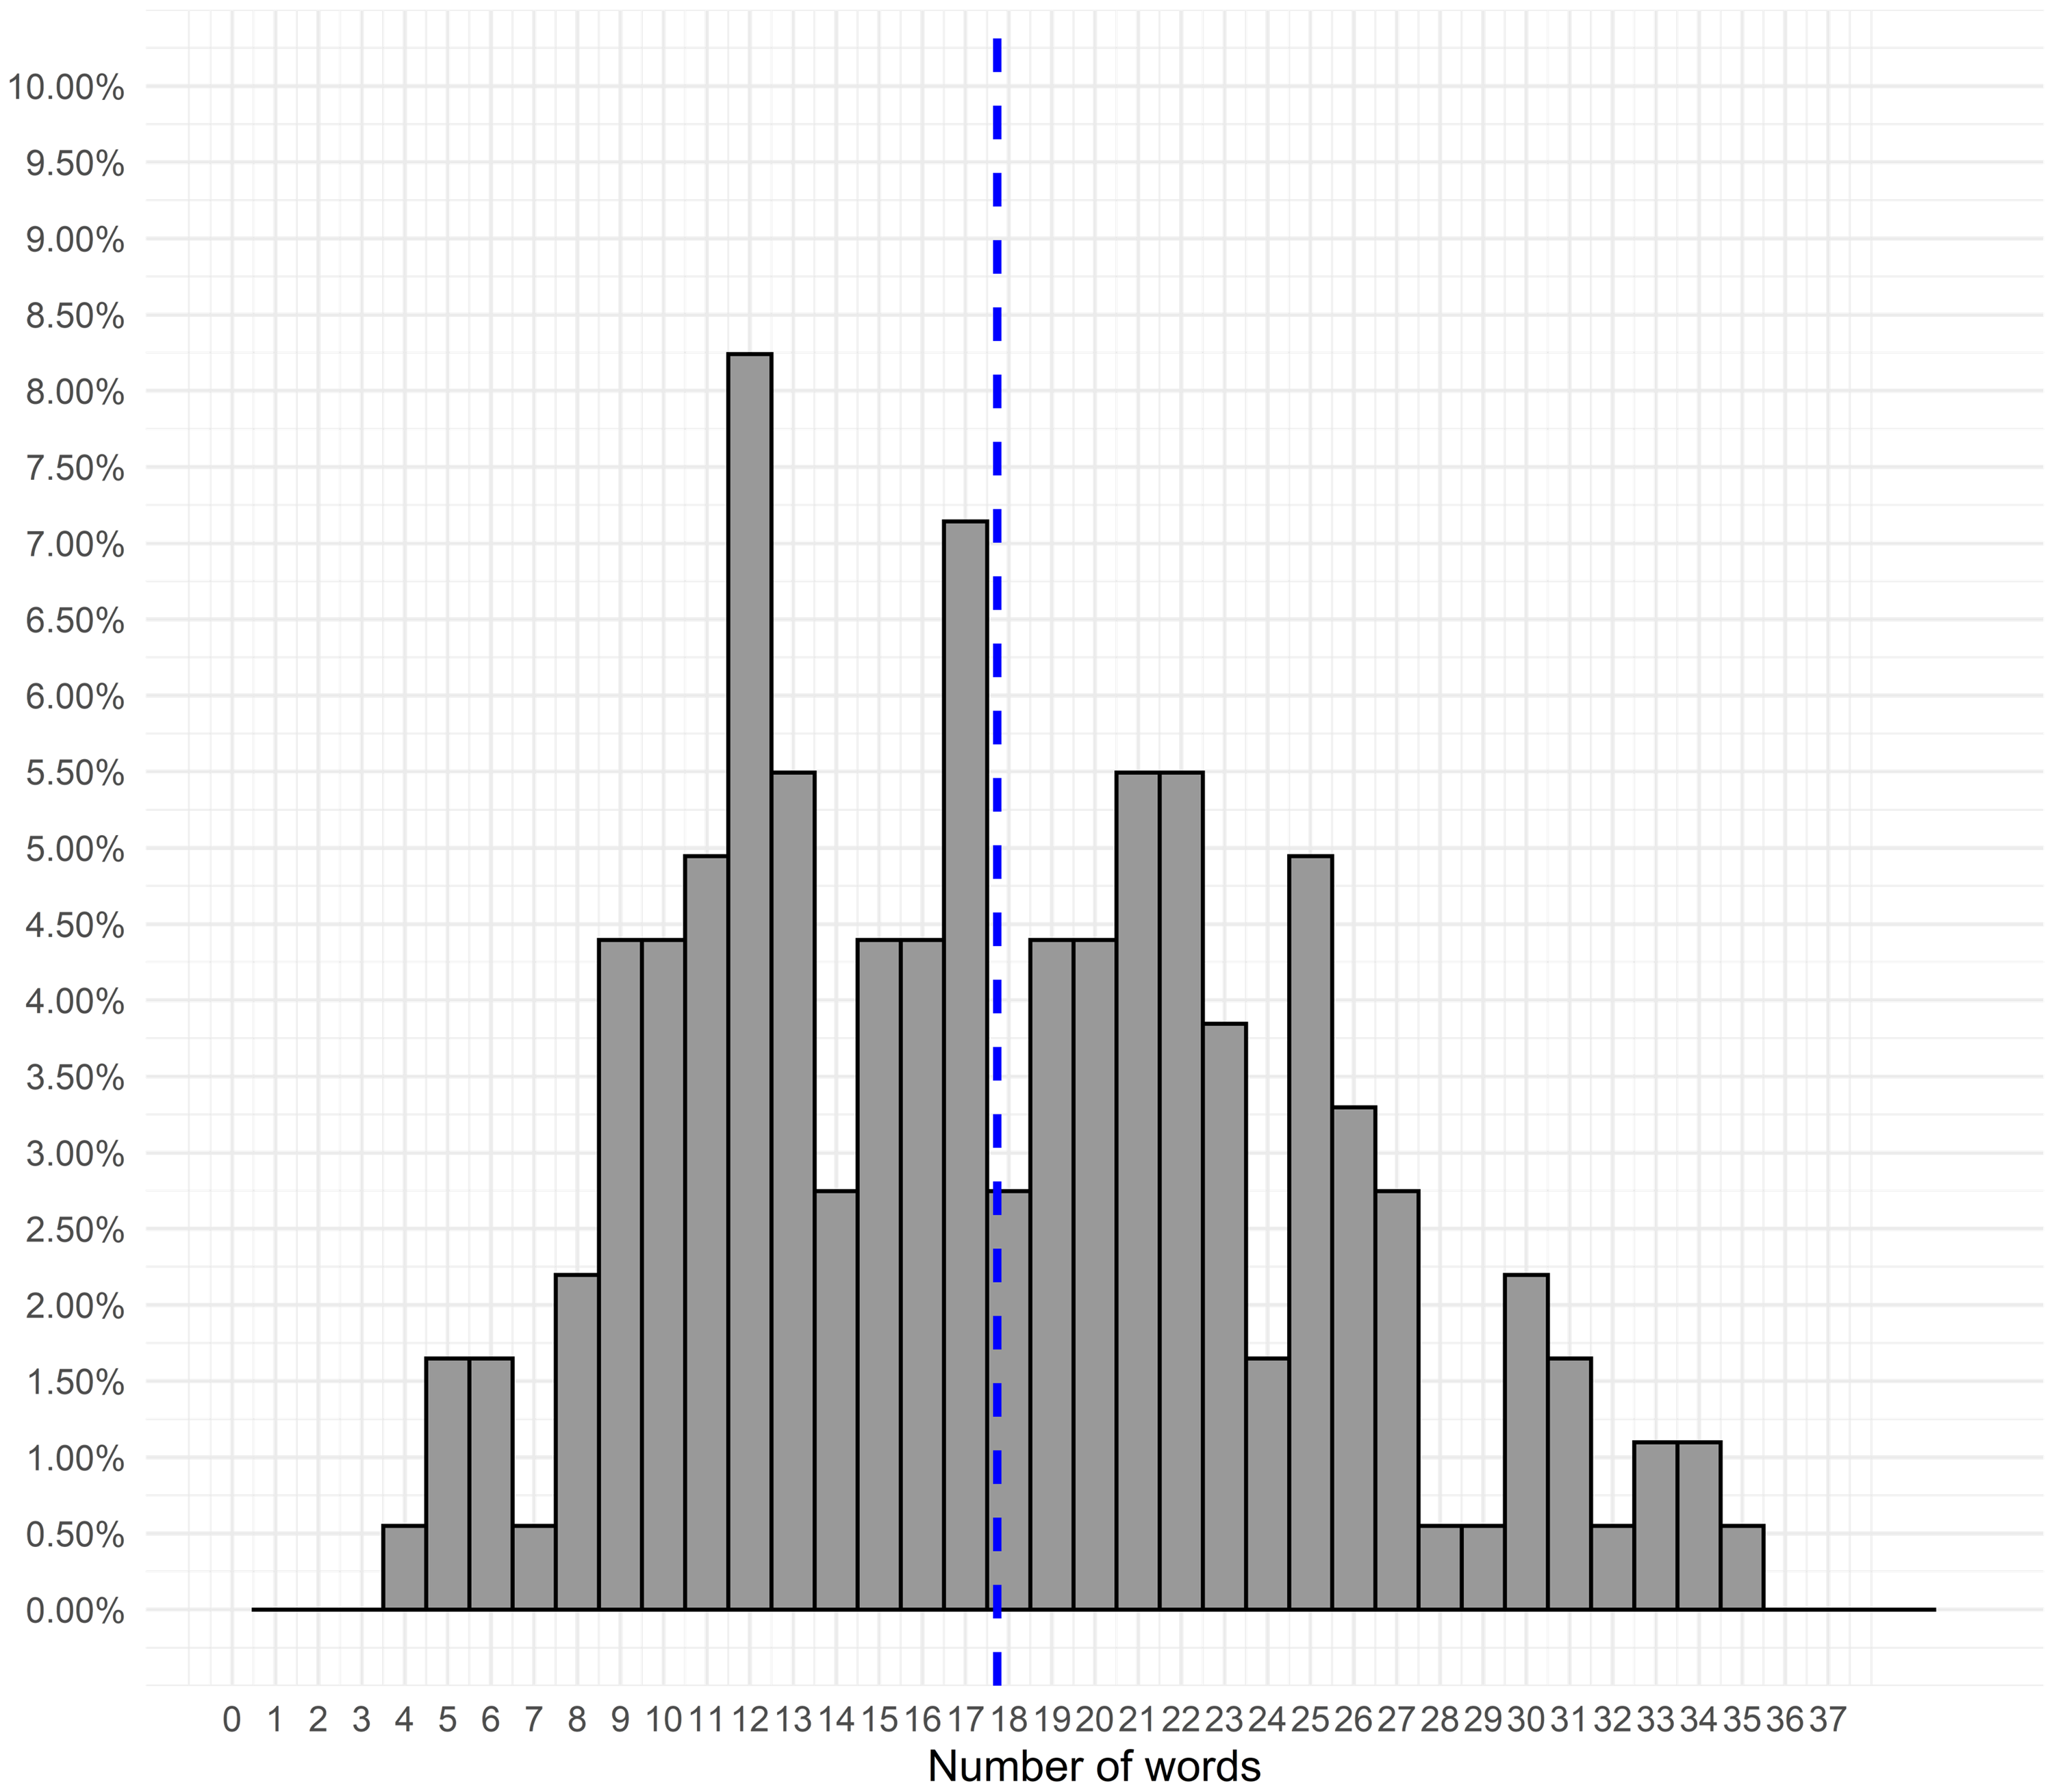
Figure 3. Histogram of the number of words per article (nWKryx).
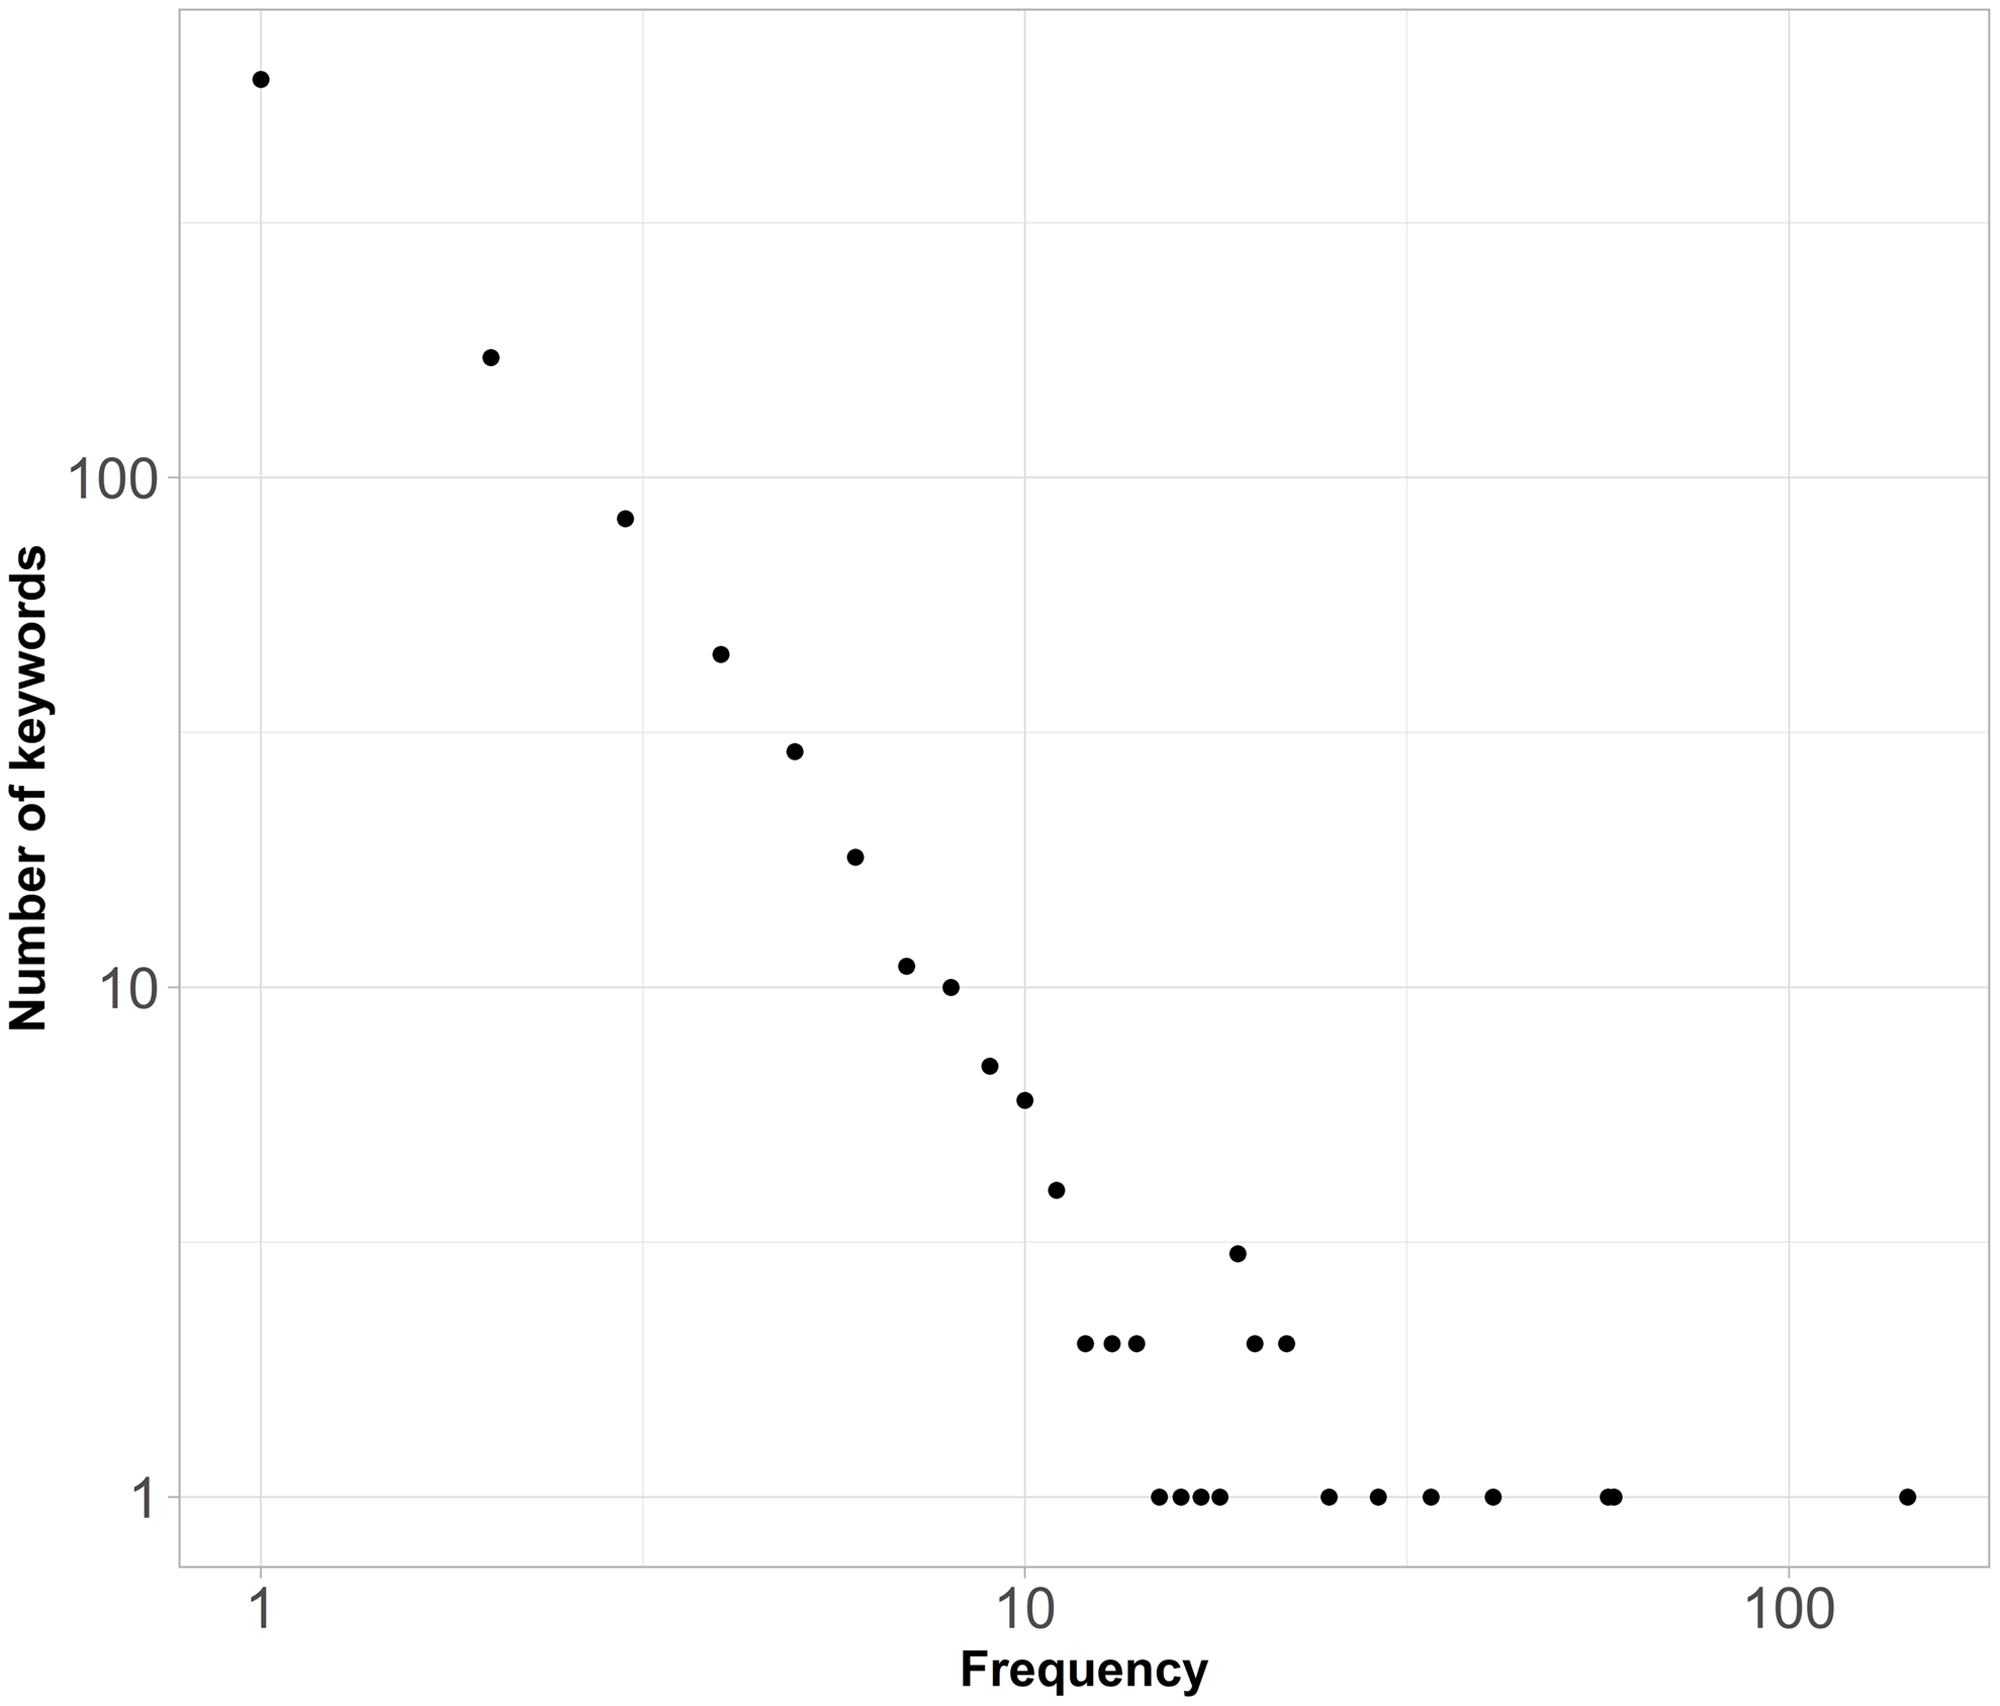
Figure 4. Logarithmic plots with distributions of the number of words used in all articles (nWKryx).
An exploratory analysis showed that in the words co-occurrence network (
![]() $nKK$
), the most frequent words that are used together with others are “network,” “social”, “model”, “dynamics,” “structure,” “graph,” “analysis,” “community,” “datum,” and “time” (Table 1S in Supplementary Materials). To separate the words used in a wider context (such as “analysis”) from those used in a narrower context (such as “graph”), we compared words used in the largest number of articles with words used most frequently in combination with others. Table 1S contains top-60 words of two networks: the words co-occurrence network (
$nKK$
), the most frequent words that are used together with others are “network,” “social”, “model”, “dynamics,” “structure,” “graph,” “analysis,” “community,” “datum,” and “time” (Table 1S in Supplementary Materials). To separate the words used in a wider context (such as “analysis”) from those used in a narrower context (such as “graph”), we compared words used in the largest number of articles with words used most frequently in combination with others. Table 1S contains top-60 words of two networks: the words co-occurrence network (
![]() $nKK$
) and articles-to-keywords network (
$nKK$
) and articles-to-keywords network (
![]() $nWKryx$
).
$nWKryx$
).
Several words (underlined in the table) are present in a relatively small number of articles, yet are connected to a large number of other keywords (“individual,” “organizational,” “perception,” and “activity”). They are the wider-context words, meaning that by looking at each word in isolation, it is not possible to correctly infer the topic of the study. For example, the word “activity” may indicate a network methodological topic—“dimensions of tie activity,” and can also be related to an applied topic—“extracurricular activity.”
Words that appear in bold in Table 1S are the keywords of a narrow context—they are present in a relatively large number of articles, yet are connected to a smaller number of other keywords (“topology,” “pattern,” “distribution,” “world,” “epidemic,” “matrix,” “blockmodel”). They delineate more narrow topics. For example, the word “blockmodel” in a network study most likely relates to one of several methods of network clustering. This is another confirmation of data validity.
Figure 5 presents a visualization of words co-occurrence network with 1,187 nodes; these are all the words that are obtained from keywords and titles of Network Science. The font size is directly proportional to the number of articles that use these words.
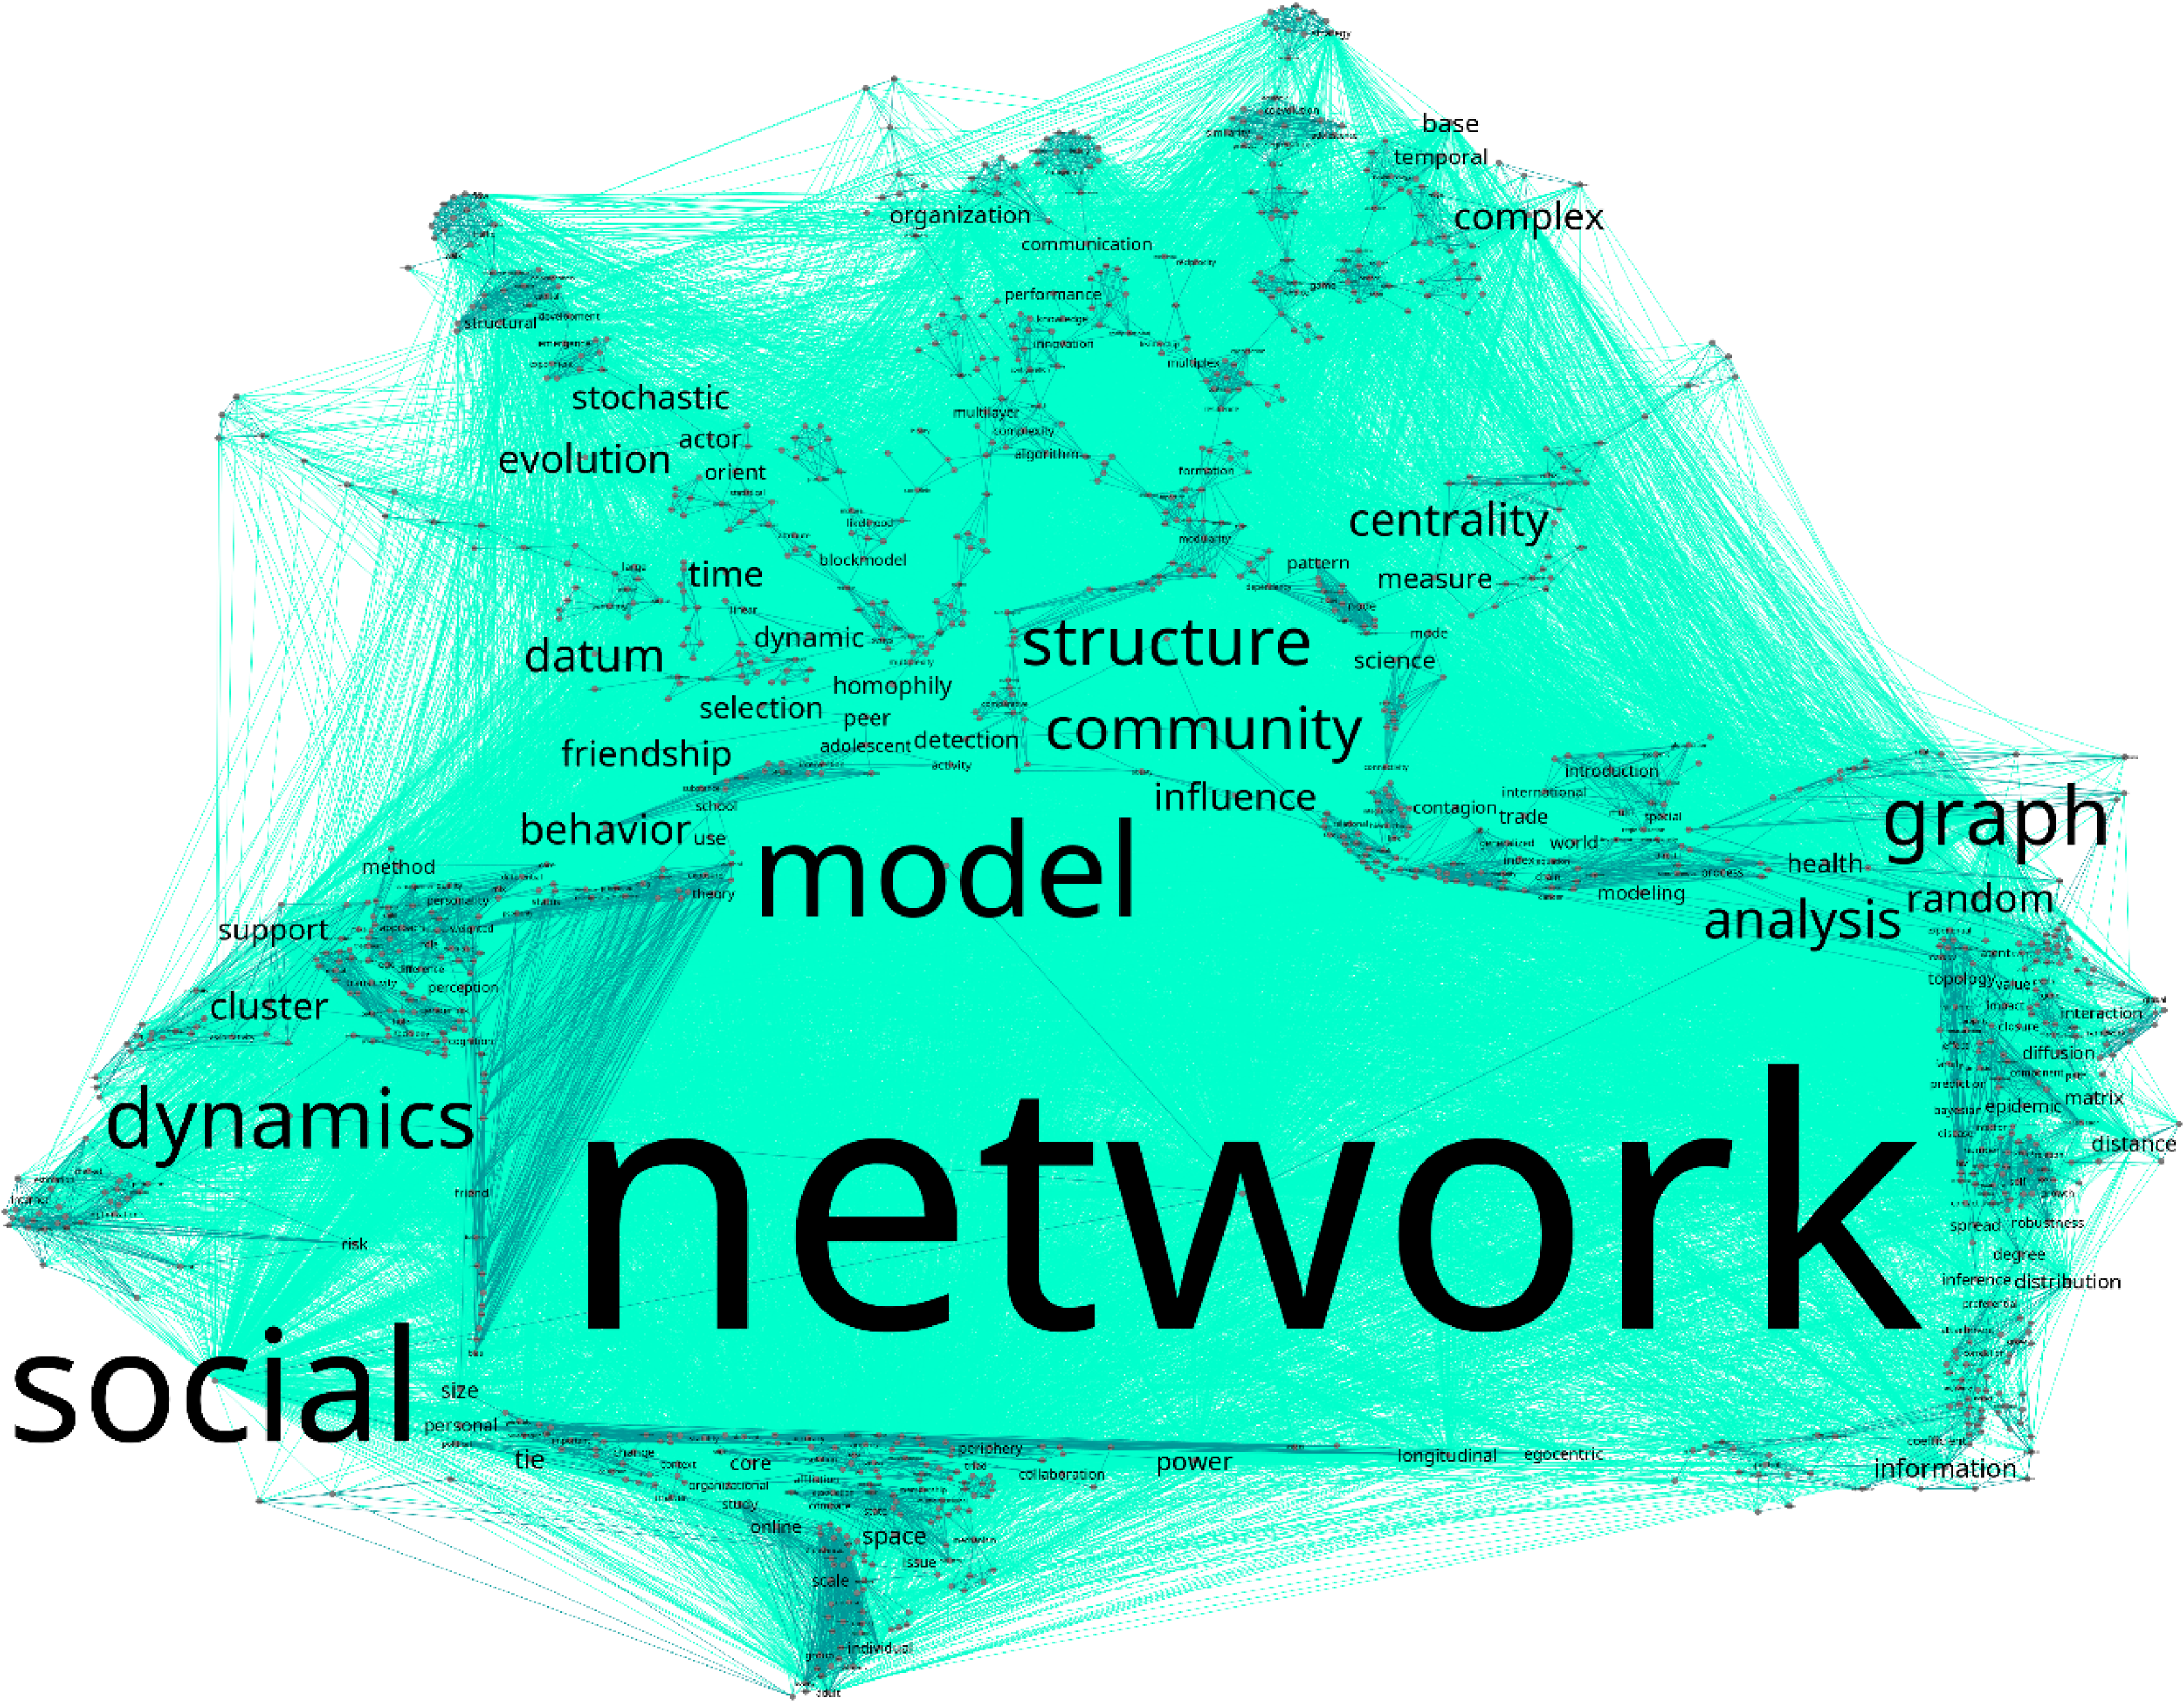
Figure 5. Words co-occurrence network (nKK).
As is apparent from Figure 5 and perhaps, not surprisingly, the most often used and connected word is “network.” It creates a number of important dyads, such as “network model,” “network graph,” and “social network,” each of which could be considered a separate topic or even a subfield within the “hard core” of the journal. Some of these topics are related to the methodology of network science (graph theory, centrality measures, random and stochastic graphs, cluster analysis, community detection), while others—to application of network methods in various contiguous disciplines (social behavior, friendship, and power analysis). Also, quite apparent are the combinations of theory and methods in network science that create separate model groups (social influence, social selection).
4.4 Clustering the “hard core” of Network Science: Islands
To further examine the composition of the “hard core” of Network Science, we use the islands approach (De Nooy et al., Reference De Nooy, Mrvar and Batagelj2018, p. 127; Batagelj et al., Reference Batagelj and Cerinšek2013, p. 54). This method is widely used in scientific networks and has demonstrated excellent results with respect to detecting scientific schools in many disciplines (Doreian et al., Reference Doreian, Batagelj and Ferligoj2020).
Since the study is largely exploratory, the choice of the number of cuts, which would separate the islands, was made based on the plots of changes in the number of possible islands against the maximum cut sizes (Figure 6). The minimum cut was determined based on the distribution of the number of words per article (Figure 3). Since approximately two-thirds of articles contained between 4 and 21 words, we explored a variety of different cuts, but considered further only the 4, 5, 6, 7, 8, and 9 cuts as they provided more than one island.
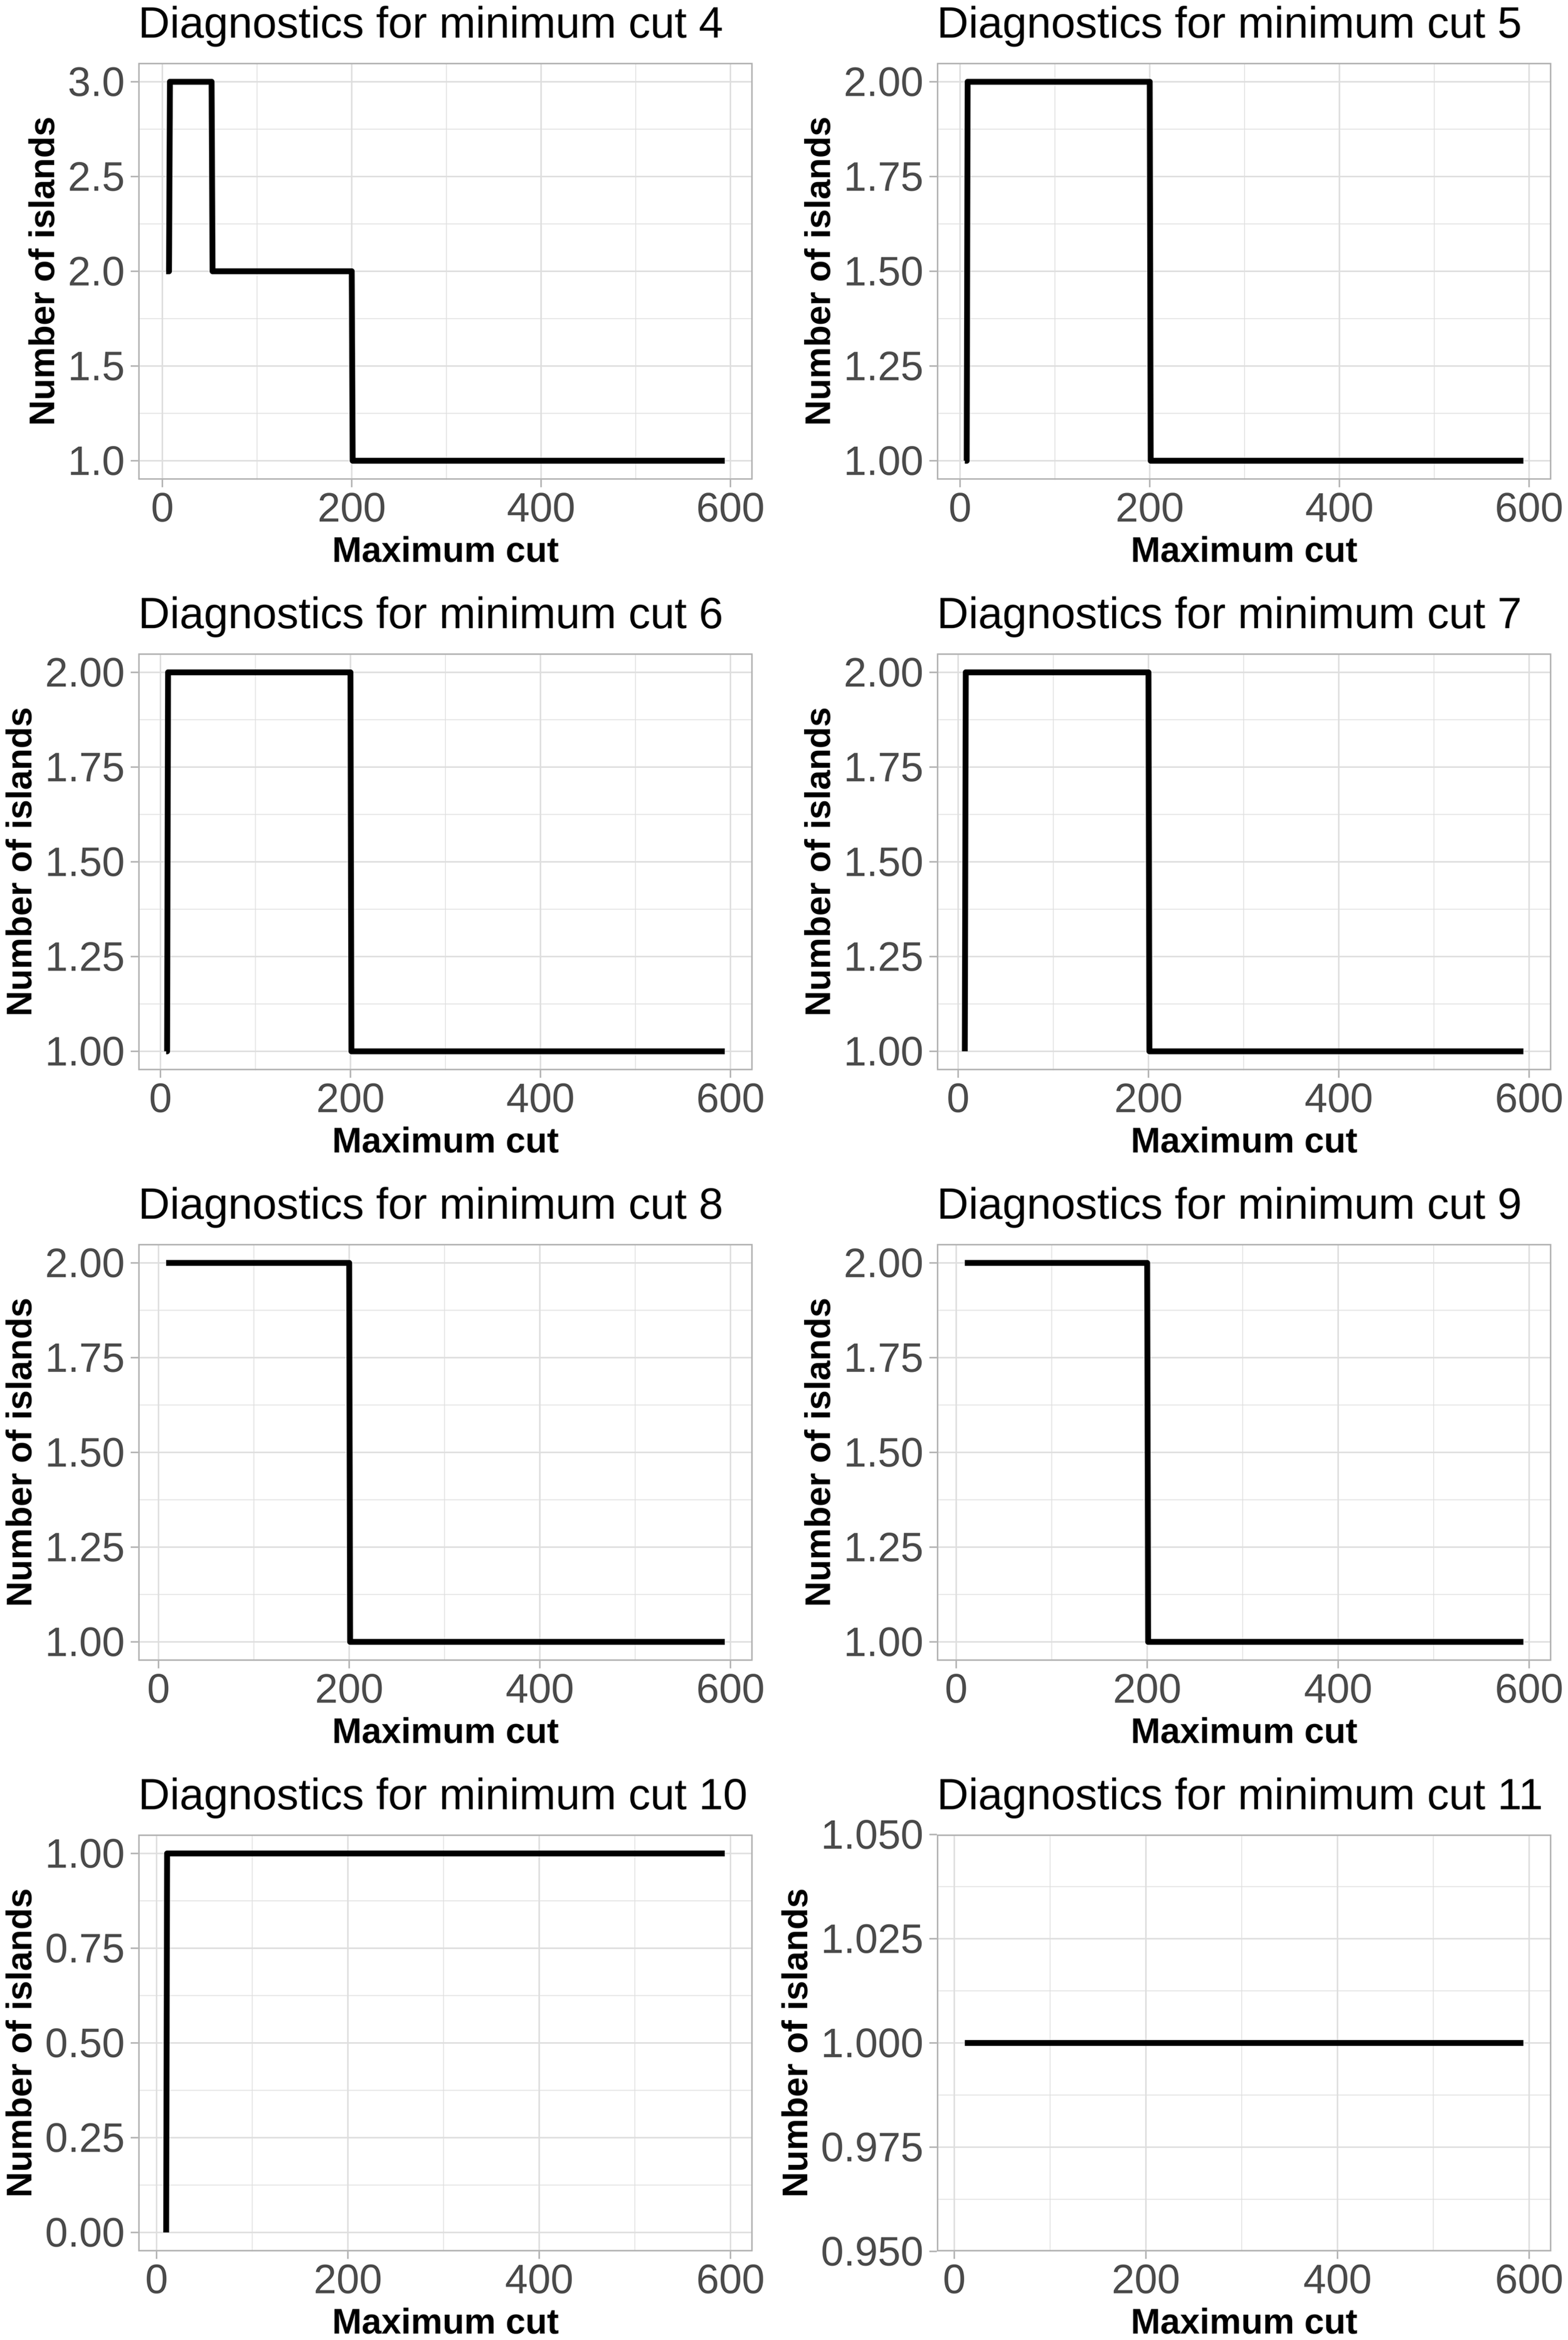
Figure 6. Plots of changes in the number of islands against the maximum cut sizes.
To obtain islands of reasonable size, we have considered a minimum cut of four and maximum cut with 52 words. As a result, the sizes of resulting components ranged from 4 to 49 nodes, allowing to cluster the words co-occurrence network ( nKK) into three islands. The main island contains 49 nodes (Figure 7); other smaller islands contain 4-9 words each (Table 2S of Supplementary Materials). These smaller islands represent narrow topics, more representative of other disciplines, but using network methodology. They can be described by the following keywords: “generation, sampling, note, chain, drive, respondent, recruitment, end, stickiness;” “epidemic, global, infection, tree.”
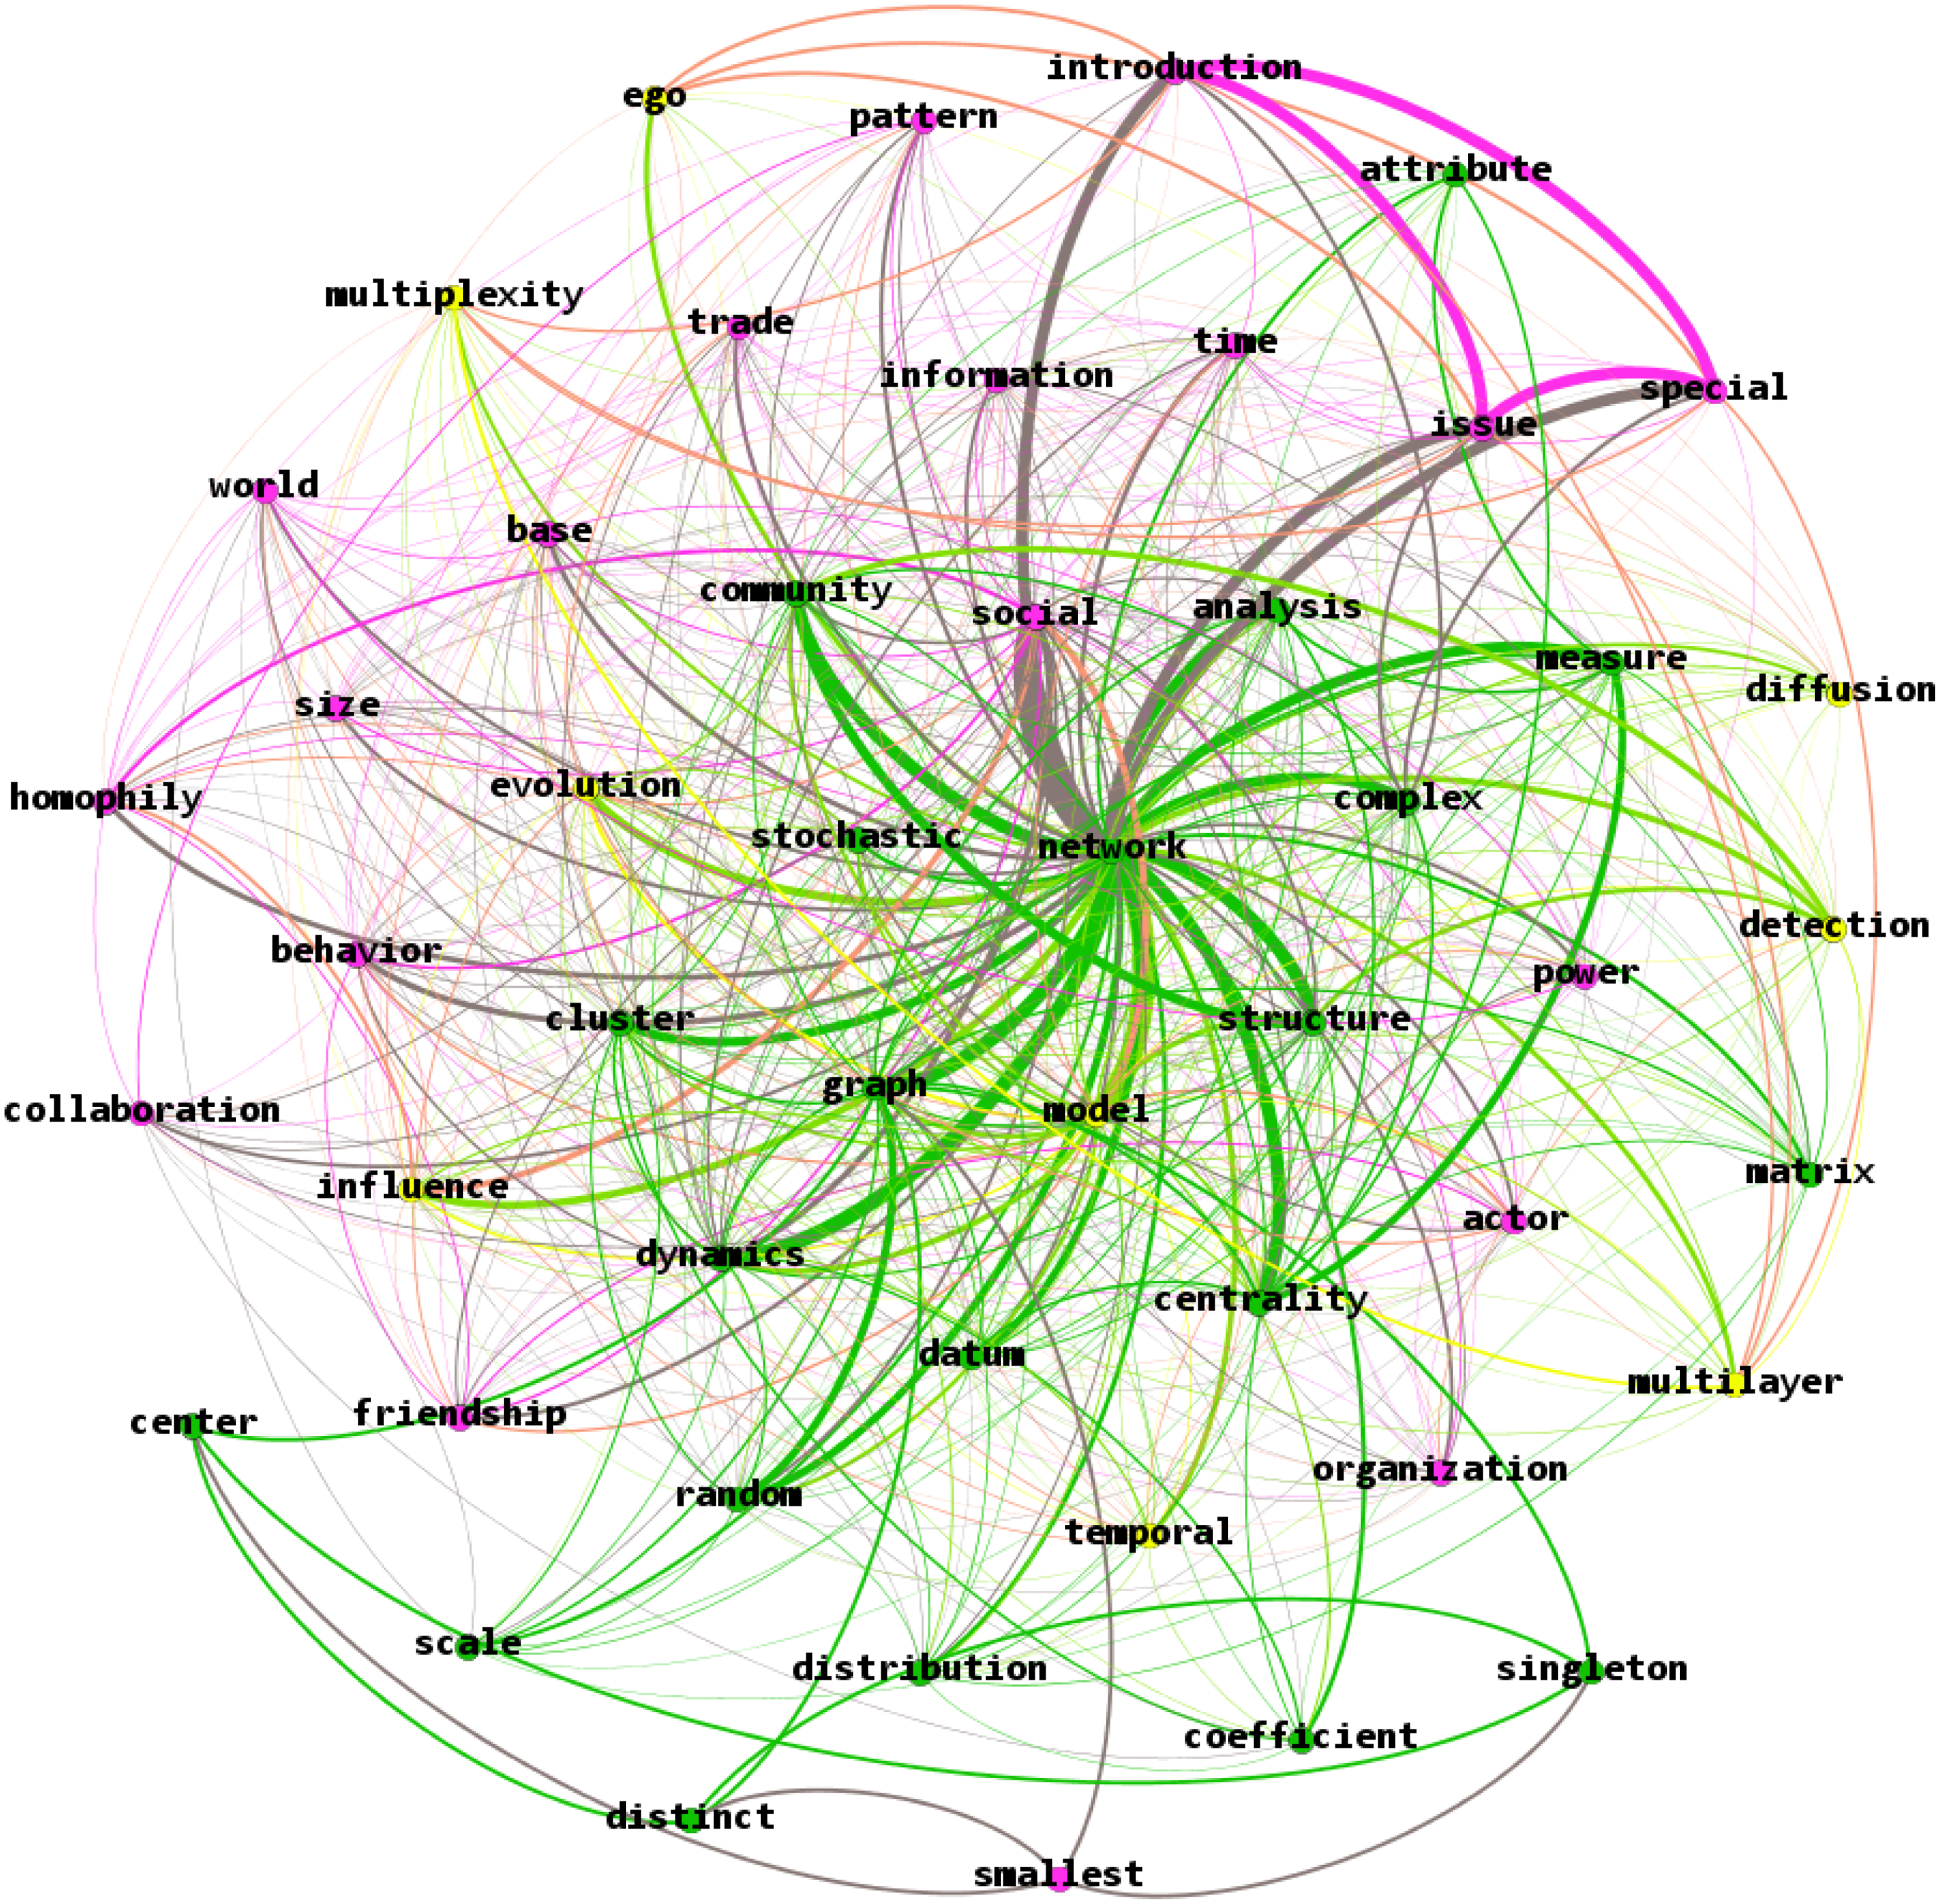
Figure 7. Main island of the words co-occurrence network (nKK).
As for the two small islands (Table 2S of Supplementary Materials), despite the wide variety of topics, they are similar due to their small number of articles in general. These topics are new for network science, but quite likely, very promising for future expansive research. The first island contains words “generation, sampling, note, chain, drive, respondent, recruitment, end, stickiness” and represents studies that are using a variety of sampling approaches. The second island contains words “epidemic, global, infection, tree” and represents studies that apply network methodology to understand spread of epidemic disease.
The main island is represented in Figure 7. It appears that this island represents the “hard core”—core topics in network science. The core of the island—“network, model, social” is located in the very dense center of the network.
The “hard core” of network science is represented by theory and methodology of network analysis. Perhaps, this was expected in line with Lakatos (Reference Lakatos1968) theorizing of what a “hard core” is, and Brandes et al. (Reference Brandes, Robins, McCranie and Wasserman2013) proposition of what network science represents. However, this analysis confirms both notions. First, the unquestionable tenets of network science are represented by the methodology of relational data analysis (highlighted in green in Figure 7). This makes network science the methodology-driven interdisciplinary field of study. The periphery of the island—the “protective belt” of Lakatos (Reference Lakatos1968) consists of various applications of network methodology.
There are two types of these applications. The first type is the applied network research in the diverse fields, highlighted in pink in Figure 7. From the relationships between the most frequent keywords, it is apparent that networks are applied to social psychology for the study of friendship and homophily; in sociology—for the study of actors and their collaboration; in political science—for power distribution and understanding international relations; in economics—for the study of trade; in management—organization. The second type of application in the “protective belt,” shown in yellow in Figure 7, is the mathematical application of network studies by the way of creating models.
This result is more impressive than could have been expected: there is indeed a core formed by theory and methodology of network analysis. But the “protective belt” consists of two layers after the core—making it a nested structure. It appears that network science develops from mathematics of graph theory to various complex models, which are then used in a variety of disciplines.
5. Discussion
The purpose of this study was to examine the contribution that Network Science journal, one of the newest and a flagship journal in the discipline, made to the network science field. Based on careful examination of existing studies, we have found a way to evaluate the journal going beyond the traditional impact factor score. Considering some of the newest methods of network analysis, we took a two-part approach to our study. First, and most importantly, we have examined all the Network Science articles published through 2020 for their universalistic characteristics, representing the contribution of the studies to the development of science. Second, we have applied the islands methodology to examine the presence of a “hard core,” the unity of a foundation for the studies in network science.
We have found that Network Science publishes articles that have high potential for the advancement of science in their respective disciplines. Over 50% of all studies have scored high on theoretical contribution. We have found a set of studies that are “pioneers” or “explorers,” with higher-than-average potential for significant contribution.
Since we are using the methodology of Colquitt & Zapata-Phelan (Reference Colquitt and Zapata-Phelan2007), a comparison with data presented in their study (the study of the Academy of Management journal, a typical top “applied” journal) indicates a different pattern of theory development by the Network Science journal: it is lower on the theory testing and higher on the theory-building dimensions. The referent study did not analyze the impact of the method, but apparently, in Network Science it is quite substantial, with an average article suggesting at least the new metric. Also, a departure from the analysis of an applied journal, method correlates positively and significantly with building theory, but negatively with testing theory. This means that when the Network Science article builds a new theory, it is doing so by using more rigorous methods. Theory building and theory testing dimensions have no correlation with each other, meaning that the study does either one or the other, but not both—also a departure from the applied journal.
We also found it interesting that when analyzing contribution of article types to citations, our results indicated that “Builders” and “Expanders” were not significantly different from each other, but all other article types had lower citations than “Builders.” This includes two new types that we have identified in this study—“Pioneers” and “Explorers,” which differ by introducing more rigorous methods in addition to theoretical contribution. While it may be tempting to say that articles with more difficult methods are cited less, even when they are theoretically rigorous, it is too early to do so. First, the sample size for this analysis is too small—there were only six “Explorer” articles, for example. Second, the journal is still too new, and later research could examine the effect of these article types with more data.
Our second contribution is development of a method for evaluating methodological impact of a network-analytic study. Since network analysis is a field where the method is paramount, having a measure that can assess the article’s methodological novelty helps evaluate its overall contribution to the field. Moreover, we found that the impact of the Method variable is not linear: articles that introduce highly sophisticated methods are less likely to be cited. Whether this is because they are too complex for the average audience to understand or too narrow in their application remains a subject for further study.
We have also found that the “unity of a foundation” of the network science field, theorized by Brandes et al. (Reference Brandes, Robins, McCranie and Wasserman2013), does indeed exist, established by the Network Science journal in a relatively short period of time. The “hard core” of Network Science consists of network analysis methods; the protective belt—of applied studies and mathematical network-analytic models. While this may seem like a commonsense conclusion, it is actually not so. First, Brandes et al. (Reference Brandes, Robins, McCranie and Wasserman2013) were cautious in their definition, not firmly specifying the unifying foundation. It was entirely possible that the main island may not have been isolated by our study; the field could have consisted of a large number of disconnected components, each in their own isolated discipline. There are only two small islands with very specific, narrow topics; the entire field could have been that fragmented. Second, we have found that the “protective belt” is a two-layer structure, showing the evolution of the field’s development. These findings provide solid evidence for the existence of the “hard core” in the new science that Network Science journal is helping advance. And that, in fact, is its contribution, measured much beyond a simple impact factor.
6. Limitations and directions for future research
This study has several limitations. First, the sample size is too small, and the span of the study is too short. The journal is not yet ten years old, and in most disciplines, it would be still considered a new journal. As a result, most trends and tendencies, available for examination using the universalistic approach to article impact, were not found to be statistically significant in this study. Perhaps, a replication in several years is warranted. Second, having isolated different article types similar to Colquitt & Zapata-Phelan’s (Reference Colquitt and Zapata-Phelan2007) study, we could have attempted to create islands for different types. Doing so would have made the study much more complex, hardly fitting into the scope of one article. We leave it as one of possible venues for future research.
Another very important limitation is that we used articles’ citations as a proxy for journal impact. Moreover, having assumed that article citations reflect journal impact, we then tested the factors that predict the number of articles’ citations. This represents a leap from factors affecting the number of article citations to journal impact, without evaluating how the number of citations influences the impact of the journal. While many measures of journal impact are based on article citations, there is a clear agreement in the literature that citation-based measures of journal impact are, at best, incomplete. Given that we have also analyzed the “hard core” of Network Science, we believe we have established the impact of the journal on the field, even with a leap from article citations to journal impact. However, future research could examine journal impact using some alternative measure.
We clearly see several key research directions for further study beyond the mere replication. First, a more substantive examination of citing and cited journals for Network Science articles would help understand the interdisciplinary relationships and the impact of the journal on other disciplines. Second, the coevolution of the journal and the field—citation trends over time—could provide some insightful information into how the field of network science is developing. It would be also interesting to see whether the advanced modeling techniques (for “pioneer” and “explorer” article types) allow some of the applied fields to develop breakthrough ideas. Most certainly, this is a possibility for such fields as medicine and epidemiology, sociology and political science, environmental studies, and many others. With the current trends in theory building and high-quality methodology development, Network Science appears to be more than just the flagship journal. It provides the necessary tools—theory and methodology—for expanding the boundaries of interdisciplinary research and advancing science in all contiguous disciplines.
Another possible route of improvement is through the use of more modern text processing techniques. First, it would be beneficial to focus on key phrases instead of keywords, as this would allow us to better interpret the meaning of the networks and to create more accurate maps of existing schools of thought. The second important improvement that can be made in that regard is by using a better technique for text preprocessing, for example, using a better algorithm for lemmatization and stopword removal. For example, a phrase detection algorithm could be applied to the data in order to extract the phrases that commonly appear in the dataset rather than individual words (e.g. community detection, actor-oriented model). An example of such an algorithm based on the research of Mikolov et al. (Reference Mikolov, Sutskever, Chen, Corrado and Dean2013) and Gerlof (Reference Gerlof2009) is implemented in the Gensim Python library. However, comparison of the performance of different methods of lemmatization and text preprocessing in general is outside the scope of this study and remains the subject of future work.
Yet another possible revenue for future research on the topic is the use of community detection algorithms that are designed to work with bipartite networks, e.g. the algorithm proposed by Zhang & Ahn (Reference Zhang and Ahn2015). Comparison of different methods of community detection when applied to bibliometric networks, and all other mentioned improvements, could help advance the “Science of science” on its quest to evaluate journal quality.
Competing interests
None.
Supplementary materials
For supplementary material for this article, please visit https://doi.org/10.1017/nws.2022.41

