


Poor preoperative nutritional status has negative effects on postoperative outcomes, including increased postoperative complications and prolonged hospital stay(Reference Kanemoto, Ida and Naito1–Reference Gn, Abdullah and Loke3). The European Society for Clinical Nutrition and Metabolism recommends that the preoperative nutritional status of older patients should be assessed using the Mini Nutritional Assessment Short-Form (MNA-SF)(Reference Kaiser, Bauer and Ramsch4,Reference Kamperidis, Tesser and Wolfson5) .
A recent consensus statement proposed that patient-reported outcome measures collected directly from the patient should be included as a benchmark for postoperative recovery and recommended the use of the Quality of Recovery-15 (QoR-15), especially in the immediate postoperative period(Reference Abola, Bennett-Guerrero and Kent6). The association between various anaesthetic, surgical, and patient factors and QoR-15 has been investigated(Reference Wessels, Perrie and Scribante7). For instance, laparoscopic surgery improved the QoR-15 score v. laparotomy(Reference Cohn, Castellon-Larios and Huffman8), and women were likely to have worse QoR-15 scores than men(Reference Buchanan, Myles and Cicuttini9). The preoperative nutritional status is a measure of biological age and is potentially modifiable if recognised, but the impact of preoperative nutritional status on postoperative quality of recovery remains unclear.
We hypothesised that poor preoperative nutritional status would have deleterious effects on postoperative recovery and aimed to evaluate the following: (1) the effect of preoperative nutritional status on the QoR-15 score after surgery; (2) the differences between the preoperative nutritional status groups in the mean values of each item in the QoR-15 on postoperative day 2 (POD 2); and (3) the association between preoperative nutritional status and length of hospital stay post-operation.
Material and methods
Ethics
This study was conducted according to the guidelines laid down in the Declaration of Helsinki, and all procedures involving human subjects/patients were approved by the Nara Medical University Institutional Review Board, Kashihara, Nara, Japan (approval number 2975, 28 April 2021). The written informed consent was obtained before enrolment by all enrolled patients.
Patients
This study was a planned secondary analysis of a prospective observational study conducted from 1 June 2021 to 7 April 2022 at Nara Medical University Hospital (Kashihara, Nara, Japan). Our initial study analysed the data of 230 patients aged ≥ 65 years who were scheduled for elective abdominal surgery (general, urological or gynaecological). Initially, we aimed to assess the association between postoperative quality of recovery and disability-free survival. Exclusion criteria were poor Japanese comprehension, dementia, psychiatric disease requiring treatment, palliative surgery or a planned postoperative hospital stay < 3 d. This secondary analysis included all 230 patients included in our initial study.
Quality of Recovery-15
The QoR-15 was designed to rapidly assess the recovery process after surgery or anaesthesia in a daily practice, and the Japanese version has been available since 2021(Reference Stark, Myles and Burke10,Reference Nakatani, Ida and Tanaka11) . The QoR-15 consists of fifteen items, including respiration, rest, well-being, pain, nausea and mental health, with a total score ranging from 0 to 150. Higher scores indicate a higher quality of recovery(Reference Stark, Myles and Burke10). In this study, QoR-15 was assessed four times: the day before surgery, and at POD 2, POD 4, and POD 7. Patients discharged on the day of assessment were evaluated by telephone, and their responses were recorded.
Data collection
Patient demographics, co-morbidities, daily medication, laboratory data, handgrip strength, frailty and nutritional status were assessed. The grip strength of the patient’s dominant hand was measured three times in succession using a digital Jamar hand dynamometer (MG-4800 MORITOH, Aich, Japan), and the maximum value was used as the result. The Fried Frailty Phenotype Questionnaire, which includes five domains (fatigue, resistance, ambulation, inactivity and weight loss) with a total score ranging from 0 to 5 points, was used to assess preoperative frailty(Reference Chen, Chen and Kishimoto12). Nutritional status was assessed using the MNA-SF, with a total score ranging from 0 to 14 points (normal, 12–14 points; at-risk, 8–11 points; and malnourished, 0–7 points). In this study, patients with a total score of less than 12 points, that is, at-risk and malnourished, were defined as having a poor nutritional status. Intraoperative data, including anaesthetic agents, surgical field, postoperative analgesia, surgical duration, and blood loss volume, were also collected.
Outcomes
The primary outcome of this study was the QoR-15 score on POD 2. The secondary outcomes were the QoR-15 scores on POD 4 and 7 and the length of stay post-operation.
Statistical analysis
Continuous data are presented as medians (1st quartile, 3rd quartile), and categorical variables are presented as numbers (%). Univariate analysis was performed using the Mann–Whitney U test or Fisher’s exact test, as appropriate, comparing the normal and poor nutrition groups. The primary outcome of this study, the QoR-15 score, had a normal distribution and is presented as mean and standard deviation(Reference Stark, Myles and Burke10,Reference Nakatani, Ida and Tanaka11) and compared using an unpaired t test. Additionally, repeated QoR-15 scores were analysed using linear mixed models with restricted maximum likelihood. Preoperative poor nutritional status, categorical time, and the interaction between poor preoperative nutritional status and categorical time were included in this model. The QoR-15 score is influenced by some factors; thus, we adjusted for the following clinically prominent covariates: age, sex, physical status by the criteria of the American Society of Anaesthesiologists (ASA-PS), surgical field, surgical procedure, surgical duration, blood-loss volume and postoperative analgesia. The scores for each QoR-15 item on POD 2 were also compared using an unpaired t test. The partial regression coefficient of the preoperative poor nutritional status to the QoR-15 score on POD 2 was calculated using multiple regression analysis with and without adjusting for the above prominent factors. Before performing the multiple regression analysis, multicollinearity among the above variables was assessed, and variables with a variance inflation factor of > 5 were excluded. Because the MNA-SF score is a continuous variable, a multiple regression analysis was used in the secondary analysis and was performed with and without adjustment for the prominent factors listed above. In the sensitivity analysis, the MNA-SF score was treated as a continuous variable. Because we analysed an existing dataset, the sample size used in this study was determined by that of our original study (n 230). As an alternative to an a priori sample size determination, we calculated the study power (1-β) using G*power v3·1 (Faul, Erdfelder, Lang, & Buchner, 2007) with the requirements: type I error probability (α) = 0·05 and effect size = 0·5 (large effect size). With these parameters and the number of existing patients (normal group = 152 and poor nutrition group = 78), the power was 93·7 % to show a difference. Missing data points were not imputed. All data were analysed using IBM SPSS Statistics (version 25.0; IBM Corp.), and statistical significance was set at P < 0·05.
Results
Baseline data
In the 230 included patients, the median age was 73 years and men predominated (70·0 %). Based on the MNA-SF scores, 66 %, 26·9 % and 6·9 % of patients were classified as normal, at-risk and malnourished, respectively. Consequently, 33·9 % of the patients were included in the poor nutrition group. We observed significant intergroup differences in the following variables: sex, weight, serum albumin, serum creatinine, frailty score, grip strength, preoperative QoR-15 score, anaesthetic agents, surgical field, surgical procedure and surgical duration (Table 1).
Table 1. Patient demographics, surgical parameters and anaesthetics administered
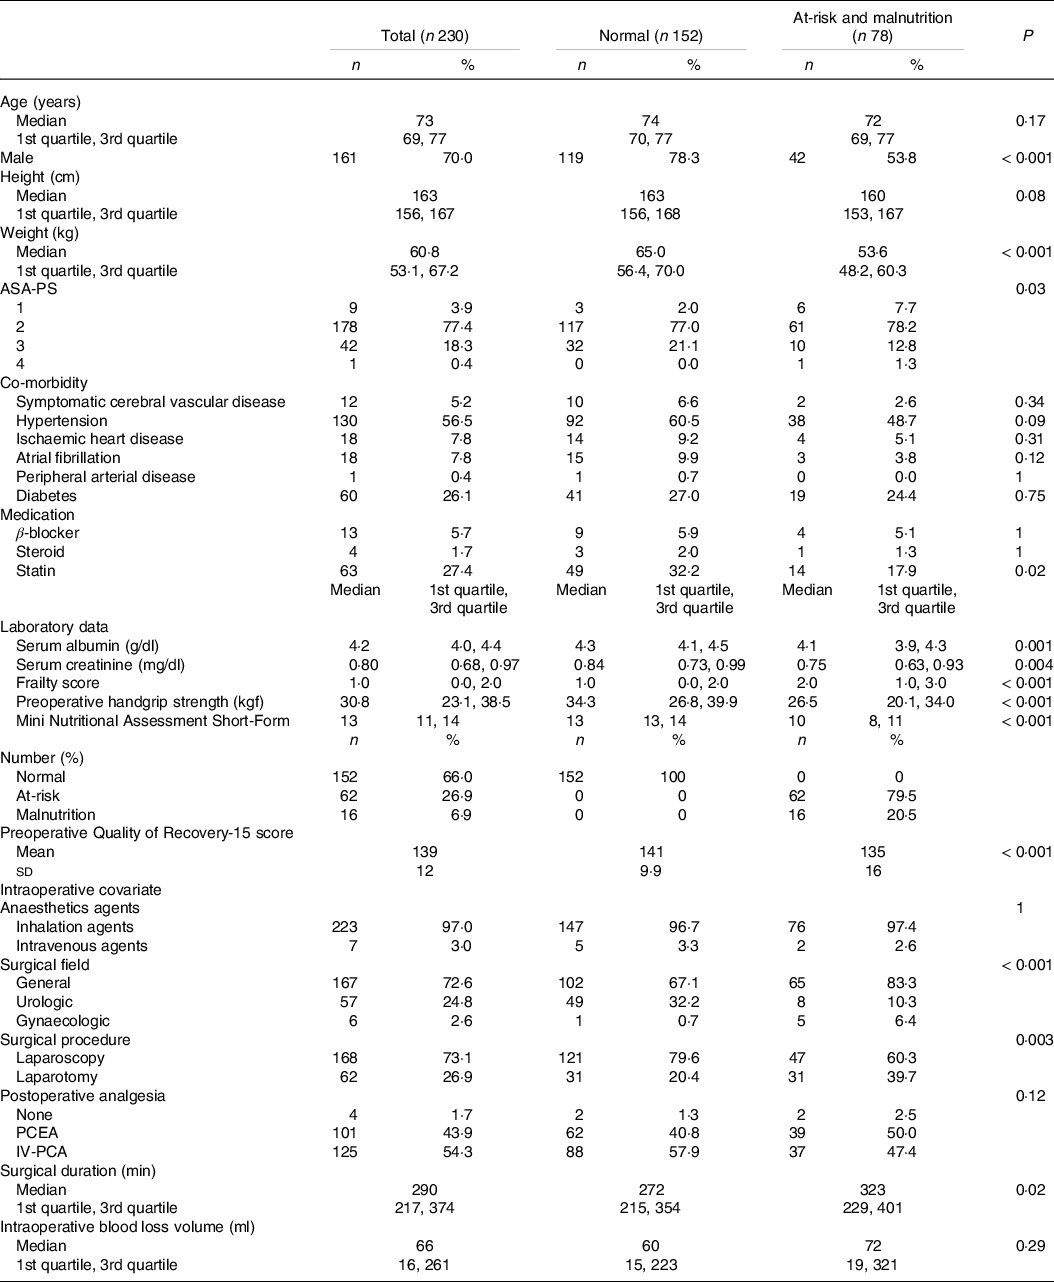
ASA-PS, American Society of Anesthesiologists physical status; PCEA, patient-controlled epidural analgesia; IV-PCA, intravenous patient-controlled analgesia.
Outcome data
Table 2 and Fig. 1 show the mean values of QoR-15 after surgery. The QoR-15 score increased with the postoperative course in both groups; however, the mean QoR-15 was significantly lower in the poor nutritional group than in the normal group at all postoperative time points. The linear mixed models showed statistically significant intergroup differences in the QoR-15 scores over time in both the unadjusted (P < 0·001) and adjusted models (P = 0·007).
Table 2. Outcome data
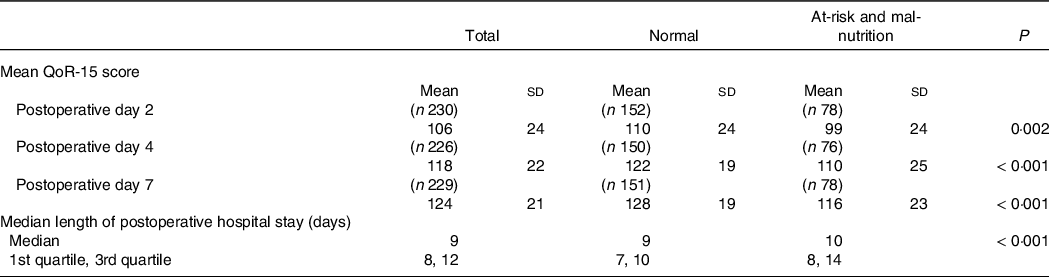
QoR-15, Quality of Recovery-15.
Mean and standard deviation or Median (1st quartile, 3rd quartile).
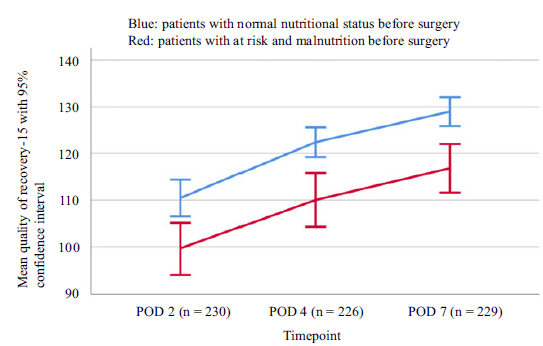
Fig. 1. Mean scores on Quality of Recovery-15 (QoR-15) v. preoperative nutritional status. POD, postoperative day. The test for significance was an unpaired t test.
At POD 2, the unpaired t test revealed significant differences in the following QoR-15 items: food, rest, hygiene, communication, return to work, feeling in control, well-being, anxiety and depression. However, at this time point, the mean values of the other items, including pain and nausea/vomiting, were not significantly different between the two groups (Table 3).
Table 3. Mean QoR-15 score on postoperative day 2 based on preoperative nutritional status
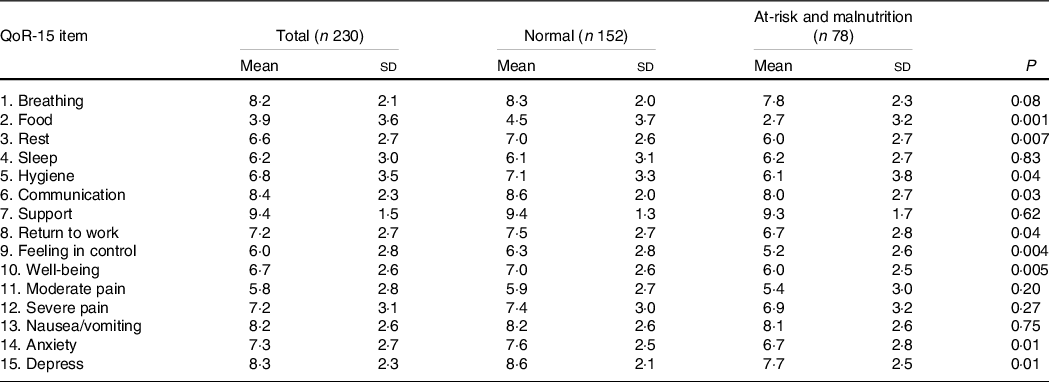
QoR, Quality of Recovery-15.
Mean and standard deviation.
The variance inflation factors between patient-controlled epidural analgesia and intravenous patient-controlled analgesia were 15·8 and 15·5, respectively; thus, intravenous patient-controlled analgesia was excluded from a multiple regression analysis, which decreased the variance inflation factor of patient-controlled epidural analgesia to 1·37. Multiple regression analysis showed that poor preoperative nutritional status was associated with the QoR-15 score on POD 2 (adjusted partial regression coefficient, −7·8; 95 % CI, −14·9, −0·72) even after adjusting for prominent factors (Table 4). A sensitivity analysis treating the MNA-SF score as a continuous variable revealed that a higher MNA-SF score increased the QoR-15 score on POD 2 (adjusted partial regression coefficient, 1·6; 95 % CI, 0·1, 3·0; online Supplementary Table 1). The poor nutrition group had a longer postoperative stay than did the normal nutritional group (P < 0·001; Table 2).
Table 4. Results of multiple regression analysis, treating the Mini Nutritional Assessment Short-Form score as a category variable

In the adjusted model, age, sex, American Society of Anesthesiologists physical status, surgical field, surgical procedure (laparotomy), surgical duration, blood loss volume and postoperative analgesia (patient-controlled epidural analgesia) were adjusted.
Discussion
We found that the QoR-15 score increased with time post-surgery, but patients with poor nutritional status before surgery had significantly lower postoperative QoR-15 scores than did those with normal nutritional status. In our cohort, the preoperative QoR-15 score was statistically different between the two groups at P < 0·001; however, the mean difference taking into account the first decimal point was 6·2 (141·8 minus 135·6), which was below both the traditional minimal clinically important difference of 8·0 and an updated minimal clinically important difference of 6·8(Reference Myles, Myles and Galagher13,Reference Myles and Myles14) ; thus, the observed difference is not clinically significant. Furthermore, because the QoR-15 was developed as a measure of postoperative recovery and therefore does not necessarily reflect the baseline value if administered preoperatively, the preoperative QoR-15 should be considered a reference value only(Reference Myles15,Reference Campfort, Cayla and Lasocki16) . Patients with poor preoperative nutritional status had lower QoR-15 scores at any postoperative measurement point (POD 2, 4 and 7), and poor preoperative nutritional status was also a significant factor at POD 2. The exact reasons are unclear, but they could be explained by the fact that patients with poor nutritional status might be vulnerable to surgical stress and anaesthetics, and that malnutrition increases the risk of developing muscle weakness, impaired immune function, depression, and functional impairment(Reference Mosquera, Koutlas and Edwards17–Reference Tsai20). Moreover, the MNA-SF can be used to assess physical frailty as well as serving as a comprehensive screening tool for nutritional status(Reference Soysal, Veronese and Arik21). Physical frailty is also linked to vulnerability to surgical stress and is known to have a negative impact on postoperative outcomes(Reference Li, Zhang and Yu22). These facts provide an alternative explanation of the results of this study.
The fact that the preoperative nutritional status affected the QoR-15 score on POD 2 is of interest. Previous studies have investigated the influence of patient factors such as age and sex on postoperative recovery; however, these are fixed factors(Reference Buchanan, Myles and Cicuttini9,Reference Myles, Weitkamp and Jones23–Reference Wessels, Perrie and Scribante25) . By contrast, poor preoperative nutritional status could be a potentially modifiable factor if detected before surgery. Furthermore, on POD 2, patients in the poor nutrition group had relatively low QoR-15 scores on items other than pain and nausea/vomiting. Although care givers are attentive to reducing postoperative pain and nausea/vomiting, which are frequent complications after surgery, our findings in this study suggest new targets for enhancing postoperative recovery.
This study had some limitations. First, we included only patients with cancer who underwent major abdominal surgeries at a single university hospital. Therefore, it cannot be generalised to other populations. Second, the sample size of this study was not calculated to support a secondary analysis. Therefore, the number of patients categorised as at-risk or malnourished was too small to provide sufficient power to analyse our primary outcome based on the three groups defined by the MNA-SF. This is mitigated by the fact that a multiple regression model that included the MNA-SF score as a continuous variable also showed a negative association between preoperative nutritional status and the POD 2 QoR-15. Third, this study did not present a causal relationship between preoperative nutritional status and postoperative QoR-15 scores; however, our findings did further emphasise the importance of preoperative nutritional assessment.
In conclusion, we find that cancer patients with poor preoperative nutritional status are more likely to have lower QoR-15 scores after abdominal surgery. Further studies are needed to investigate whether optimisation of preoperative nutritional status contributes to improved postoperative recovery.
Acknowledgements
None.
This work received no specific grant from any funding agency, commercial or not-for-profit sectors.
Y. K.: data collection; M. I.: study coordination, formulating the research question, study design, data interpretation and writing; S. N.: data analysis; K. U.: data collection; M. K.: data interpretation and writing – revision. All authors critically reviewed the manuscript and approved the final version for publication.
There are no conflicts of interest.
Supplementary material
For supplementary material/s referred to in this article, please visit https://doi.org/10.1017/S0007114523001046


