Nomenclature
- FBG
-
fiber Bragg grating
- fsFBG
-
Femtosecond Fiber Bragg Grating
- CFRP
-
Carbon Fibre Reinforced Polymer
- DRSN
-
Deep Residual Shrinkage Network
- DL
-
Deep Learning
- BP
-
Back Propagation
- CNN
-
Convolutional Neural Networks
- DCNN
-
Deep Convolutional Neural Networks
- DRN
-
Deep Residual Networks
- BN
-
Batch Normalization
- GAP
-
Global Average Pooling
- RBU
-
Residual Building Unit
- BN
-
Batch Normalization
- ReLU
-
Rectified Linear Unit
- Conv
-
Convolutional layer
- FC
-
Fully Connected Layer
- SENet
-
Squeeze-and-Excitation Networks
1.0 Introduction
Interlaminar delamination damage is a common and serious form of structural damage in carbon fiber-reinforced resin matrix composites. It significantly reduces the strength and stiffness of the composite structure, and adversely affects its structural integrity. In particular under external loads, delamination damage causes the structure to deteriorate, and may even lead to its sudden fracture in serious cases [Reference Li, Liu and Ni1, Reference Cheng2]. Therefore, investigating techniques to identify delamination damage in composite structures is important for enhancing their safety and reliability. Monitoring the overall condition of composite structures based on fiber Bragg grating (FBG) sensors has emerged a popular area of research on damage detection in composite materials in recent years [Reference Zhu, Xu and Yang3–Reference Gu9].
Zhu et al. [Reference Zhu, Xu and Yang3] used FBG sensors to detect internal damage in composite structures under low-frequency cyclic loading, and verified the feasibility and sensitivity of the sensors for identifying damage in composites. Okabe and Yashiro et al. [Reference Okabe and Yashiro4] used embedded FBG sensors to detect damage in perforated composite laminates under static and cyclic loading, and obtained the conditions for perforated damage in composites under a static load based on the evolutionary law of extension. Capoluongo et al. [Reference Capoluongo, Ambrosino, Campopiano, Cutolo, Giordano and Bovio6] used FBG sensors and reference sensors for the modal analysis and testing of composite structures with a high resonance, and identified damage in composites based on the differences in the measured modal frequencies and amplitudes. Gu [Reference Gu9] proposed a method to locate the damage in composites owing to low-velocity impact based on a fiber-optic sensing array, used time–frequency analysis to extract the characteristics of total energy of the initial signal of the impact-induced response and used this to locate the damage based on the total energy as a function of distance. The above shows that the response signals of composites under concentrated stress or impact-induced loading can be accurately obtained by using FBG sensors, but it is unrealistic to rely only on the drift in the wavelength or changes in the shapes of the reflectance spectra of the FBG sensors to identify damage in composites. The response signals need to be appropriately processed to extract the corresponding feature [Reference Geng, Lu, Jiang, Sui, Lv and Xiao10–Reference Jang, Lee, Kim, Kim and Kim14] by using deep learning algorithms [Reference Xia15–Reference Geng17] to identify damage in carbon fiber-reinforced composite structures.
Geng et al. [Reference Geng, Lu, Jiang, Sui, Lv and Xiao10] built a system to identify damage in carbon fiber composites by using FBG sensors and the backpropagation (BP) neural network, and constructed a model of damage identification based on the latter. Sai et al. [Reference Sai, Zhao, Wang and Hou12] measured the impact-induced response signals of structures by using an FBG sensing network, and used these data to build a model of impact localisation consisting of wavelet packets that required a limited amount of training. This model was able to identify and localise impact-induced damage to composites. Jang et al. [Reference Jang, Lee, Kim, Kim and Kim14] used multiplexed fiber Bragg grating sensors to collect the impact-induced acoustic signals in a given target cross-section, calculated the temporal difference in the arrival of the shock waves and used this to generate an input dataset to train a neural network. They then used the neural network to identify impact-induced damage in composite structures. Xia [Reference Xia15] used the convolutional neural network to train a model to identify the characteristics of strain in case of different types of damage based on empirical data, and constructed a one-dimensional neural network model that was suitable for data with high strain values to localise and classify damage to composite structures. Geng [Reference Geng17] developed an intelligent system by using FBG-sensing technology to identify the location of impact-induced damage in composite structures through a neural network-based approach. Although the above literature attests to the feasibility of algorithms for identifying structural damage in composites, most neural networks are mainly used for image recognition and user analysis in China, and have rarely been applied to identify damage in composite materials.
Deep learning (DL) is one of the rapidly developing fields in recent years, which has the ability to automatically learn hierarchical representations of data. Especially in handling large capacity and multidimensional data, DL has shown strong potential. Therefore, DL can provide an excellent data processing method for the health monitoring of composite material structures. In recent years, deep learning methods have shown excellent performance in various applications such as Feature Extraction, Defect Inspection, Segmentation, Medical Imaging, Additive Manufacturing, etc. [Reference Mosavi and Vaezipour18–Reference Zhou, Yuan and Cui22], including deep convolutional neural networks (DCNN), deep residual networks (DRN, ResNet), and deep residual shrinkage networks (DRSN). Convolutional neural networks have been widely used in structural health monitoring and damage identification, and have been considered one of the most advanced structural damage identification methods due to their efficient and robust feature learning capabilities. However, the depth of the network increases with the size of the dataset. When it reaches a certain level, the convolutional neural network will experience gradient vanishing or exploding, leading to a linear decline in its performance. The idea of incorporating residual learning on the basis of convolutional neural networks successfully avoids gradient vanishing, which is called DRN. The core idea of residual learning is to use identity mapping between the layers of the original convolutional neural network to replace the underlying mapping between input and output, which can simplify the training of deep networks and improve the effectiveness of feature learning. In practical applications, fsFBG sensors are often subject to external environmental interference, resulting in varying degrees of noise in the response signals they collect, which has a significant negative impact on the accuracy of composite material damage identification. DRNs and DRSNs, as variants of convolutional neural networks, are more suitable for structural health monitoring and damage identification. The soft thresholding of DRSNs can eliminate the noise influence in sensing signals and increase the accuracy of damage identification.
In this paper, we report static loading experiments on composite laminates subjected to varying degrees of delamination damage. We used fsFBG sensors to obtain the damage-related signals, and used the data to construct a model of damage identification based on the deep residual shrinkage network.
2.0 Experimental process
2.1 Preparation of test pieces
The test pieces considered in this study were hand laid from the T800 carbon fiber-reinforced epoxy resin matrix composite pre-pregs, manufactured by Lightwell Composites. The mass per unit area, thickness and resin content of the fibers were 125 g/m−2, 0.13 mm, and 20%–40%, respectively, and their mechanical parameters are listed in Table 1.
Table 1. Mechanical parameters of the T800 unidirectional carbon fiber pre-pregs

The experimental pieces were laid in [−45/0/45/90]4 in 16 layers. The dimensions of each piece were 200 mm × 200 mm. The plywood obtained is shown in Fig. 1.

Figure 1. Cured carbon fiber-reinforced composite laminate.
2.2 Parameterisation of damage
According to the above process for the fabrication of the plywood, defects were manually pre-fabricated in the layup stage of the pre-preg, and were affected by the high-temperature chemical environment in the curing stage. We used the high-temperature and corrosion-resistant polytetrafluoroethylene (PTFE) as the filler for the damaged area to simulate the structural delamination of the composite. The parameters of damage are provided in Table 2.
The phenomenon of delamination of carbon fiber composites involves a certain randomness. We considered four gradients of the thickness of delamination. The first gradient was a layer of PTFE film (thickness, 0.08 mm) that was pre-embedded into the middle layer of the laminate, and the second gradient was a layer of defects that were pre-embedded into the middle layer and neighbouring layers. There were two layers of defects in total (thickness, 0.16 mm). The third and fourth gradients of thickness contained similarly pre-embedded defects. The defects were all buried beforehand in the centre of the experimental pieces to reduce structural differences between them arising from different degrees of delamination.
2.3 Loading test and analysis of results
The results of loading experiments on the undamaged carbon fiber composite laminates showed that when weights were applied to them, the response-related data obtained from the adhesive fsFBG sensors drifted within a certain range of values. The measured drift in stress was ±2.64 MPa. To solve this problem, we applied an axial pre-load to the fsFBG sensor and used a hybrid adhesive with excellent properties to paste the area of the fiber grating of the sensor to the metal patch. This led to a patch-type fsFBG sensor with a pre-load, as shown in Fig. 2, and reduced the drift in the amplitude of stress to ±0.97 MPa.
Table 2. Parameters of pre-fabricated delamination damage to the composite


Figure 2. Patch-type fsFBG sensor with a pre-load.
To study the effects of delamination damage on the mechanical properties of the carbon fiber composites, we conducted static load experiments on samples that had sustained different degrees of damage. The damaged composite plywood was solidly supported on all four sides to accurately simulate the empirical working conditions, and a patch-type fsFBG sensor was pasted at the centre of its lower surface. The optical fiber was uniformly set along the direction of 0° of the carbon fiber. We set the centre of the grating of the fsFBG sensor as the loading point, and used a standard 2 kg weight as the static load on the plywood. A lightweight nut was glued to the surface of the standard weight, and its surface was used as the contact surface acting on the loading point of the laminate, as shown in Fig. 3.
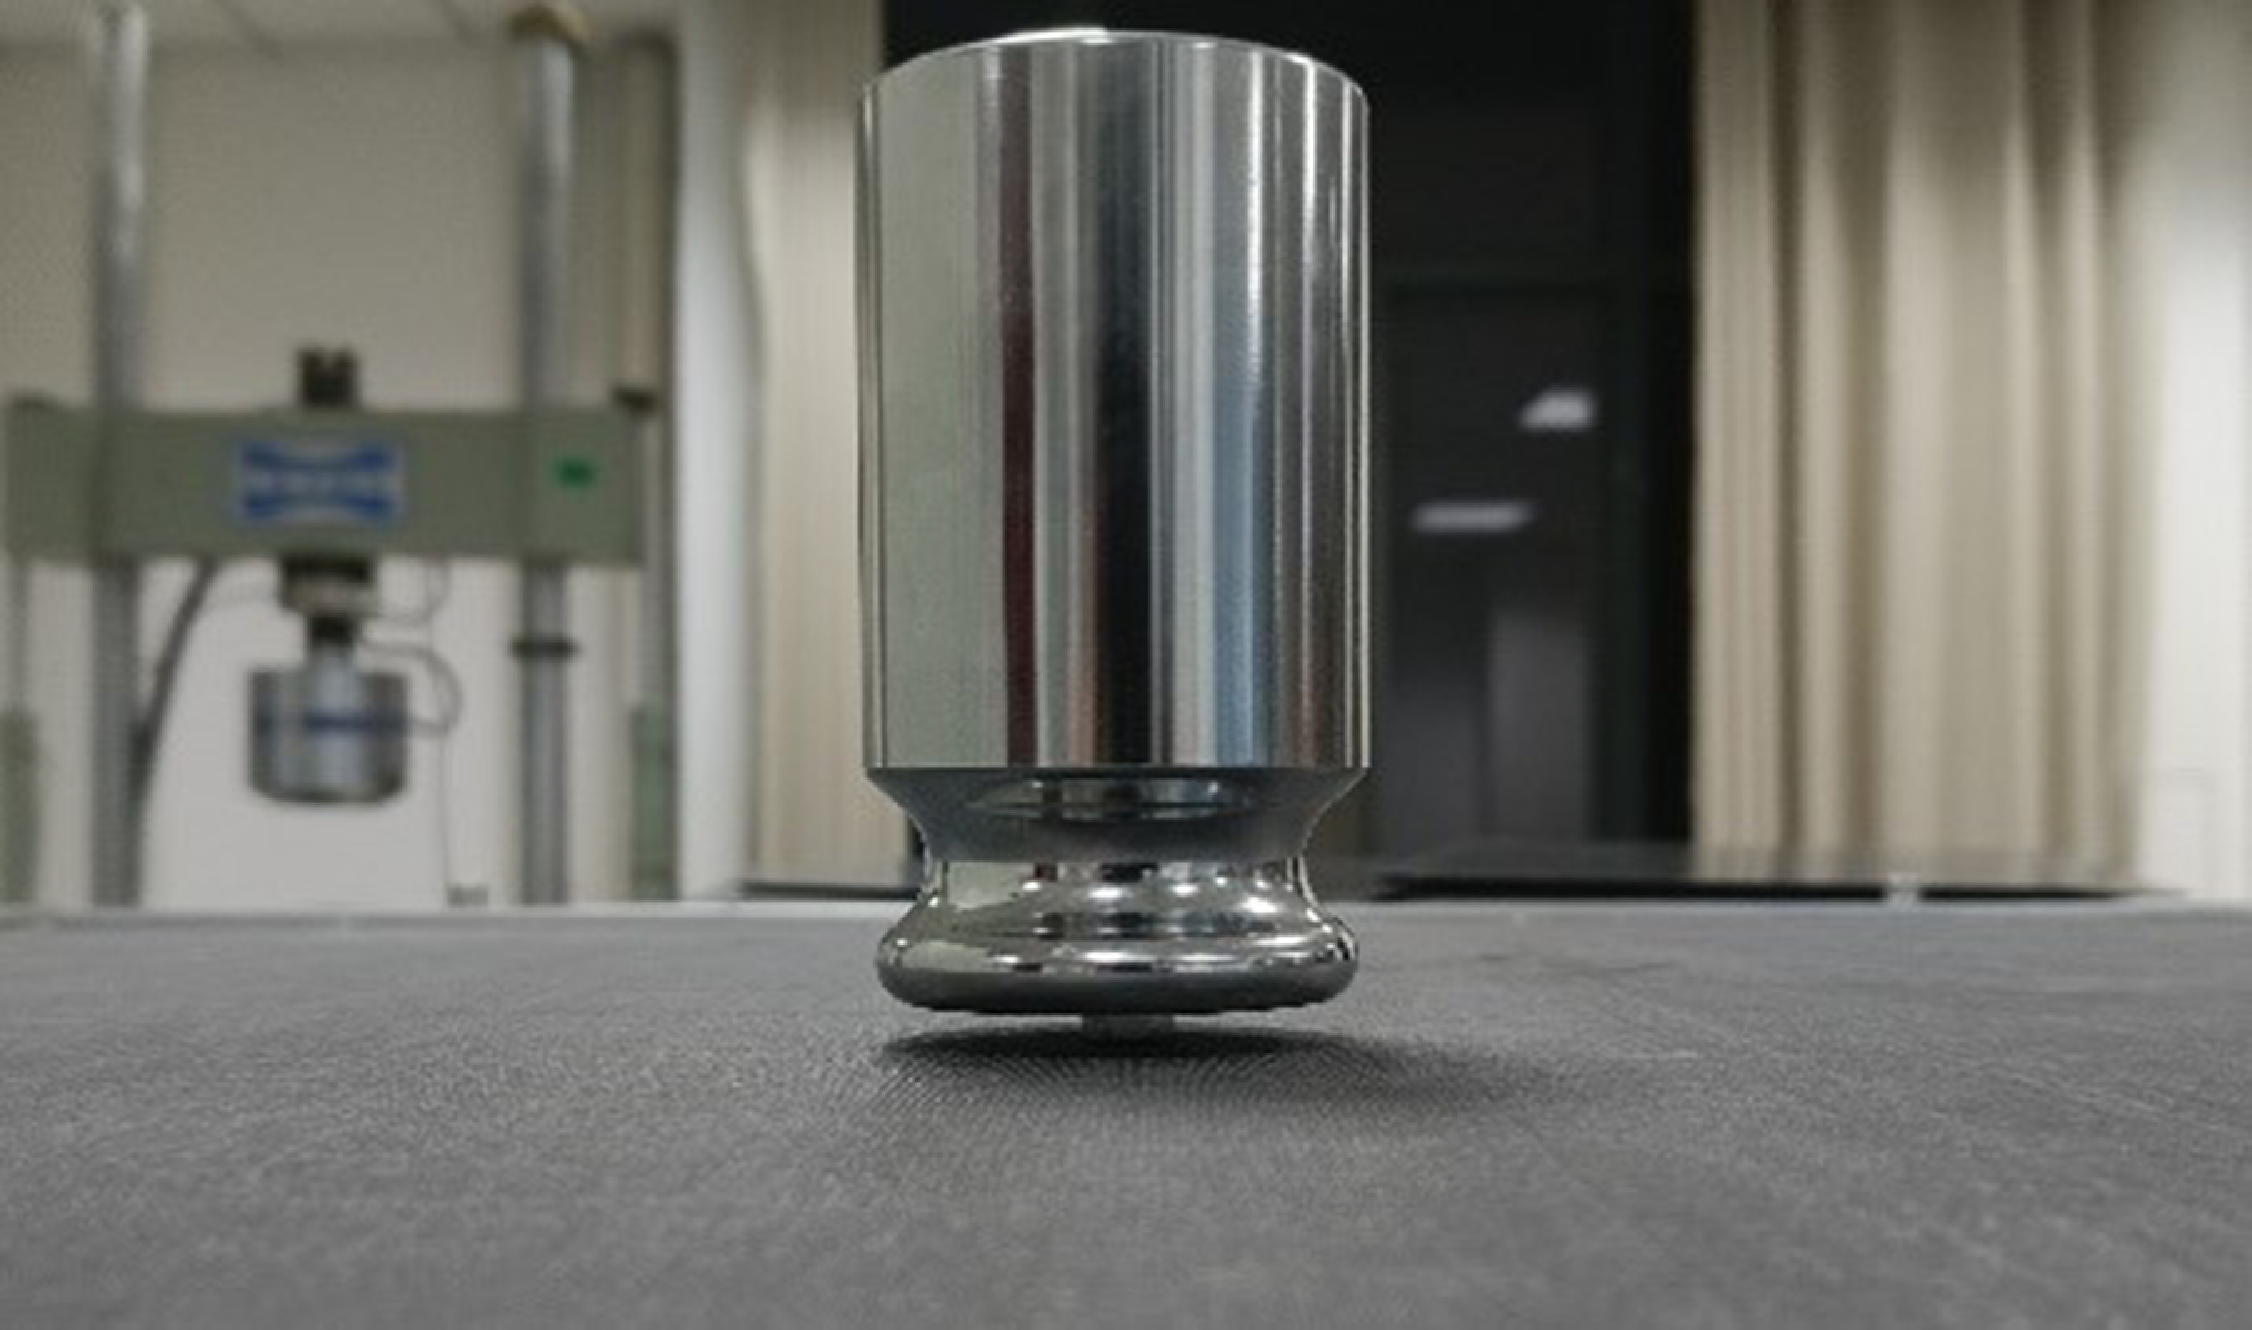
Figure 3. Schematic diagram of the simulated concentrated static load.
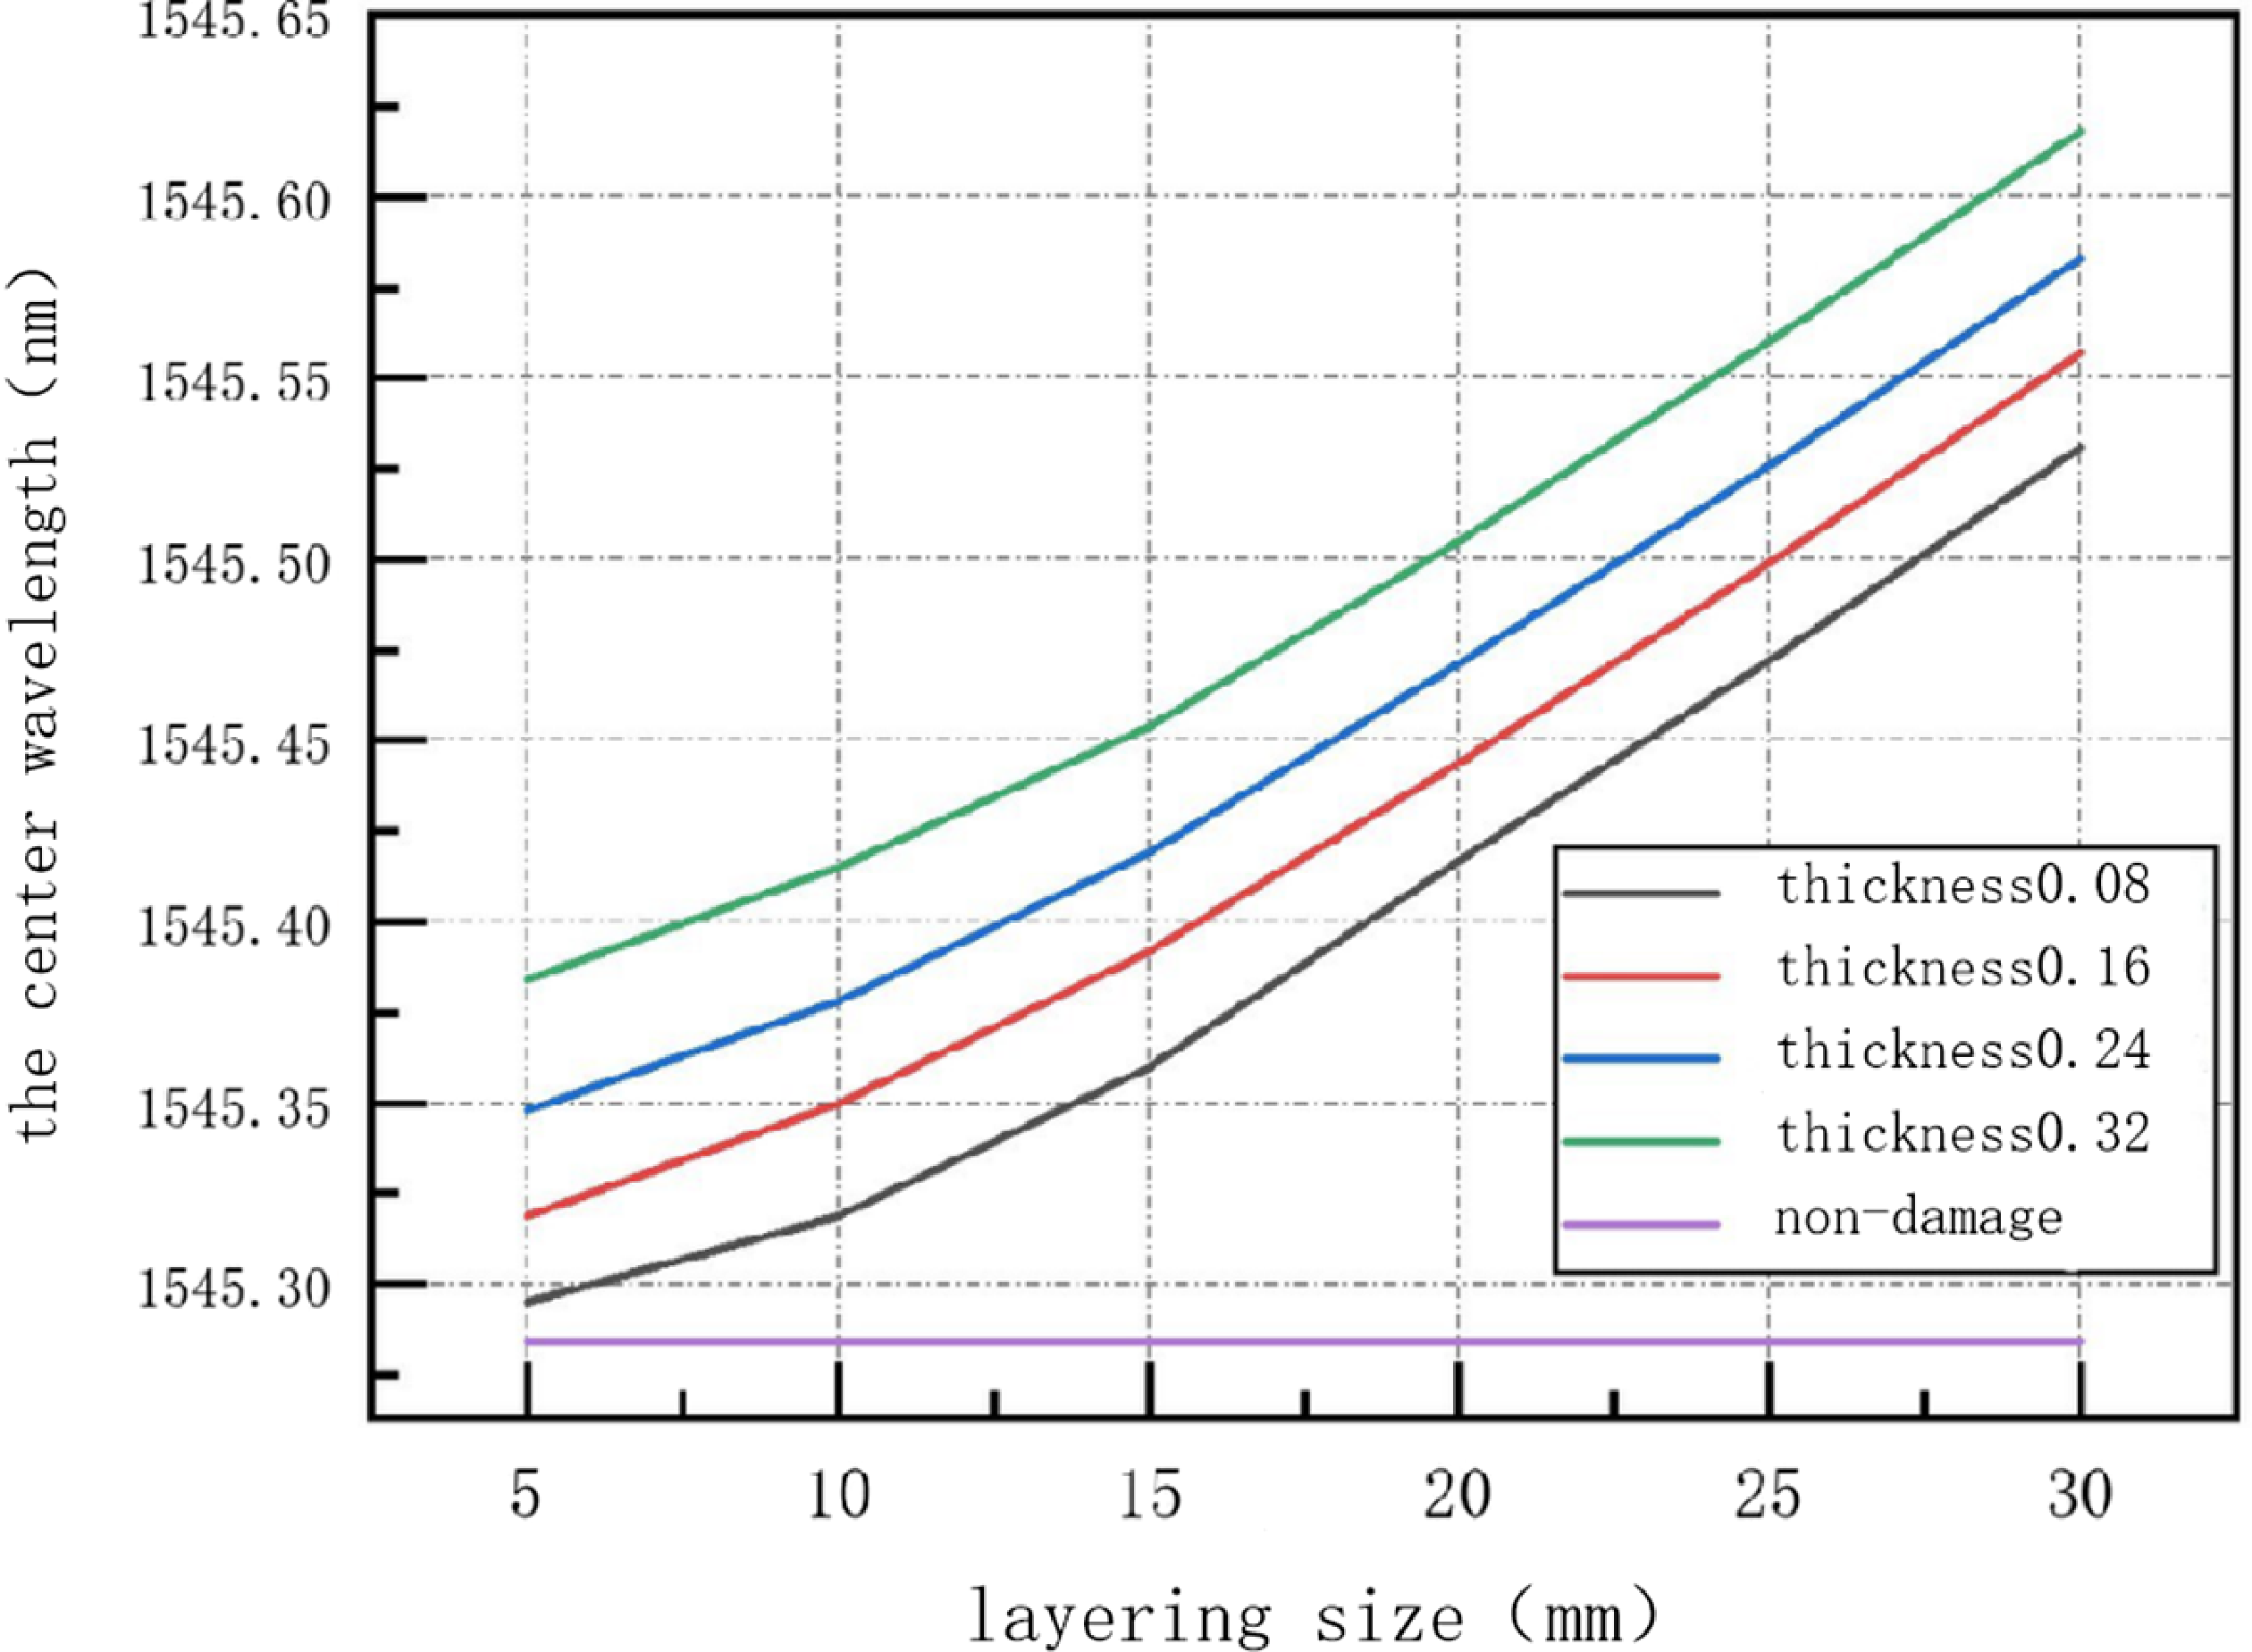
The concentrated load generated by the weights deformed the carbon fiber composite laminate, and the strain in it was transmitted to the patch fsFBG sensor. This led to changes in the area of the fiber grating and thus its centre wavelength. As laminates subjected to different degrees of damage deformed differently, changes in the centre wavelength recorded by the patch-type fsFBG were not identical across samples. We analysed these changes to determine the impacts of different parameters of damage on the carbon fiber composite laminates. The relationship between the centre wavelength of the fsFBG sensor, and the size and thickness of layers (number of layers) of the composite are shown in Figs 4 and 5, respectively.

Figure 4. Plot of the centre wavelength recorded by the fsFBG sensor versus the size of the layering.
Table 3. The 24 modes set according to the parameters of layering damage


Figure 5. Plot of the centre wavelength of the fsFBG sensor versus the thickness of the layering.
It is clear from Fig. 4 that when the thickness of the delamination (number of layers) was constant, the centre wavelength recorded by the fsFBG sensor monotonically rose with the size of the delamination, and the rate of change in it constantly increased. This occurred because the pre-fabricated delamination damage in the carbon fiber composite laminate altered its mechanical properties. As the range of damage increased, its mechanical properties declined considerably, and resulted in an increase in the local strain that was transferred to the grating under the action of the same centralised load. This in turn led to an exponential increase in the central wavelength recorded by the fsFBG sensor. From Fig. 5, it can be seen that under the same damage range (size), The centre wavelength of fsFBG sensor increases slowly and linearly with the increase of damage thickness (number of layers). This is because the freshly cured laminate was not subjected to a continuous environmental load, because of which the range of the delamination damage did not expand. The mechanical properties of the carbon fiber composite laminates therefore did not rapidly degrade. In summary, delamination damage seriously compromised the structural integrity of carbon fiber composites, and reduced their compressive strength and stiffness. An increase in the thickness of the delamination and the range of damage accelerated the degradation of the properties of the material, where the latter had a greater impact on the composites than the former.
3.0 Identification of delamination damage in composites on deep residual shrinkage network
3.1 Data modeling for damage identification
We set a total of 24 modes of layering damage, as shown in Table 3.

Figure 6. Plot of the centre wavelength distribution map of 24 sets of experimental data.

Figure 7. Plot of variations in the centre wavelengths of damage modes 1 to 12.
Weights were used to apply a concentrated static load for each damage mode, and the data were recorded by fsFBG sensors once the centre wavelength had stabilised. We measured 400∼500 groups of data for each damage mode, and each group of data contained 1,000 values of the centre wavelength recorded by the fsFBG sensor. We had 11,611 groups of experimental data in total. The 24 sets of data were selected and plotted in Fig. 6, and single set experimental data from damage mode 1 to damage mode 12 were plotted in Fig. 7.
Figure 7 shows that the experimental data acquired by the patch fsFBG sensors contained noise, and the noise for different modes of damage was not identical. Damage modes 3, 4, 5, 6, 7, 9, 11 and 12 contained a large amount of random noise, while the other damage modes contained less noise. There were two sources of noise: the unstable source of light of the fiber demodulator, which caused the experimental data to contain errors, and signals affected by the loss of the optical fiber or by the environment during transmission.
As shown in Fig. 8(a), the input signal is trained through several stacked nonlinear layers of traditional convolutional neural networks to obtain the underlying mapping. On the basis of traditional networks, an identity mapping as shown in Fig. 8(b) is introduced, assuming that and have the same dimension, residual maps can be fitted after network training. The results indicate that in practical applications, residual mapping is easier to optimise than the original mapping. Residual learning was achieved by constructing residual blocks (RBUs), which include two batch normalisation (BN), two rectified linear unit activation functions (ReLU), two convolutional layers (Conv) and identity mapping, as shown in Fig. 9(a).
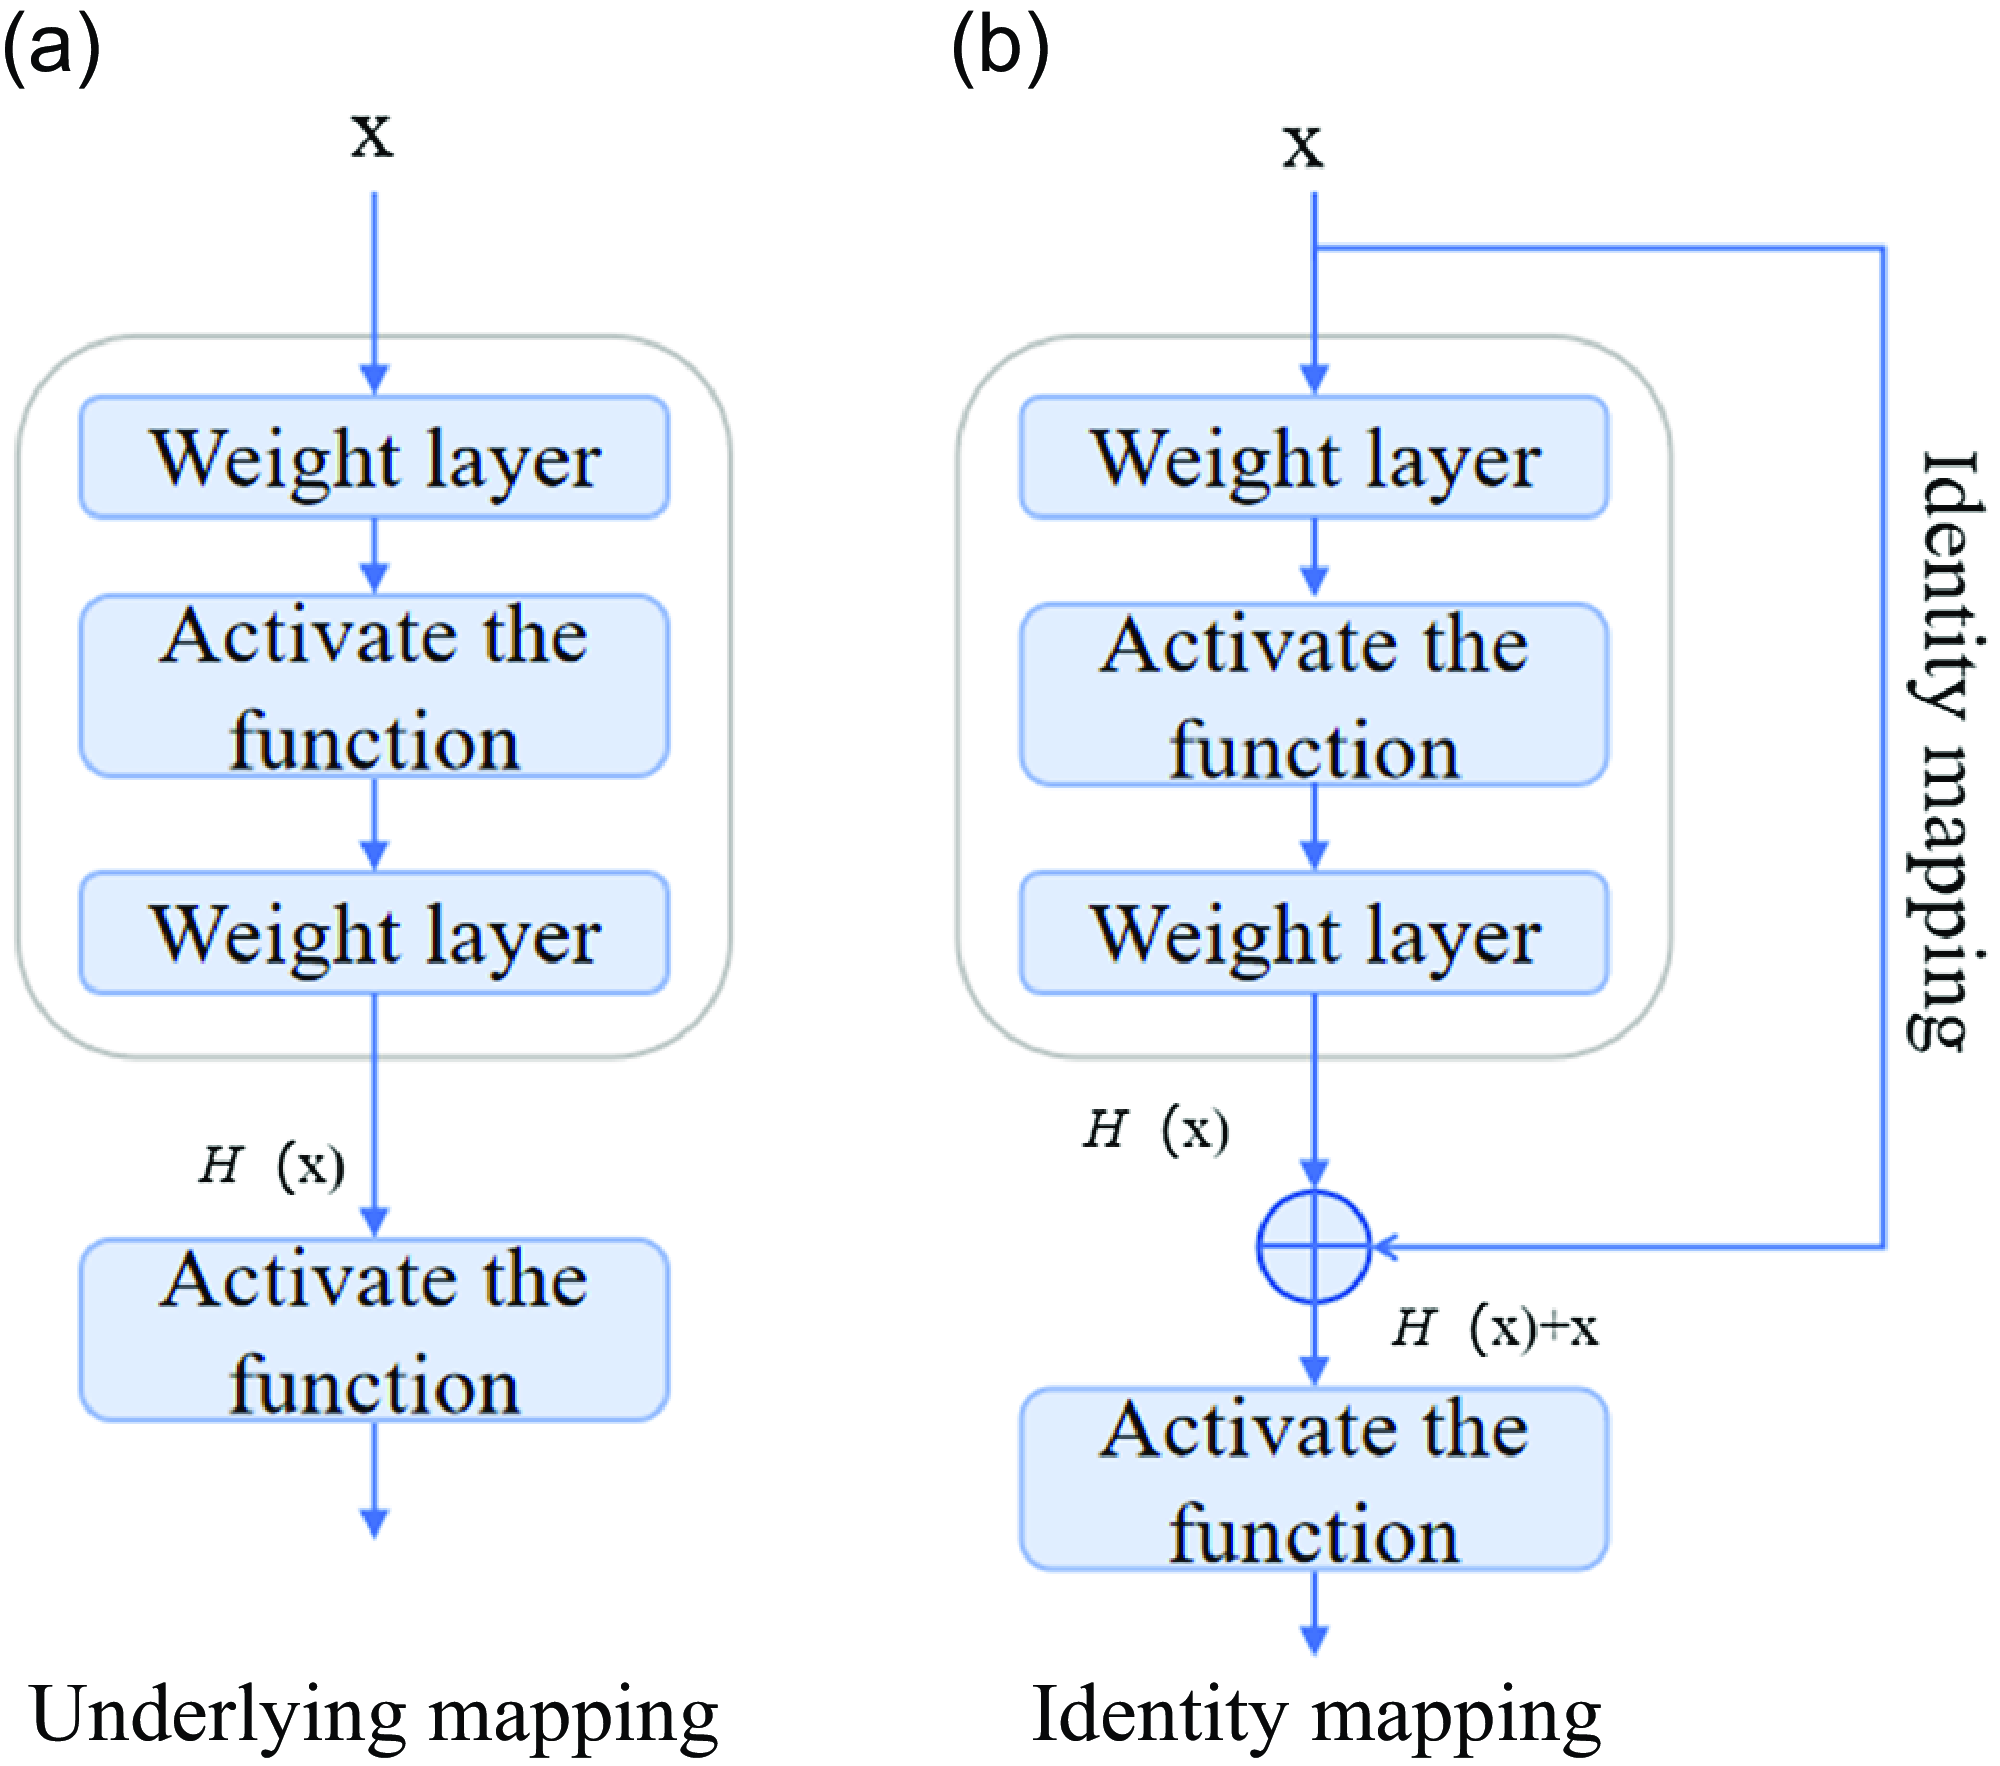
Figure 8. Comparison diagram of convolutional neural network underlying mapping and deep residual network identity mapping.
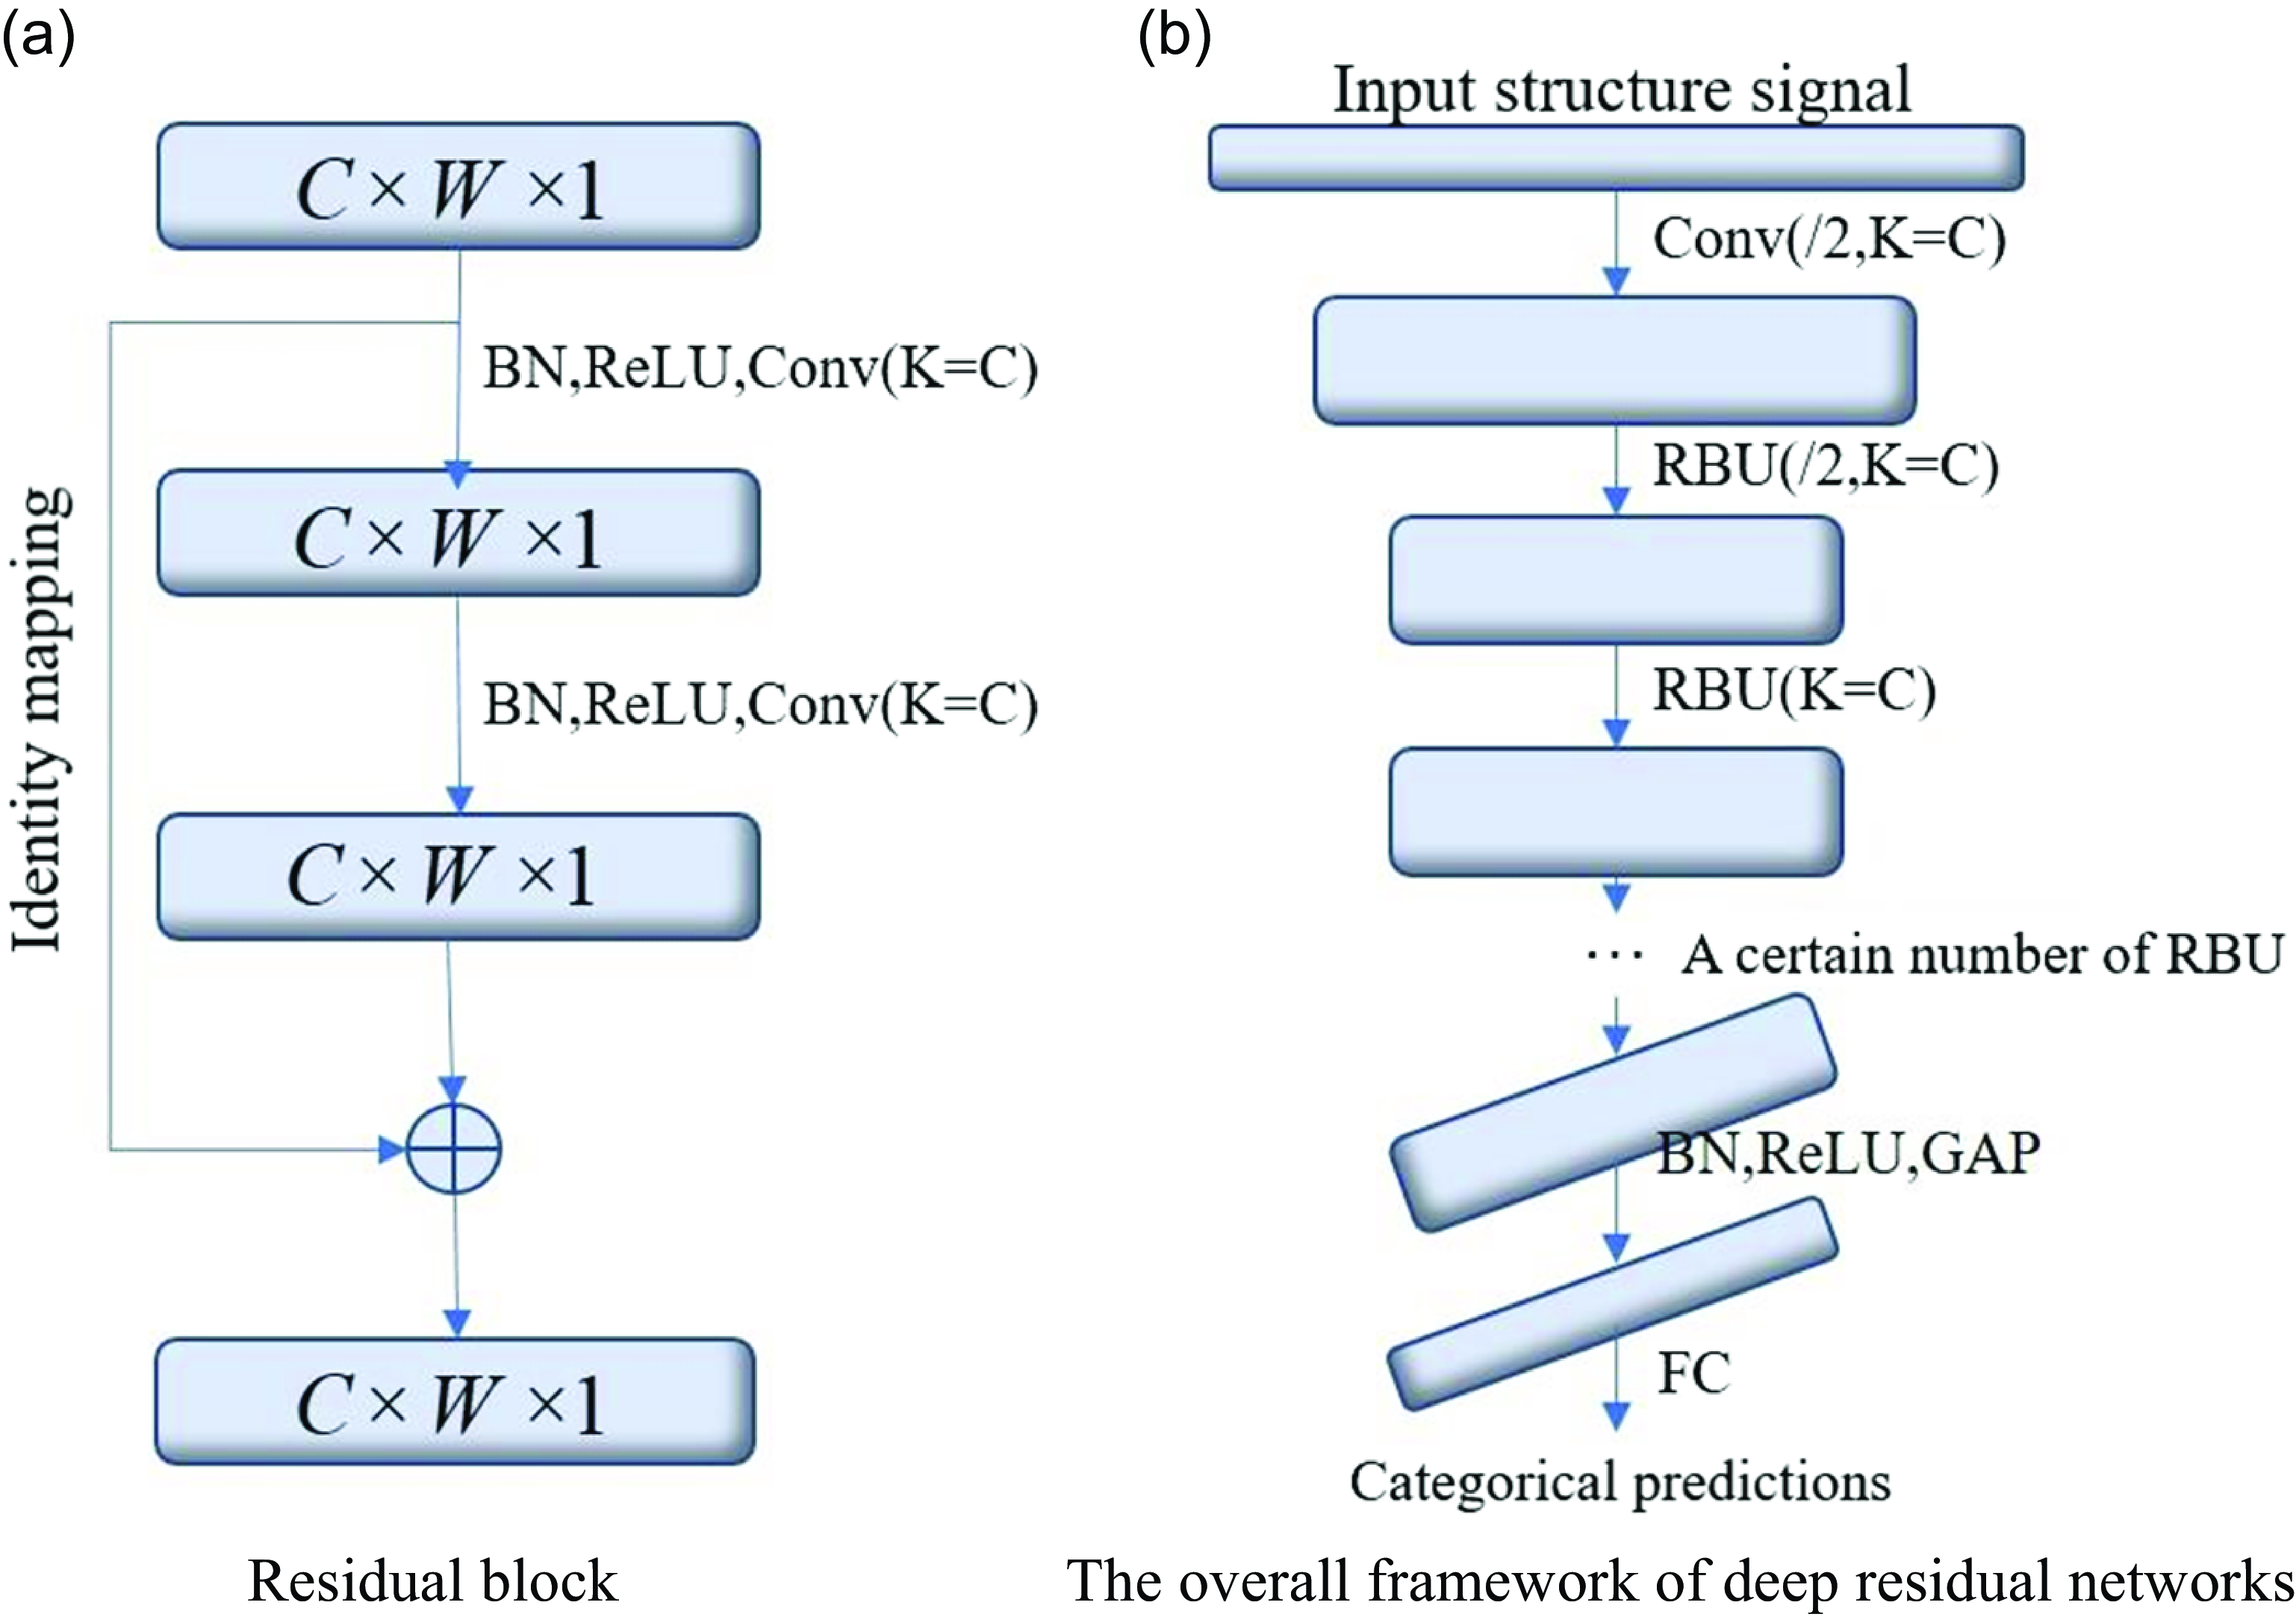
Figure 9. Residual blocks and overall framework diagram of deep residual networks.
The deep residual network consists of a Conv, several residual blocks, a batch normalisation layer (BN), a ReLU activation function, a global average pooling layer (GAP), and a fully connected output layer in order. Its overall structure is shown in Fig. 9(b).
The DRSN introduces a sub network similar to the attention mechanism (SENet) into the residual block to achieve the function of adaptive threshold setting, so that each sample has its own unique set of weight coefficients. This step successfully eliminates noise related features; As shown in Fig. 10, the improved residual blocks can be divided into two types based on the different subnetworks, namely the shared threshold between channels and the different threshold between channels [Reference Zhou, Yuan and Cui22].
We used a deep residual shrinkage network to learn the features of damage from the noisy signals. This network can adaptively set a separate threshold for each sample in order to deal with data with different noise-related contents. The process was as follows:
-
(1) Data normalisation
We chose representative damage modes 1, 5, 9 and 12, and limited their centre wavelengths to the interval [−1, 1].
-
(2) Dividing the dataset

Figure 10. Two types of residual blocks improved by deep residual shrinkage network.
We used the shuffle function in Keras to randomly disrupt the ordered experimental data to ensure appropriate training of the network and improve its overall performance. The disrupted experimental data were divided into a training set, a validation set and a test set according to the ratio 8:1:1. The training set was used to fit the neural network model and obtain the built-in parameters of its neurons; the validation set was used to adjust the hyper-parameters of the model and make a preliminary assessment of its predictive capability; the test set was used to evaluate the capability of the neural network model for generalisation, but was not the basis for the selection of the tuning parameters, feature selection and other algorithms.
-
(3) Building DRSN
The DRSN developed here consisted of a convolutional layer, a residual block with different thresholds among its nine channels, a batch normalisation layer, an activation function, global mean pooling and a fully connected output layer. The residual block was the most important structure of the network. The convolutional layer restricted the values of structural features represented by the data to a certain interval. As the noise in different samples was different, the converted ranges and intervals of the feature values were also different, which means that their redundant features were different as well. A sub-network in the residual block independently set the thresholds according to the intervals of values of features in each set of data, and soft-thresholded them so that each set of data had a unique set of thresholds. This helped flexibly eliminate redundant features. Finally, the output values were obtained through batch normalisation, the activation function and global mean pooling combined with constant mapping.
3.2 Result of damage identification
After normalising and randomly disrupting the 11,611 sets of experimental data, we chose the first 9,289 sets as the training set for our model of damage identification. We used 1,161 sets of data from the remainder as the validation set. It was used to check the effect of training of the model after every 10 epochs. In case the model overfit the data or failed to converge, we adjusted its hyper-parameters, such as the learning rate and number of iterations. Finally, we used 1,161 sets of data as the test set to assess the performance of the model. Each group of data contained 1,000 input values and one output value. The input values were the centre wavelengths recorded by the fsFBG sensors, while the output value was the specific pattern of damage sustained by the samples. The effects of error iteration and the accuracy of the network versus the number of iterations are shown in Figs 11 and 12, respectively.

Figure 11. Iteration of error in the proposed model.

Figure 12. Accuracy of the proposed model.
The above figures show that the curves of error and the accuracy of detection changed constantly during the training of the network. The error decreased with increasing number of iterations, while the accuracy of identification of the model exhibited the opposite trend. When the number of iterations reached 20, both the error and the accuracy of identification began to converge. The capability of generalisation of the deep residual shrinkage network was optimal at this time.
Due to limitations of space, we show only 100 randomly selected groups of results in Fig. 13 to depict the performance of the deep residual shrinkage network.
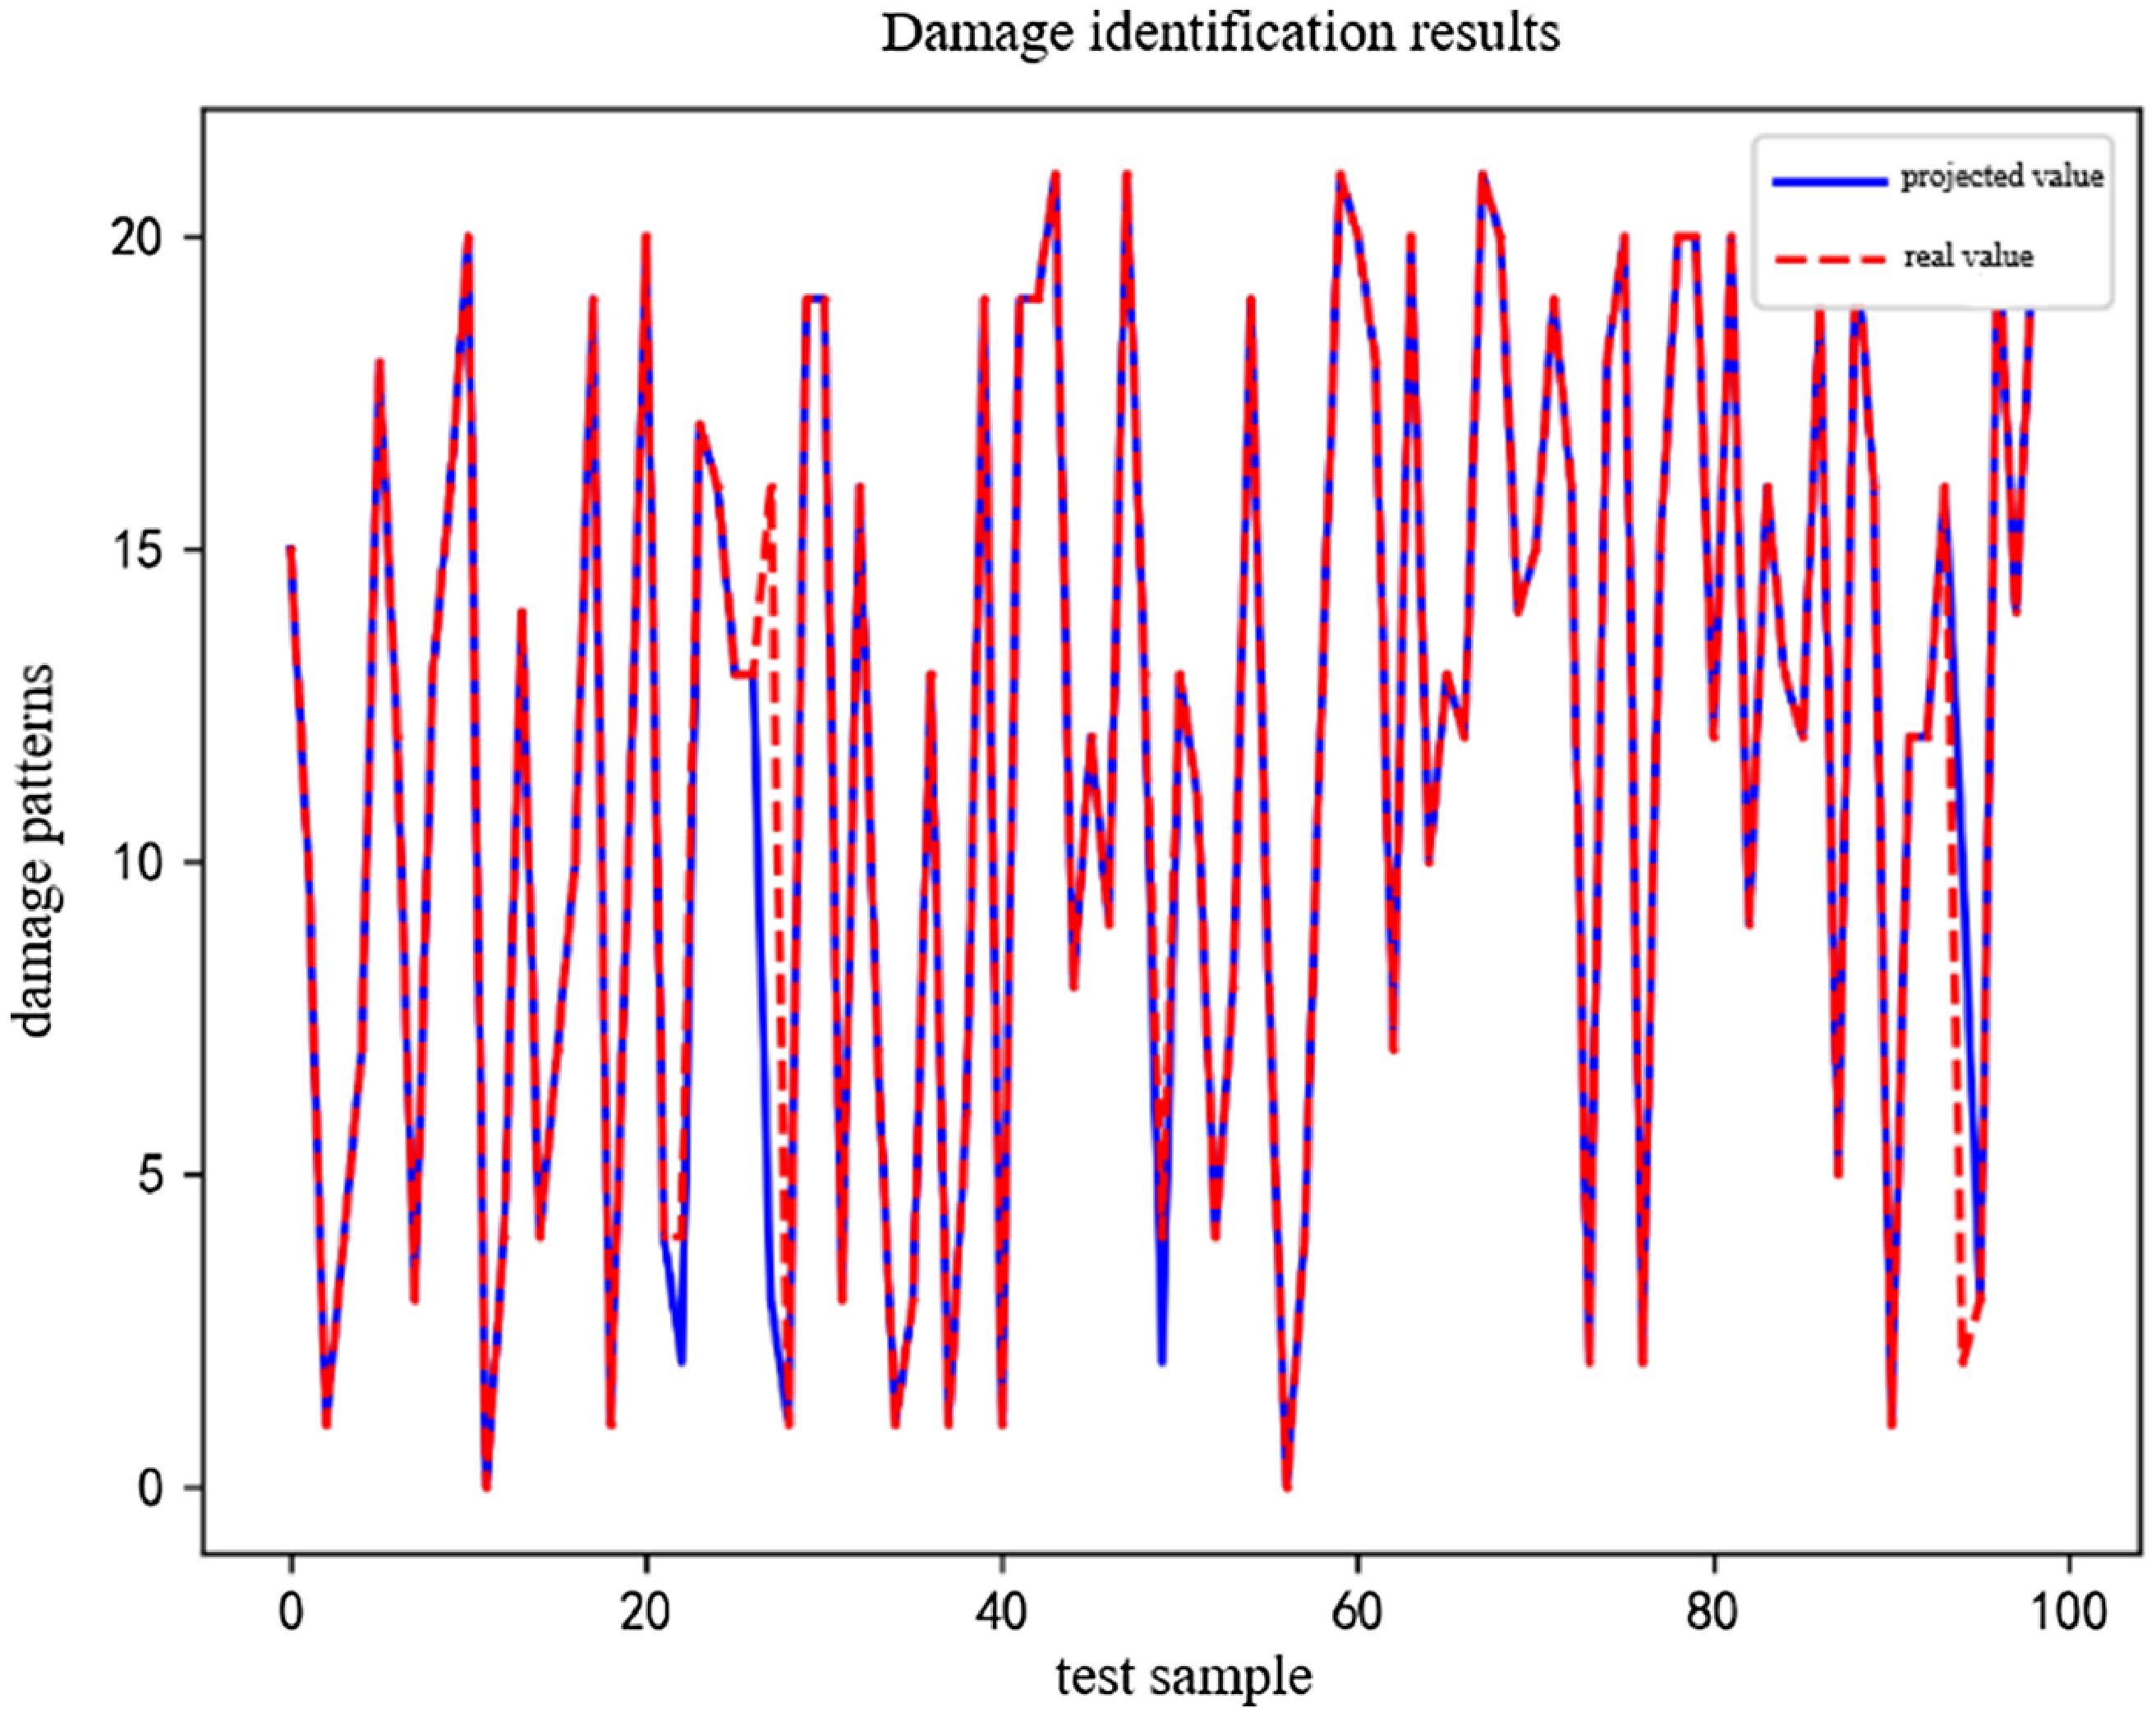
Figure 13. Results of damage identification of the proposed model.
Except for the 38th and 97th groups, the patterns of damage predicted by the proposed model for all groups were consistent with the actual damage sustained by the corresponding samples. This shows that the proposed model could accurately identify different degrees of delamination damage in carbon fiber composites. It recorded a highest accuracy of 97.98%.
4. Conclusions
-
(1) We pasted patch-type fsFBG sensors on the lower surface of plywood to collect its response signals and analysed the characteristics of responses of the composite structure to different degrees of delamination damage. This led us to identify two kinds of parameters of delamination that influence damage to the composite. Delamination damage significantly compromised the structural integrity of the carbon fiber composites, and increasing the thickness of the delamination and the range of damage accelerated the degradation of its properties. The range of damage was found to have a greater impact on the composites than the thickness of the delamination.
-
(2) We constructed a model of damage recognition based on the DRSN and trained it on experimental data. It recorded an overall accuracy of damage identification of 97.98%, which indicates that it can accurately detect different degrees of delamination damage in carbon fiber composites.


