INTRODUCTION
Varicella zoster virus (VZV) is highly infectious and is spread by droplet or airborne transmission [Reference Seward1]. VZV causes two distinct illnesses: varicella (chickenpox) following primary infection and herpes zoster (shingles). These illnesses are both important causes of morbidity and mortality in Australia. There were about 240 000 cases, 1500 hospitalizations and an average of 7–8 deaths each year from varicella in Australia before the introduction of the varicella vaccination programme [Reference Brotherton2, 3].
Varicella vaccination is the main method for prevention of varicella and monovalent varicella vaccines have been licensed in many countries such as Australia, Canada, UK and USA [Reference Brisson4]. In Australia, varicella vaccine was licensed in 2000 and since November 2005, a single dose of varicella vaccine has been funded under the National Immunisation Program (NIP) for all children aged 18 months, with a catch-up dose funded for children aged 10–13 years [3, Reference Macartney5]. One-dose varicella vaccine is effective in preventing natural varicella cases [Reference Vazquez6]. However, vaccine effectiveness (VE), decreases with time [Reference Vazquez6, Reference Tugwell7] and there is now evidence of waning immunity [Reference Chaves8]. As a result of ongoing transmission, even in highly vaccinated populations, the USA introduced a two-dose vaccination schedule in 2007 [Reference Marin9, Reference Marin, Meissner and Seward10].
Since 2000, several modelling studies have investigated the impact of one-dose varicella vaccination on the incidence and morbidity of varicella and zoster both in Australia [Reference Gidding, Brisson and MacIntyre11] and other countries [Reference Brisson12–Reference Schuette14]. In this study, we used a mathematical model of VZV transmission [Reference Gidding, Brisson and MacIntyre11, Reference Brisson12] to examine the impact of one-dose vs. two-dose varicella vaccination schedules in Australia using lower vaccine efficacy estimates and incorporating higher levels of waning immunity.
METHODS
Vaccine strategies and coverage
One-dose and two-dose vaccination strategies as well as coverage are listed in Table 1. The one-dose strategy and alternative one-dose strategy are based on Australia's current varicella vaccination schedule [3, Reference Macartney5, Reference Gidding, Brisson and MacIntyre11]. The two-dose strategy is hypothesized to be optimal and the alternative two-dose strategy is based on the recommended two-dose immunization schedule of the USA [Reference Marin9]. Vaccine coverage is assumed to be 90% for all varicella vaccination strategies given coverage with the measles-mumps-rubella (MMR) vaccine currently exceeds 90% [Reference Gidding, Brisson and MacIntyre11]. For convenience the one-dose strategy is referred to as strategy 1, the alternative one-dose strategy as strategy 1a, and the two-dose strategy as strategy 2 and the alternative two-dose strategy as strategy 2a.
Table 1. Vaccination strategies and coverage

The model and parameter estimates
The realistic, age-structured deterministic (RAS) models developed by Brisson et al. [Reference Brisson12] (Appendix B) were adapted to assess the impact of varicella vaccination on varicella and zoster in Australia using new estimates for the vaccine efficacy parameters (Table 2). Australian serosurvey results and population data were used to parameterize the RAS models [Reference Gidding, Brisson and MacIntyre11, Reference Gidding15] (Table 3). Two interacting models were used: model 1 to assess the impact of vaccination on varicella and model 2 to assess the impact on zoster. Both RAS models are governed by a set of ordinary differential equations. Numerical results and figures in this paper were generated with Matlab® R2007b.
Table 2. Vaccine efficacy parameters and Australian population characteristics
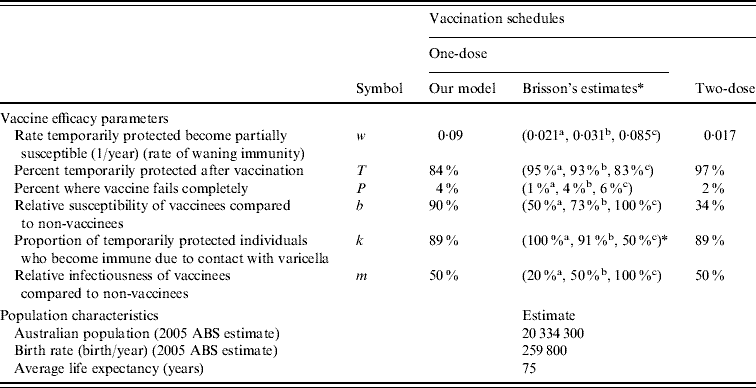
ABS, Australian Bureau of Statistics.
* Brisson et al.'s estimates: a best-case, b base-case, c worst-case [Reference Brisson12].
Table 3. Australian model parameters
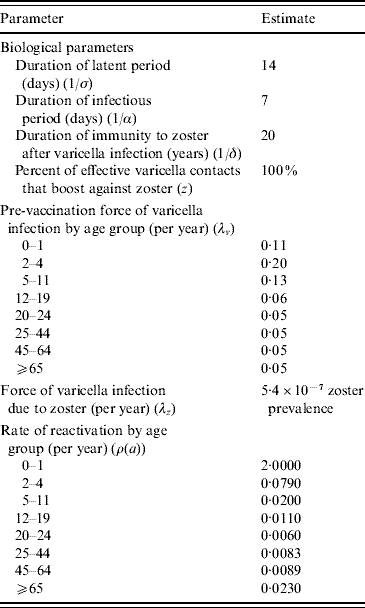
The population characteristics were taken to be similar to Australia in 2005 (Table 2). The force of varicella infection (λ) [Reference Gidding15, Reference Farrington16] and biological parameters were taken to be the same as in Gidding et al. [Reference Gidding, Brisson and MacIntyre11] (Table 3). The vaccine efficacy parameters are outlined in Table 2. Vaccine efficacy parameters w (waning rate), T (percent temporarily protected following vaccination), k (proportion of temporarily protected vaccinees boosted after exposure to natural infection) and b (relative susceptibility of vaccinees compared to non-vaccinees) for one-dose vaccination were estimated by fitting a simplified transmission model [Reference Brisson17] to the annual rate of breakthrough varicella during 10 years of active surveillance of children receiving one dose of varicella vaccine [Reference Chaves8]. For two-dose vaccination, parameter k was taken to be the same as for one-dose and the estimation of parameters w, T and b was based on annual infection rates during 10 years of follow-up in healthy children who received two injections of varicella vaccine in the USA [Reference Kuter18]. Parameters P (percentage of vaccine failures) and m (relative infectiousness of vaccinees compared to non-vaccinees) for a one-dose vaccination strategy were set to the same as Brisson et al.'s base-case estimate [Reference Brisson12]. For the two-dose vaccination strategy, parameter m was kept the same as for the one-dose strategy based on the lack of data on the relative infectiousness of two-dose vaccinees. Parameter P in the two-dose case was assumed to be half of the value for the one-dose strategy given that a second dose is likely to reduce the probability of complete vaccine failure substantially [Reference Michalik19], although it is unclear what this reduction should be. For comparative purposes Brisson et al.'s best-case, base-case and worst-case estimates for the vaccine efficacy parameters are also listed in Table 2.
The Who-Acquired-Infection-From-Whom (WAIFW)
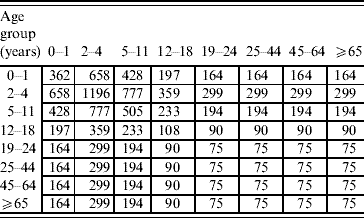
To better reflect contact patterns in Australia, a different WAIFW matrix from those used by Brisson et al. [Reference Gidding, Brisson and MacIntyre11, Reference Brisson12] was developed (see Appendix A) using the standard technique developed by Anderson & May [Reference Anderson and May20]. To evaluate the values of elements of WAIFW, Australia's pre-vaccination force of infection (λi, i=1, 2, …, 8) was taken to be constant within each of eight age groups: 0–1 (infants), 2–4 (pre-school), 5–11 (primary school), 12–18 (high school), 19–24 (university), 25–44 (child bearing age), 45–64, and ⩾65 years (grandparents), and was estimated using the Australia-wide serosurvey for VZV immunity [Reference Gidding15]. Since many possible matrix structures can be assumed from the same observed data, a sensitivity analysis was performed to assess how changes in the matrix structures influence results. The chosen matrix structures are: our base matrix; an assortative and a proportional matrix (see Appendix A).
Model outputs
First we obtained numerical solutions to the differential equations (model equations for RAS models 1 and 2) which govern the deterministic RAS models. Then varicella incidence and morbidity (in-patient days) in a total population of 1 million (cases per million person-years) were calculated from the numerical solutions to RAS model 1. Here numbers of in-patient days was used as a proxy measure of morbidity. Zoster incidence and morbidity were calculated from the numerical solutions to RAS model 2. The potential impact of childhood vaccination on zoster was examined assuming that exposure to varicella results in 20 years of immunity [Reference Brisson21, Reference Brisson, Edmunds and Gay22]. Average age of varicella infection was also calculated from the model output. As model simulations approach equilibrium after 75 years, simulations were performed for the first 80 years following the start of vaccination. Simulations were also performed for the pre-vaccination period. Both natural and breakthrough varicella were measured.
Vaccine effectiveness
Vaccine effectiveness (VE) is calculated using surveillance or simulated data from post-licensure vaccination programmes which is in contrast to vaccine efficacy which is evaluated using data from randomized controlled clinical trials. In this study, VE was used as a proxy measure of overall effectiveness and long-term impact of the varicella vaccination programmes in Australia. VE was measured as 1 minus the relative risk (RR) in vaccinated individuals compared to unvaccinated individuals [Reference Becker and Britton23, Reference Halloran24].
where c v=number of annual varicella cases (breakthrough) in the vaccinated population at equilibrium; c 0=number of annual varicella cases (natural) in the unvaccinated population at equilibrium; v=vaccination coverage.
RESULTS
Varicella incidence
Strategy 2 (two-dose) is expected to produce a lower annual number of natural varicella cases at equilibrium than strategy 1 (one-dose) (5% vs. 13% of pre-vaccination state, respectively) (Fig. 1 a). Figure 1 b represents the predicted number of breakthrough varicella cases in vaccinees. Strategy 1 leads to a much higher rate of breakthrough varicella cases than the two-dose strategies. At equilibrium, rates of breakthrough varicella for the two-dose strategies 2 and 2a are only 11% and 17% of strategy 1, respectively.
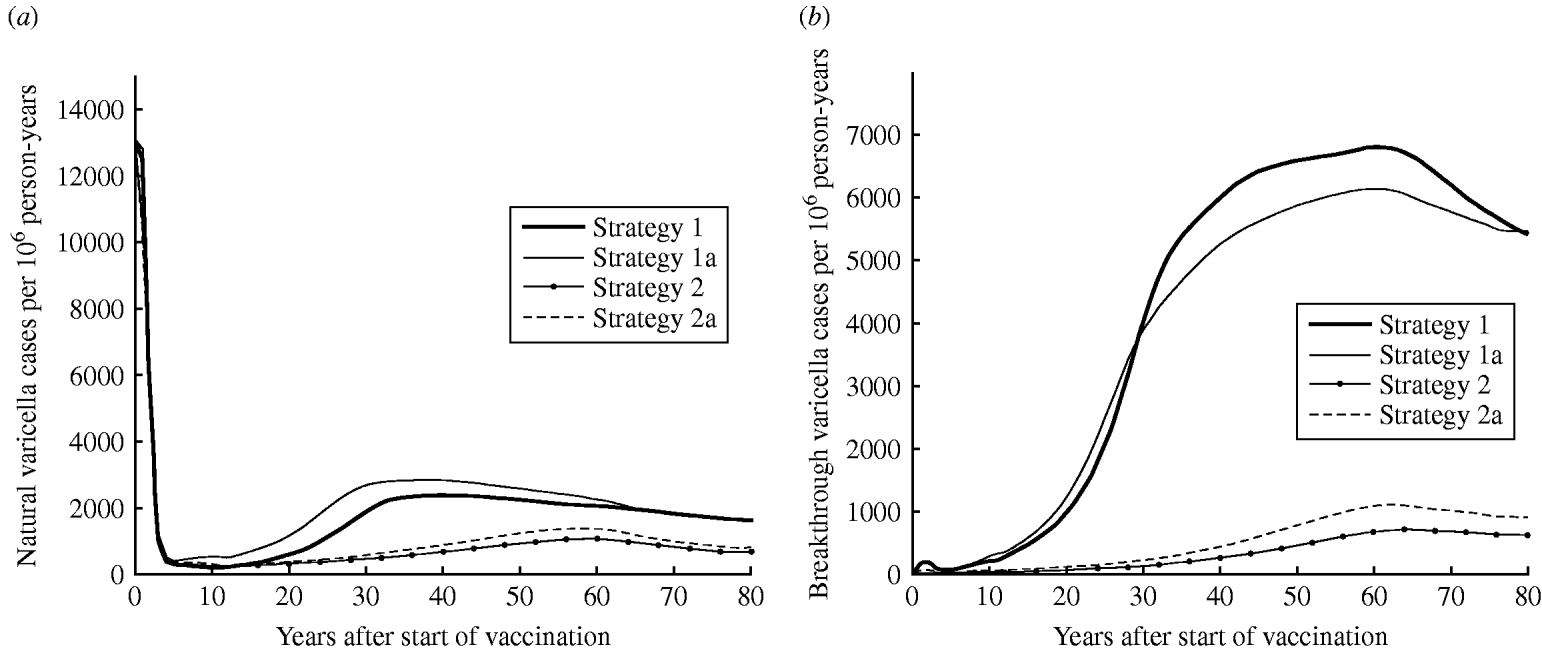
Fig. 1. Dynamics of varicella in Australia. Estimated (a) natural varicella incidence and (b) breakthrough varicella incidence.
Varicella morbidity
Shortly after vaccination, both strategy 1 (one-dose) and strategy 2 (two-dose) are expected to significantly reduce morbidity (Fig. 2 a). However, at equilibrium strategy 2 is expected to produce a lower number of in-patient days compared to strategy 1 (82% vs. 70% reduction from the pre-vaccination period respectively).

Fig. 2. (a) Morbidity (in-patient days) due to varicella over time for strategy 1 (one-dose) and strategy 2 (two-dose). (b) Estimated morbidity (annual in-patient days) by vaccination coverage at equilibrium for strategies 1 and 2. (c) Predicted average age of infection with VZV in Australia for strategies 1 and 2 by years after start of vaccination.
Figure 2 b represents the estimated annual number of in-patient days at equilibrium after strategy 1 and strategy 2 vaccinations with different levels of coverage for both the first and second doses. For strategy 2, the overall number of in-patient days decreases very little with increasing vaccination coverage for coverage below about 40–50% (Fig. 2 b). This is caused by the shift in the average age at infection (Fig. 2 c). The decrease in natural cases in children is counterbalanced by the increase in adult morbidity. Both adult and child morbidity are reduced markedly when coverage exceeds 60%. Strategy 2 produces higher varicella morbidity than strategy 1 if coverage is <75%. However, at higher coverage (>75%) strategy 2 results in lower varicella morbidity than strategy 1.
Average age of infection
Figure 2 c shows how the average age of VZV infection in Australian varies with strategy 1 (one-dose) and strategy 2 (two-dose) following vaccination. Vaccination is predicted to increase the average age of infection with the age shift for strategy 2 greater than with only strategy 1 (Fig. 2 c). The average age of infection for both strategy 1 and strategy 2 (90% coverage) will increase to a peak and then decline to an equilibrium level after about 80 years. The decline is due to waning of vaccine-induce immunity which leads to a rise in breakthrough varicella infections.
Impact of one-dose vs. two-dose vaccination on varicella incidence for low and high coverage
Fig. 3 shows the predicted impact of strategy 1 (one-dose) and strategy 2 (two-dose) on the number of natural and breakthrough cases of varicella with low (50%) and high (90%) vaccination coverage. At low coverage (Fig. 3 a, b), both strategy 1 and strategy 2 are expected to produce similar numbers of natural varicella at equilibrium (56% and 55% of the pre-vaccination state, respectively) but epidemics of varicella following vaccination with strategy 2 are less pronounced and of lower frequency than with strategy 1. In contrast, rates of breakthrough varicella at equilibrium with low coverage are twofold higher with strategy 1 compared to strategy 2. This leads to VE estimates of 60% for strategy 1 and 86% for strategy 2. At high coverage (Fig. 3 c, d) for both the one-dose and two-dose strategies, the initial decline (the honeymoon period) in natural varicella incidence is more marked and the post-honeymoon epidemic is smaller and delayed, compared to low coverage. VE at high coverage is 63% for strategy 1 and 90% for strategy 2. At equilibrium, strategy 2 results in a greater than eightfold reduction in breakthrough infections (617 cases per million person-years) compared to strategy 1 (5419 cases per million person-years).
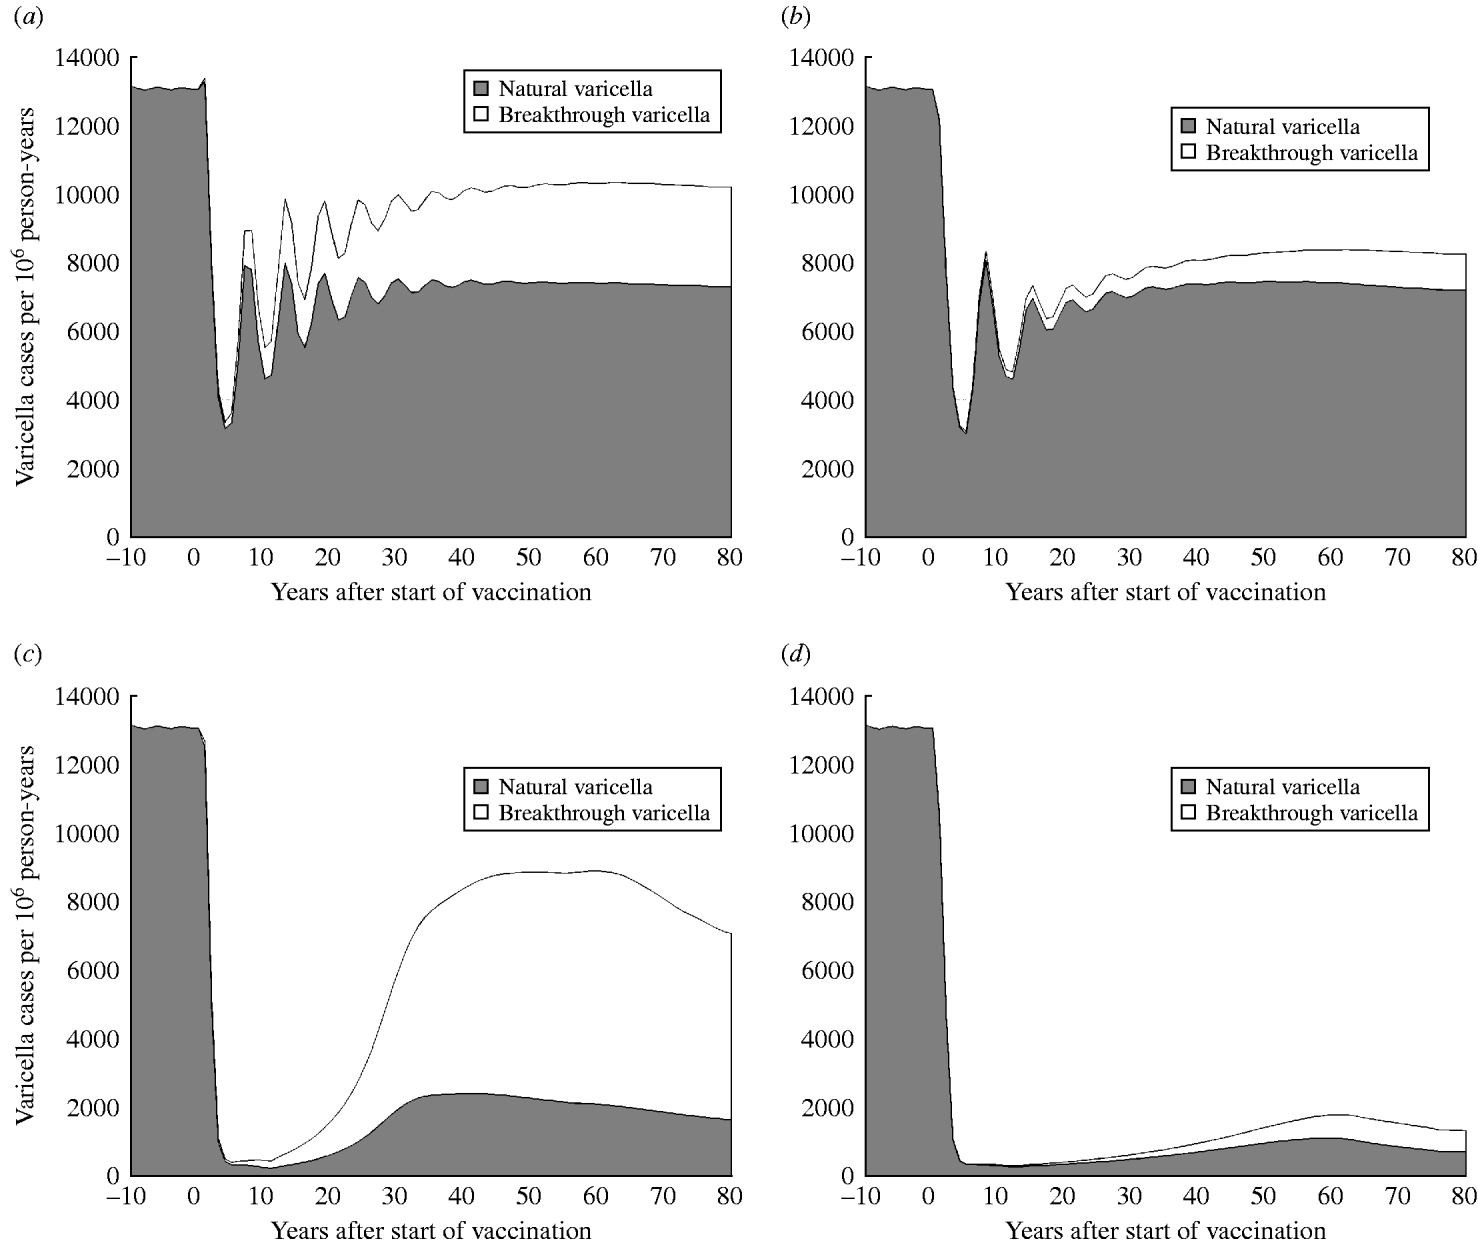
Fig. 3. Dynamics of natural and breakthrough varicella incidence in Australia with low (50%) and high (90%) vaccination coverage. (a) Strategy 1 (one-dose) and low coverage (50%), (b) strategy 2 (two-dose) and low coverage (50%), (c) strategy 1 and high coverage (90%), (d) strategy 2 and high coverage (90%).
Vaccine effectiveness
In order to show how VE changes over time, it was calculated for each year following the introduction of vaccination (Fig. 4). VE decreases after the start of vaccination for both strategy 1 (one-dose) and strategy 2 (two-dose) but the decrease is much more rapid for strategy 1, especially in the first 10 years. The actual VE estimates from the model at 10-yearly points following the start of vaccination are listed in Table 4.

Fig. 4. Estimated vaccine effectiveness (VE) for strategy 1 (one-dose) and strategy 2 (two-dose) over time.
Table 4. Vaccine effectiveness (VE) estimates over time obtained from the model

Zoster incidence
Figure 5 a illustrates the predicted increase in zoster incidence following the introduction of one-dose (strategy 1) or two-dose (strategy 2) vaccination programmes. Zoster incidence would increase for the first 30 years following vaccination. In the long term, once individuals from every cohort in the population have been vaccinated, zoster incidence is expected to decrease. Strategy 2 would produce a greater number of zoster cases than strategy 1 30–60 years after vaccination but declining sharply. At equilibrium strategy 2 produces a 97% reduction from the pre-vaccination period compared to an 83% reduction for strategy 1.
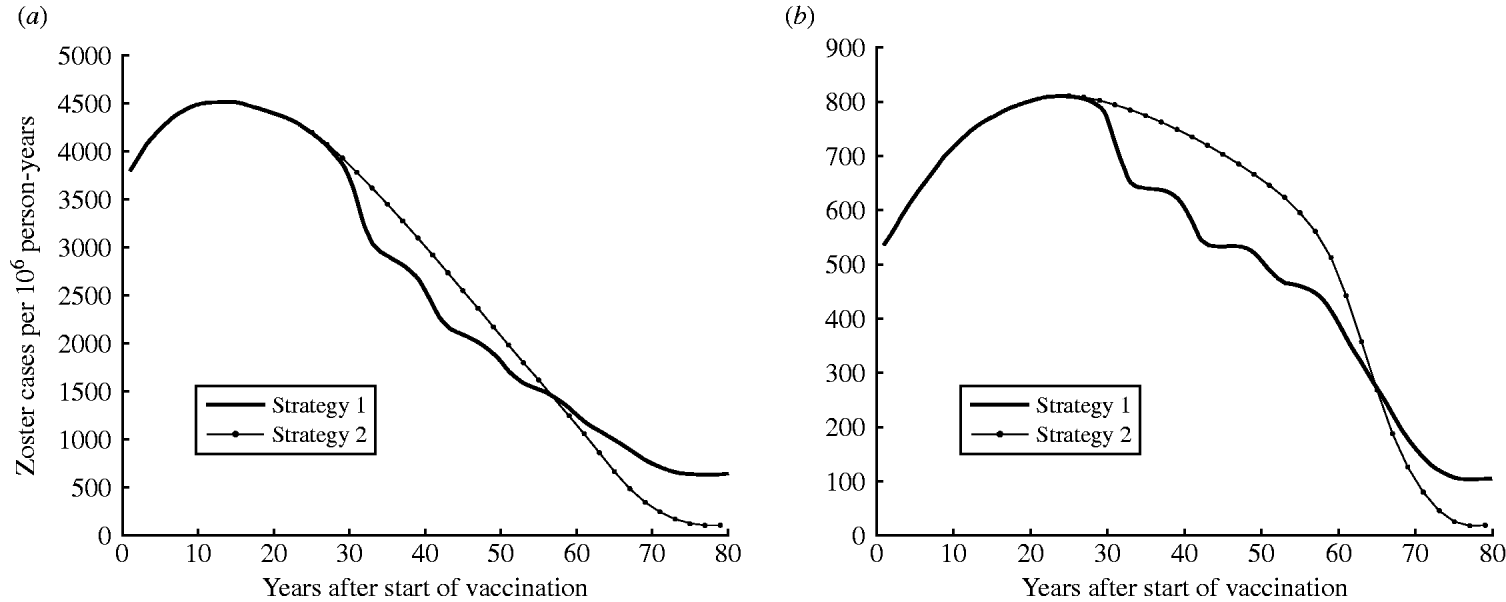
Fig. 5. Dynamics of zoster incidence and morbidity (in-patient days) for strategy 1 (one-dose) and strategy 2 (two-dose) (both at 90% coverage). (a) Estimated zoster incidence and (b) morbidity (annual in-patient days) by years following the introduction of vaccination (at year 0).
Zoster morbidity
Figure 5 b shows the potential increase in zoster morbidity due to varicella vaccination. The introduction of vaccination would increase zoster morbidity (zoster in-patient days) for the first 45 years with strategy 1 (one-dose) and the first 60 years for strategy 2 (two-dose) (Fig. 5 b). Although zoster in-patient days are identical for both strategy 1 and strategy 2 for the first 27 years of vaccination, zoster morbidity with strategy 2 is higher between 27–65 years post-introduction. In the long term, however, strategy 2 would produce a lower number of zoster in-patient days than strategy 1 (a 97% reduction from the pre-vaccination period compared to an 81% reduction for strategy 1 at equilibrium).
VPZ (varicella plus zoster) morbidity
Figure 6 shows the estimated morbidity (overall annual in-patient days) due to VPZ over time following the introduction of vaccination for both strategy 1 (one-dose) and strategy 2 (two-dose). Strategy 2 is expected to produce more VPZ in-patient days than strategy 1 between 27 and 65 years after vaccination. At equilibrium, strategies 1 and 2 produce 80% and 92% reductions, respectively, in VPZ morbidity from the pre-vaccination period.
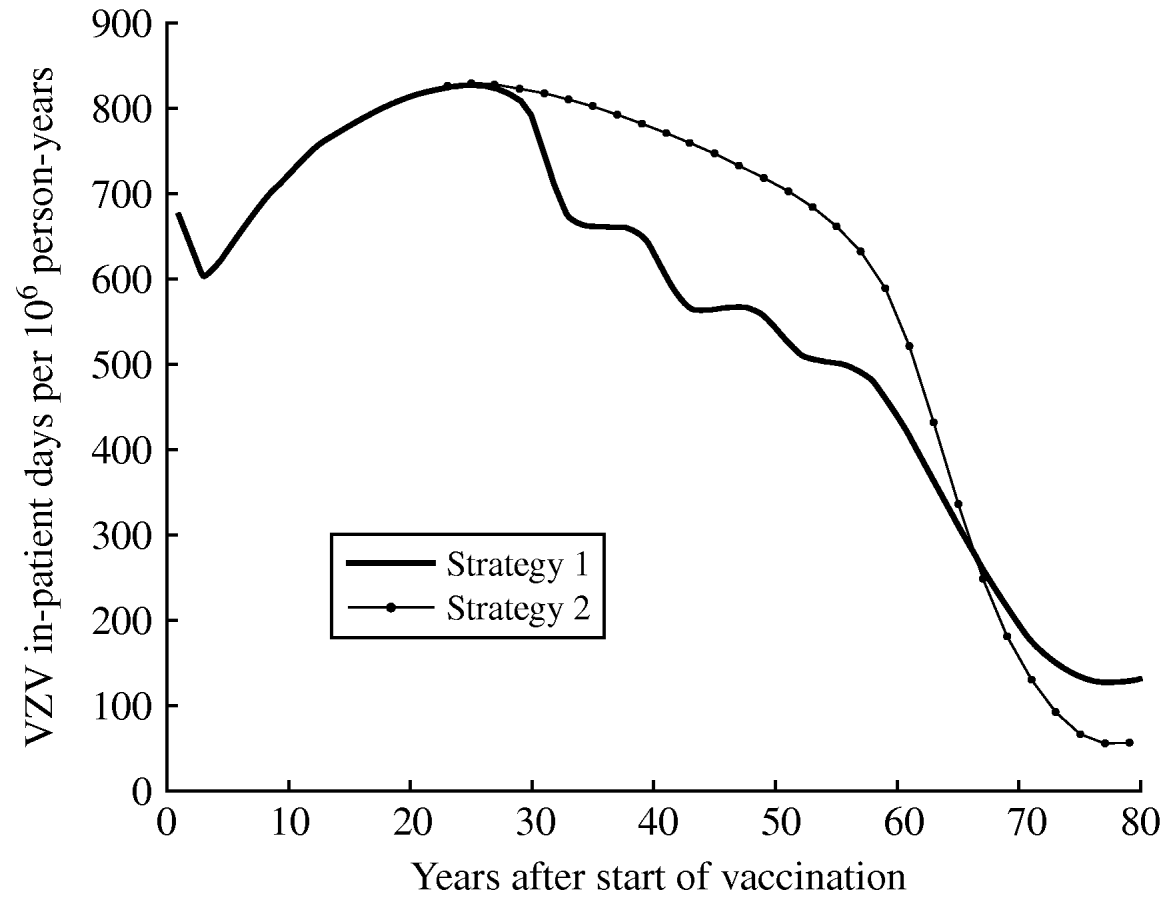
Fig. 6. Estimated morbidity (total annual in-patient days) due to VPZ (varicella plus zoster) by time since the introduction of vaccination (at year 0) for strategy 1 (one-dose) and strategy 2 (two-dose).
WAIFW matrix (sensitivity analysis)
The assortative matrix produces similar numbers of varicella and zoster cases to the base matrix at high vaccination coverage (90%). However, the proportional matrix produces much less varicella and zoster incidence than the base matrix because contact rates of proportional matrix are lower than the base matrix in all age groups except for the 2–4 years age group. At equilibrium for high vaccination coverage (90%) with strategy 1 (one-dose), the assortative matrix produces 9% more natural and 7% more breakthrough varicella incidence and 4% more zoster cases than the base matrix. The proportional matrix produces 17% less natural and 19% less breakthrough varicella incidence, and 42% less zoster cases. With strategy 2 (two-dose), the assortative matrix produces 16% more natural and 16% more breakthrough varicella incidence, while the proportional matrix produces 46% less natural and 51% less breakthrough varicella incidence. Both the assortative and proportional matrices produce very similar numbers of zoster cases to the base matrix (difference is around 20 cases at equilibrium) with strategy 2.
DISCUSSION
Our modelling results suggest a one-dose vaccination strategy (Australia's current vaccination schedule) would reduce varicella incidence (natural varicella cases) and morbidity but result in a high rate of breakthrough varicella cases (Fig. 1). A two-dose vaccination strategy is expected to not only produce less natural varicella cases but also substantially fewer breakthrough varicella cases (Fig. 3 c, d). A two-dose strategy is also expected to produce lower morbidity from varicella at high coverage levels (Fig. 2 a, b), despite a greater shift in the average age of infection (Fig. 2 c). At equilibrium with 90% coverage, a two-dose vaccination strategy has a VE that is 27% higher which means the infection risk is eight times lower than for the one-dose strategy. Hence, a two-dose strategy is optimal for achieving a reduction in natural varicella incidence and morbidity, as well minimizing breakthrough rates.
Our VE estimates at equilibrium (63% for one dose and 90% for two doses) are much lower than vaccine efficacy estimates reported for the 6–10 years follow-up of children vaccinated in two clinical trials (94–95% for one dose and 98% for two doses) [Reference Kuter18, Reference Vessey25]. This is because, with 90% population coverage at equilibrium (80 years after mass infant vaccination), there is a lower incidence of natural varicella and hence less opportunity for boosting vaccine-induced immunity. This leads to an increase in susceptibility in vaccinated people and thus higher rates of breakthrough varicella infection. The consequences are a higher RR and lower VE than at 10 years post-vaccine introduction. However, our VE estimates at the tenth year after vaccination, (90% for one dose and 99% for two doses) are more similar to the trial data. Our estimates for one-dose VE are slightly lower perhaps because they are based on post-licensure surveillance data (i.e. estimating effectiveness rather than efficacy) and that the licensed vaccine has a lower concentration of virus than that used in the trial. The VE for two doses was modelled using data from the trial by Kuter et al. [Reference Kuter18] rather than surveillance data, which may explain why the results are more similar than for one dose. However, despite the discrepancies we believe that VE estimates at equilibrium are more reliable for predicting the long-term impact of vaccination.
It seems unlikely that either a one-dose or two-dose vaccination strategy at high coverage results in a short-term reduction of zoster incidence and morbidity (Fig. 5). Zoster incidence stays higher than pre-vaccination levels for the first 30 years after vaccination for both the one- and two-dose strategies (Fig. 5 a). The predicted period for increased zoster cases is shorter than both previous predictions for Australia [Reference Gidding, Brisson and MacIntyre11] and for England and Wales [Reference Brisson, Edmunds and Gay22]. This is because our model includes higher levels of waning vaccine-induced immunity. It is not until the two-dose strategy has been implemented for >65 years that annual morbidity is less than for a one-dose strategy. In the 30–65 years after vaccination the two-dose strategy would result in higher zoster morbidity than a one-dose strategy because there is a higher proportion initially immune and a lower rate of waning immunity, meaning there are fewer new infections and therefore less opportunity for external boosting. However, in the longer term, a two-dose strategy would produce lower zoster morbidity than a one-dose strategy (Fig. 5 b).
There are some limitations with our study. Since the exact relationship between zoster and varicella is unclear, the simulated results of zoster in this study are only speculative under the assumption that exposure to varicella boosts immunity to zoster for 20 years [Reference Gidding, Brisson and MacIntyre11, Reference Brisson12]. In addition, we did not include the potential boosting effects of breakthrough varicella and zoster infections. Further research is needed in this area. Parameter P (percent where vaccine fails completely) was taken to be 4% for one-dose vaccination which is the same as Brisson et al.'s base-case estimate [Reference Brisson12], and 2% for two-dose vaccination (Table 2) under the assumption that the second dose of varicella vaccine should result in a 50% reduction in the probability of complete vaccine failure. The estimate of P is conservative compared to primary vaccine failure rates reported in the literature [Reference Michalik19, Reference Arvin and Gershon26–Reference Shinefield28]. The wide range of primary vaccine failure rates found in these studies makes it hard to estimate parameter P accurately and highlights the need for further studies. Evidence of rapid waning after vaccination followed by a constant level of protection was found in one case-control study [Reference Vazquez29]. This would suggest an alternative mechanism for waning where the rate changed with time, or that waning was rapid but only occurred for some vaccinees. Longer-term follow-up of vaccinees will be required to improve the description of waning immunity in models.
In conclusion, compared to one-dose, a two-dose infant varicella vaccination strategy in Australia is expected to further decrease varicella incidence (especially breakthrough varicella) and morbidity. In the long term, a two-dose strategy would also lead to lower incidence and morbidity from zoster compared to a one-dose strategy. However, in the short-to-medium term a two-dose schedule could increase zoster-related morbidity. This is highly dependent on the boosting effect of varicella and could be mitigated by using a vaccine against zoster [Reference Oxman30]. As more post-vaccination data become available, the effect on zoster will be clarified but in the long term, our study suggests that a two-dose infant vaccination programme would be a better vaccination strategy for Australia.
APPENDIX A: WAIFW MATRIX
The Who-Acquired-Infection-From-Whom (WAIFW) matrix was estimated using the standard technique developed by Anderson & May [Reference Anderson and May20]. The elements (βij) of the WAIFW matrix were estimated from the age group-specific pre-vaccination forces of infection which were calculated using Australia's national serosurvey data [Reference Gidding15]. The structures and elements of the WAIFW matrix (8×8 matrix) are as follows.
Base matrix
Estimated elements of the matrix are effective contacts per susceptible per year
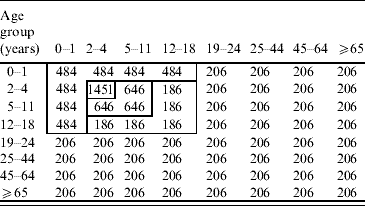
Assortative matrix
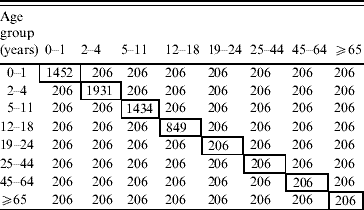
Proportional matrix
APPENDIX B
Model structure and parameters
Flow diagrams and equations of models 1 and 2 (Figs 7 and 8) are extracted from Brisson's paper [Reference Brisson12] and Australian model parameters (Table 3) are from Gidding's paper [Reference Gidding, Brisson and MacIntyre11].
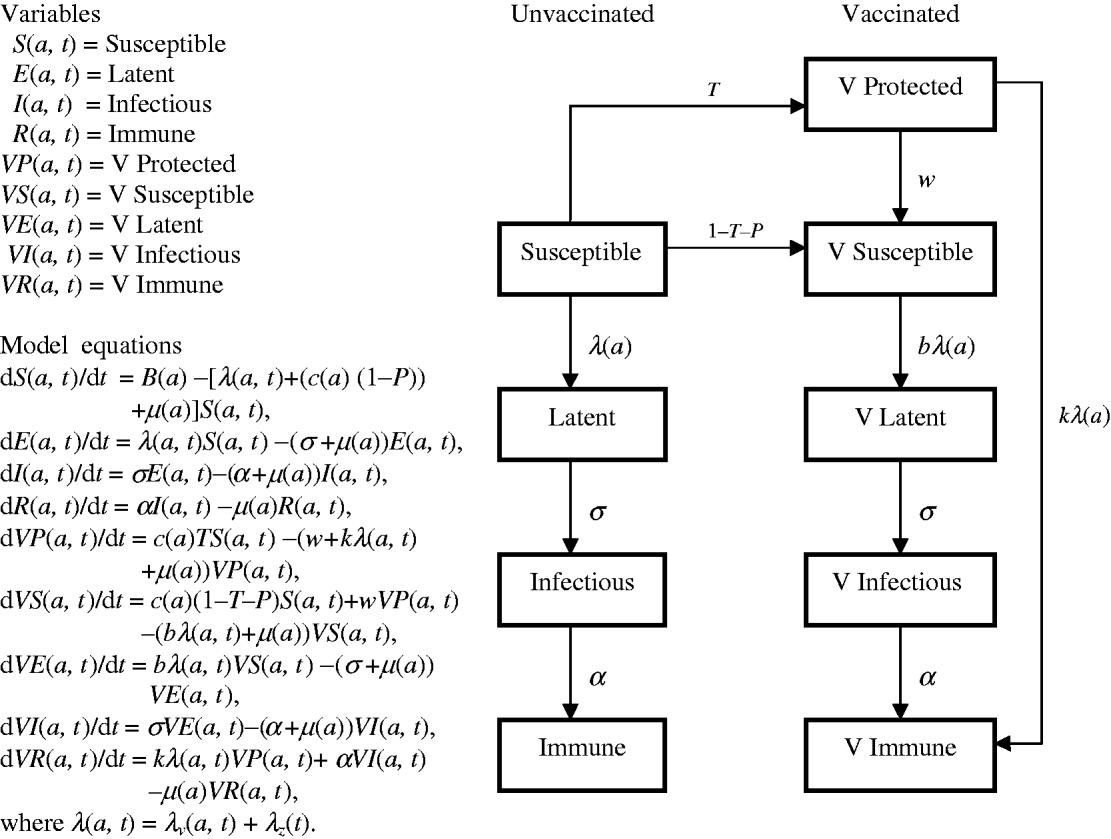
Fig. 7. Model 1 represents the transmission dynamics of varicella.
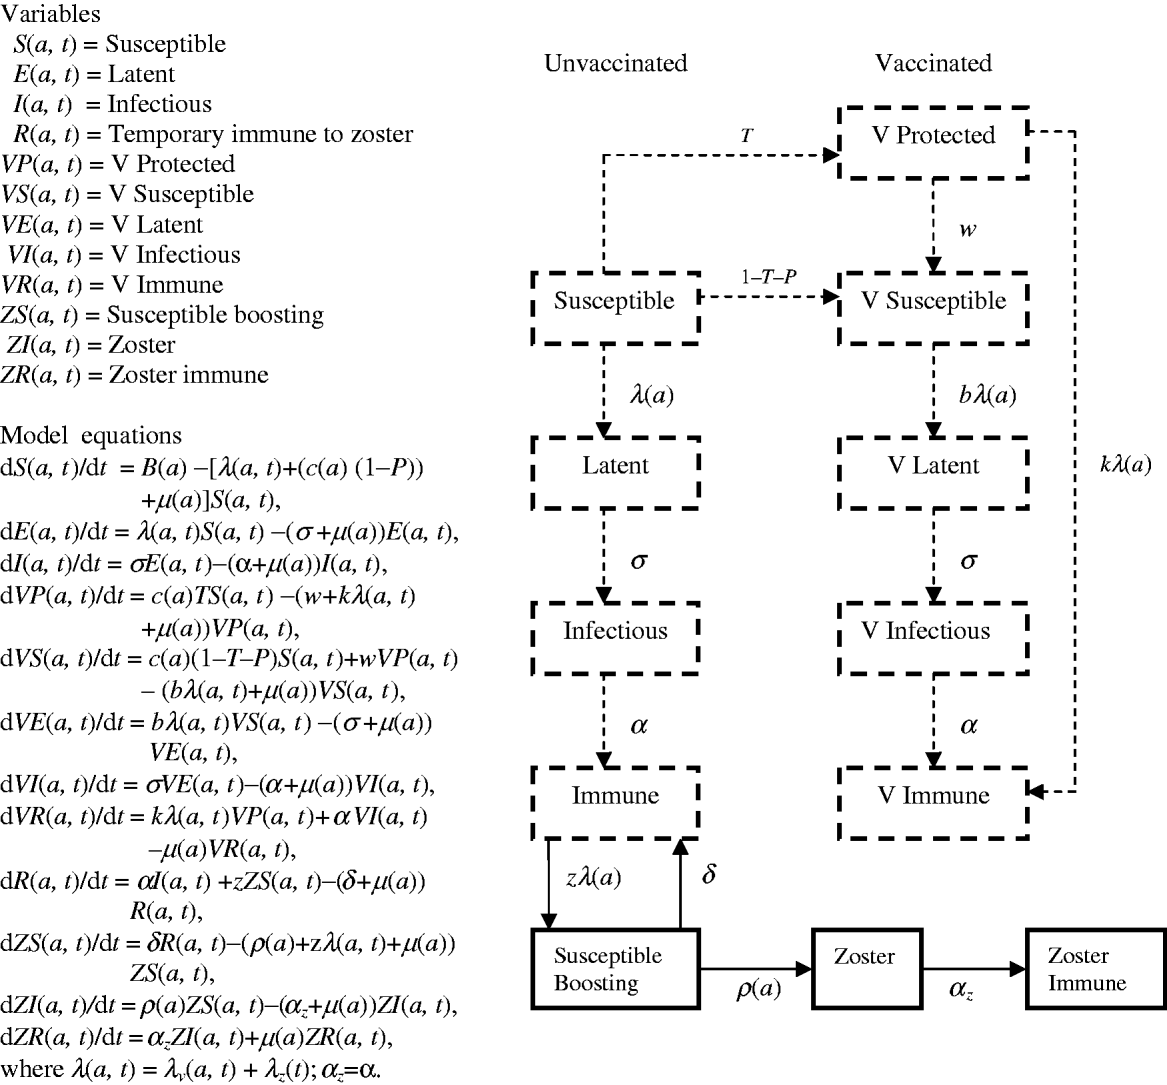
Fig. 8. Model 2 represents the transmission dynamics of both varicella and zoster.
ACKNOWLEDGEMENTS
NCIRS and NCHECR are supported by The Commonwealth Department of Health and Ageing. NCIRS is also supported by The NSW Department of Health and The Children's Hospital at Westmead. NCHECR is affiliated with the faculty of Medicine, The University of New South Wales. J.G.W. is supported by National Health and Medical Research Council (Australia) Grant No. 358425.
DECLARATION OF INTEREST
None.


