About 64 % of all people living with HIV in the world are from sub-Saharan Africa (UNAIDS, 2006). The UNAIDS (2006) report adds that although Uganda saw a steep decline in the prevalence of HIV during the mid and late 1990s, around 1 million people were living with HIV by the end of 2005, and the national HIV prevalence was 6·7 %. In Uganda, nearly 80 % of those infected with HIV fall into the age range 15–45 years, a most economically productive age group and often their families' bread-winners (Ministry of Health, 2003; Uganda AIDS Commission, 2003; UNAIDS/WHO, 2004).
AIDS is currently responsible for 12 % of total annual deaths in Uganda and is a leading cause of death among people aged 15–49 years (Garbus & Marseille, Reference Garbus and Marseille2003; Ministry of Health, 2003). The loss of productive workers and the increase in health-care and social service spending has resulted in difficult decisions about resource allocations across all government sectors and has increased the food insecurity of affected households because of impoverishment, therefore reducing households' ability to buy food in urban settings. According to the HIV/AIDS surveillance report by the Ministry of Health (2006), Jinja is among the towns in Uganda with a high urban prevalence rate of HIV (10 %). This is not only higher than the national urban prevalence (7·2 %) but also higher than the HIV prevalence among the general population (6·7 %).
Research shows that, within households affected by HIV, there is an increased risk of food insecurity as sick members are unable to work, income declines, expenditure on health care increases and care-giving burdens increase (Crush et al. Reference Crush, Frayne and Grant2006). It has been noted that food insecurity among HIV-affected households in urban settings is also a result of the fact that as poor households in urban areas struggle to meet urban expenses, the type, quantity and quality of food consumption tends to be an area of cut-back since this is not viewed as a fixed and absolute expense. Food consumption has been found to drop by 40 % in households affected by HIV/AIDS (Topouzis, Reference Topouzis1999).
Several studies in developing countries also point out that people living with HIV/AIDS (PLWHA) in resource-limited settings are often unable to follow optimal food and nutrition recommendations for antiretroviral therapy owing to lack of access to the foods required (Castleman et al. Reference Castleman, Seumo-Fosso and Cogill2003). In the event of food insecurity among other factors in countries such as Uganda, attaining the at least 95 % adherence required for antiretroviral regimens to be fully effective and for avoiding the emergence of resistant strains of the virus (Paterson et al. Reference Paterson, Swindels and Mohr1999) is a serious concern. In addition, it has been revealed that the provision of food aid on its own to PLWHA is unlikely to have a marked impact on nutrition, morbidity, survival, food security and general quality of life (Swindale, Reference Swindale2004; Emergency Nutrition Network, 2005).
As HIV/AIDS negatively impacts household food security status, it is crucial to identify how households respond to the impact of HIV/AIDS on food security, in order to identify positive food security entry points and design strategies that can effectively alleviate food insecurity. The present study reveals how HIV-affected households in an urban Ugandan setting respond to food shortages and the interrelations between practice of agriculture, food security and dietary diversity among these households.
Methodology
Study population and design
The subjects (PLWHA) were residents of Jinja Municipal Council or Mafubira sub-county in Jinja district, eastern Uganda. Data were collected in 2005 from households in which the respondents were HIV-infected adults (aged 15–49 years) receiving services from either The AIDS Support Organization, the Jinja Network of People Living with HIV/AIDS or the AIDS Orphans Education Trust in Jinja town. In this cross-sectional study, 160 randomly recruited, HIV-infected adults were contacted, of whom 144 participated. Interviews were conducted in local languages (both Lusoga and Luganda).
PLWHA were eligible for the study if they were aged 15–49 years and residents of any of the three divisions in Jinja Municipal Council (Mpumudde, Jinja central, Walukuba) and Mafubira sub-county. The study excluded potential participants at recruitment if they were bed-ridden or mentally unable to answer the questionnaire. Face-to-face interviews conducted at respondents' homes were used to collect data on sociodemographic and socioeconomic characteristics, frequency of food consumption, dietary diversity, practice of agriculture and food security. Practice of agriculture in this study refers to the growing of food crops, fruits and vegetables, and the raising of animals, poultry, bees, rabbits and other livestock considered to be edible locally, within and around the town.
Food security measurement
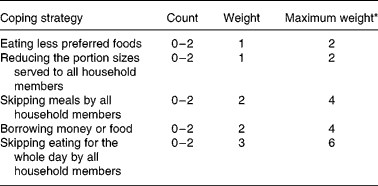
Information obtained from the questionnaire on food security index was summarised into a single number by calculating a weighted sum of the different coping strategies in which the weights reflected the frequency of use by the household and the severity of the different strategies (Maxwell, Reference Maxwell1996; Hoddinott, Reference Hoddinott1999; Maxwell et al. Reference Maxwell, Ahiadeke, Levin, Armar-Klemesu, Zakariah and Lamptey1999). Based on this method, different responses were first given counts as ‘Often’ (almost every day) = 0, ‘Sometimes’ = 1 and ‘Never’ = 2. Weights were then given to different coping strategies as shown in Table 1.
Table 1 Individual coping strategies and food security index

* The cumulative weight (food security index) for individual households varied from 0 to 18.
The cumulative index or weight for individual households varied from 0 to 18; the higher the sum, the more food-secure the household was (Table 1). This method was chosen because it has been shown to be easy, taking less than 3 min per household, directly captures notions of adequacy and vulnerability, and contains questions that respondents find easy to understand (Hoddinott, Reference Hoddinott1999; Maxwell et al. Reference Maxwell, Ahiadeke, Levin, Armar-Klemesu, Zakariah and Lamptey1999).
Household dietary diversity score
This was calculated as the sum of the number of different food groups consumed within the household in the 24 h prior to the assessment (Hoddinott, Reference Hoddinott1999). The twelve food groups considered in this study were: cereals; roots/tubers; legumes; milk/milk products; fish; poultry; meat; eggs; fruits; vegetables; oils/fats; sugar/honey. To establish the household dietary quality of the study population, the total number of food groups eaten was divided by the total number of households surveyed. This has been shown to serve as a proxy indicator of micronutrient intake of a given population and also denotes the quality of diet eaten (Hoddinott, Reference Hoddinott1999; Swindale & Ohri-Vachaspati, Reference Swindale and Ohri-Vachaspati2004; Swindale & Bilinsky, Reference Swindale and Bilinsky2005).
Socioeconomic status
Household socioeconomic status was determined using the employment status of the respondent and the stated income (when respondents were willing to disclose it), the number of household members engaged in income generation, the ownership and type of housing, land and a range of consumer durable assets (Maxwell et al. Reference Maxwell, Levin and Csete1998; Mugisha & Arinaitwe, 2003). Socioeconomic status index was calculated as a continuous cumulative score variable by attributing a score of 1 to each of the above factors reported in the household.
Statistical analysis
Statistical package SPSS version 12 (SPSS Inc., Chicago, IL, USA) was used in data-cleaning and analysis. After data-cleaning and transformation, analysis was performed to show associations between food security and several independent variables of interest. Using the chi-square test and correlations, associations between subjects' dietary diversity, access to food aid, food security and practice of agriculture were also examined. Statistical significance was set at 95 % CI, and for all statistical tests P ≤ 0·05 was considered significant.
Ethical considerations
The study was presented to several review boards, including the Department of Food Science and Technology of Makerere University, Uganda National Council for Science and Technology and The AIDS Support Organization research committee. After incorporating suggestions and corrections, permission to conduct research in the study area and consent from PLWHA were sought accordingly. Due care was taken to ensure that all those who accepted to participate in the study did so voluntarily and gave their informed consent.
Results
Sociodemographic and socioeconomic characteristics of subjects
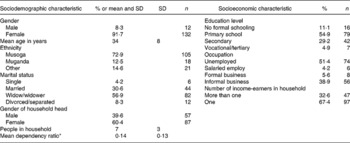
The mean age of the respondents was 34 years, and the highest proportion (57 %) of the respondents were widowed (Table 2). Most of them belonged to the Basoga tribe (73 %) and the religious denomination of Protestant (42·8 %). The majority of the study households (60 %) were headed by women, and the average household size was seven, the largest household having eighteen members and the smallest just two. Most of the respondents had primary-level education (55 %), and a small proportion had no formal education (11 %). The majority were also unemployed (51·4 %), and most households had only one income-earner (67·4 %).
Table 2 Percentage and frequency distribution of the study participants by sociodemographic and socioeconomic characteristics

* Mean dependency ratio, calculated as the ratio of the number of income-earners in a household to household size.
Practice of agriculture within and around town
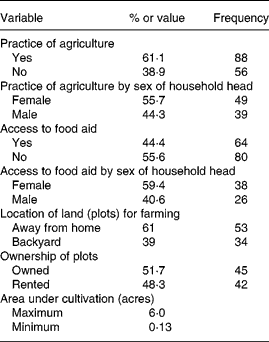
Almost 61 % of the households interviewed engaged in some form of agricultural production within and around Jinja town (Table 3). Almost all farming households (94·7 %) noted that access to food for direct consumption was their primary reason for engaging in agricultural production (Table 4). Respondents also reported that food from farming was not the major source of food for the household but constituted one important source and was also utilised as a reserve for times when there was inadequate or unavailable income for the purchase of food. Only a few respondents reported selling off agricultural output to meet other household needs. Thus, even for those who sold, merely a small proportion of the income obtained was spent on buying more household food (Table 4). The reported foods mainly purchased by subjects were banana (matooke), sweet potatoes, maize flour, rice, fish and beans.
Table 3 Practice of agriculture, access to food aid and access to land for farming

Table 4 Proportion of households engaged in commercial agriculture

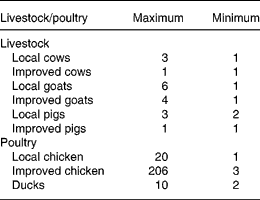
The crops mainly grown were staple produce (maize, sweet potatoes, cassava, beans), and the livestock reared were cows and pigs (Tables 5 and 6). Considerably lower proportions of households planted other crops and reared other livestock. The practice of agriculture was mainly reported in households with larger numbers of people (F 1, 143 = 9·199, P = 0·003) and was also significantly associated with household socioeconomic status (F 1, 143 = 68·148, P = 0·000). Most households that were engaged in practice of agriculture reported that although they owned their plot (52 %), this was located away from home (61 %). The maximum area under cultivation was 6 acres, and the minimum 0·13 acres (see Table 3 earlier).
Table 5 Households involved in different agricultural activities

Table 6 Number of livestock and poultry

Household food security
Bivariate analysis showed that practice of agriculture within and around the town was significantly associated with household food security (F 1, 143 = 9·199, P = 0·003). In addition, households with high numbers of dependants were more at risk of food insecurity [r (n = 144) = − 0·165, P = 0·04]. Households that had low food security scores (therefore being more vulnerable to food insecurity) also reported reducing household size to cut down on food costs (F 1, 143 = 14·465, P = 0·000) and selling off non-productive household assets to buy food (F 1, 143 = 14·148, P = 0·000). These were among the coping responses to improve household food security (Table 7).
Table 7 Coping mechanisms in response to household food insecurity

The HIV/AIDS pandemic has most likely increased the inability of affected households to put enough food on the table, possibly because of the continued decrease in productivity of these households resulting mainly from the increased medical costs for the PLWHA. In the present study, 94·4 % of the PLWHA reported some form of opportunistic infection in the 2 weeks prior to the survey that reportedly hindered the effective provision of labour in their business or farm. The conditions reported mainly included fever/cough (83·3 %), joint pains (65·3 %), general body weakness (60 %), abdominal pain (42·4 %), nausea/vomiting (35·7 %) and diarrhoea (34 %).
Dietary diversity score
The dietary diversity score ranged from one to ten food groups. The average dietary diversity score in the survey sample was 6 ± 2. More than half of the study households (59 %) reported consuming fewer than six food groups in the 24 h prior to the survey. The food groups mainly consumed were cereals (88·3 %), sugar/honey (86·9 %), vegetables (84·8 %), legumes (70·3 %) and oils/fats (69·7 %). The consumption of a diverse diet was significantly associated with household socioeconomic status [r (n = 44) = 0·164, P = 0·04], food security score [r (n = 144) = 0·357, P = 0·000], access to food aid (F 1, 143 = 8·581, P = 0·004) and practice of agriculture (F 1, 143 = 5·987, P = 0·016). A scatter plot of the association between dietary diversity score and household food security showed a significant increase in the number of food groups consumed with increased food security score (Fig. 1).

Fig. 1 Scatter plot of food security score v. dietary diversity score.
Access to food aid most likely enables households to save money for buying additional foods. Likewise, households engaged in the practice of agriculture were also more likely to consume a diverse diet compared with their counterparts (Fig. 2). The findings suggest that, other than enhancing quantities of food, the practice of agriculture within and around town also offers nutritional benefits for the households engaged in it. A study on the practice of agriculture by urban residents in Kenya revealed that farming households had higher energy and protein consumption than their counterparts (Mwangi, Reference Mwangi1995).

Fig. 2 Relationship between dietary diversity score, practice of agriculture and access to food aid.
Households that reported the practice of agriculture also had a higher consumption of cereals [χ2 (n = 144) = 11·456, P = 0·001], fruits [χ2 (n = 144) = 4·231, P = 0·04] and vegetables [χ2 (n = 144) = 10·954, P = 0·001] than non-farming households. Non-farming households were therefore more susceptible to food insecurity and a low consumption of the fruits and vegetables that boost immunity.
Discussion
This study provides a picture of the devastating contribution of HIV/AIDS to household food insecurity among HIV/AIDS-affected households in an urban Ugandan setting. Various coping mechanisms identified in the households of PLWHA, such as eating less preferred foods (95 %), reducing the portion sizes served to all household members (82·6 %), borrowing money or food (77 %), skipping meals by all household members (62·3 %) and skipping eating for the whole day by all household members (21·5 %) have negative repercussions, as reported also by Kraak et al. (Reference Kraak, Pelletier, Frongillo and Rajabiun1999).
A continued deterioration in productivity among PLWHA in these households, resulting mainly from increased opportunistic infections and a high expenditure on health care, has most likely increased the inability of affected households to put enough food on the table. As most urban households do not have access to land for their own food production, food access hinges primarily on the household's ability to purchase food. Therefore, access to food becomes more difficult among HIV-affected households, especially when one or more of the productive members can no longer bring in income.
Several scientific studies have demonstrated a similar direct deleterious link between HIV/AIDS and household food insecurity (UNAIDS, 2003; Gillespie et al. Reference Gillespie, Kisamba and Loevinsohn2004). These studies have also indicated that, within HIV/AIDS-affected households, income and food reserves are severely reduced, and savings and assets depleted, to meet health-care, living and funeral costs. In HIV-affected households, prolonged illness of the productive adults in the family has been shown to compromise the household's access to adequate food as a result of reduced agricultural production, diminished income and savings (UNAIDS, 2003; Gillespie et al. Reference Gillespie, Kisamba and Loevinsohn2004). Kraak et al. (Reference Kraak, Pelletier, Frongillo and Rajabiun1999) reports that when one or both heads of the household are living with HIV/AIDS, the result is a drop in household production and income due to the reduction in the household labour force and a shift in spending from food to medicine, which affects availability and access. Moreover, families often purchase poorer quality, less nutritious food as incomes shrink, affecting utilisation of nutrients.
A study conducted in three main urban areas of Malawi to analyse the linkages between HIV/AIDS and food security among urban households showed that HIV/AIDS affects food security through its negative effects on human capital, financial capital and social capital (Palamuleni et al. Reference Palamuleni, Kambewa and Kadzandira2003). In the same study, HIV/AIDS-related illnesses among the working cohort resulted in a direct income loss through withdrawing from work (100 %) or reducing the amount of time and input. This study in Malawi estimates an income loss of approximately 60 %.
The practice of agriculture was mainly reported in households with larger numbers of people and was also high among the lower socioeconomic status households, possibly as a means to secure sufficient food and possibly as a coping mechanism to augment inadequate access to food. In addition, households with larger numbers of people also possibly had sufficient labour for production. However, lack of land for cultivation, insufficient labour, especially in households in which two or more people were living with HIV/AIDS, frequent illness, long distances to reach the farming plots, and lack of access to credit, inputs and markets were cited as the major hindrances to the practice of agriculture.
The results of the present study suggest that the practice of agriculture within and around town by households of PLWHA is a positive coping strategy in the face of food shortage since it contributes to household food security status and quality of food eaten as well. As in many other cities, however, the practice of agriculture within and around Jinja town complements rather than supplants rural supplies. The practice of agriculture within and around the town makes a significant contribution to food access among the households of PLWHA.
The value of dietary diversity has long been recognised, and when people eat a variety of foods, they are more likely to meet their needs for a wide range of essential nutrients (Arimond & Ruel, Reference Arimond and Ruel2004). PLWHA in particular need energy- and nutrient-dense foods to meet their dietary needs. Yet for many poor households and PLWHA, especially in developing countries, dietary diversity is very low, as shown by the findings of the present study. The majority of study households reported consuming fewer than six food groups (a low-quality diet), and their daily diet was dominated by one main staple food group, in this case mainly cereals.
The findings of the present study also showed that food aid played a positive role in mitigating the impact of HIV/AIDS among households through improved dietary quality for PLWHA and their immediate family members. For households without adequate resources to purchase or produce needed food, food aid reportedly prevents the selling of productive and non-productive assets or may permit existing income to be used for education or the purchase of income-producing materials. However, combining food aid with income-generating activities should be a way of helping households to deal with their reduced access to food and of building self-sufficiency in households coping with chronically ill relatives or the death of a family member from AIDS. In addition, well-designed, targetted food aid programmes should also promote the use of locally grown foods in combination with food from external sources in order to avoid creating a dependency on food aid.
Acknowledgements
We express our sincere thanks to Nestlé Foundation for funding this study. We are also grateful to the staff of The AIDS Support Organization, Jinja, the Jinja Network of People Living with HIV/AIDS, and the AIDS Orphans Education Trust, without whom this study would not have been implemented.


