INTRODUCTION
Community-acquired pneumonia (CAP) is the cause of 500 000 hospitalizations and 45 000 deaths per year in the USA. The overall health impact of pneumonia in the USA was even more dramatic taking into consideration that hospital-acquired pneumonia (HAP) developed in 0·5–1·7% of patients [Reference Masterton1]. Worldwide, pneumonia is a major cause of morbidity and mortality attributable primarily to CAP, with annual incidence varying from 1% to 12% according to different estimates [Reference Mandell2].
Although alcohol has often been considered as one of the factors increasing host susceptibility to pneumonia, current data on alcohol and the risk of pneumonia are derived primarily from case-series of patients [Reference Koivula and Marrie3], which do not allow quantifying any apparent association between alcohol consumption and pneumonia due to the lack of control groups. Evidence from epidemiological studies using case-control or cohort designs has been scarce, and a review of risk factors for CAP concluded insufficient evidence for a causal link between alcohol and CAP [Reference Kohlhammer4].
To date, no meta-analysis has quantified the association between alcohol consumption and risk of CAP. The current investigation therefore undertook a systematic review and meta-analyses of case-control and cohort studies to (a) quantify the dose–response relationship between alcohol consumption and incidence of CAP; (b) quantify the risk of CAP associated with alcohol-use disorders (AUD); and (c) examine possible pathways.
METHODS
Outcome measure
In this study the outcome measure was CAP morbidity and/or mortality. Diagnosis had to meet the criteria of the International Classification of Diseases (ICD) depending on the time of publication: 480–486 in ICD-8, 481–486 in ICD-9 and J10–J18 in ICD-10.
Search strategy
We systematically searched Ovid Medline, EMBASE, Web of Science, ETOH and AIM (from January 1980 to August 2009), with no language restrictions, for studies in humans of the association between alcohol consumption and risk of pneumonia. Our search terms included any combination of the key words ‘alcohol’, ‘alcohol consumption’, ‘alcohol intake’, ‘ethanol’, ‘alcoholism’, ‘heavy drinking’, and ‘pneumonia.’ We also reviewed reference lists of the identified studies and review articles to search for additional studies. In order to examine possible pathways we performed an additional search of relevant and most up-to-date medical literature reviews on the effects of alcohol consumption on processes affecting the susceptibility to pneumonia.
Inclusion and exclusion criteria
Our inclusion criteria required studies to have a case-control or cohort study design and have CAP morbidity and/or mortality as the endpoint. We also specified that for dose–response analysis the studies must either report risk estimates [hazard ratios, relative risks (RRs), or odds ratios] with 95% confidence intervals (CIs) across at least three categories of alcohol consumption (e.g. abstainers; 0·1–20 g pure ethanol per day; 21–40 g pure ethanol per day and >40 g pure ethanol per day), or must report sufficient data to estimate these. In the following the term RR will be used to denote risk estimates. Studies were excluded if a cross-sectional design was used, if they were not published as full reports, such as conference abstracts and letters to editors; or if a continuous measure of alcohol consumption was reported. If multiple published reports were available from the same study, we included only the one with the most detailed information on the relationship in question.
Data extraction
Data were extracted from each study using a standardized spreadsheet. Information extracted included the following: title, author, year of publication, year of study, sample size, country, region, ethnicity, age, sex, endpoints, adjustments, study design, methods of interview, time-period of alcohol consumption, and response rates. We also extracted the RRs and their corresponding 95% CIs for each category of alcohol consumption. In two studies, separate RRs and 95% CIs were provided for women and men – these RRs and the CIs were also extracted. When ranges of alcohol categories were reported, the midpoint was taken. In cases where no upper bound for the highest category existed, 75% of the width of the previous category's range was added to the lower bound to derive the midpoint. For all studies, the information was independently extracted by two reviewers; differences were resolved where necessary with help of a third person.
Statistical analysis
To assess the dose–response relationship between alcohol consumption and risk of pneumonia, we used the method proposed by Greenland and colleagues [Reference Greenland and Longnecker5, Reference Orsini and Greenland6] to back-calculate and pool the logarithmized risk estimates. To derive the dose–response curve, we fitted a family of first- and second-degree fractional polynomial models [Reference Royston and Sauerbrei7]. All models were fitted using DerSimonian & Laird's random-effects models [Reference DerSimonian and Laird8]. The best-fitting model was selected based on a closed-test comparison between fractional polynomial models [Reference Royston and Sauerbrei7] and overall model fit was assessed using the Q statistic [Reference Higgins and Thompson9]. These analyses were completed using the glst command in Stata version 10.1 [10].
Statistical heterogeneity among studies was examined using both the Cochrane Q test and the I 2 statistic [Reference Higgins and Thompson9]. A funnel plot with pseudo-95% CIs was used for visual assessment of publication bias. To test for publication bias, we used the Stata command metabias, which performs Egger's regression asymmetry test [Reference Egger11] and the Begg-adjusted rank correlation test [Reference Begg and Mazumdar12]. All statistical analyses were completed using Stata 10·1 [10].
In addition, categorical analyses were conducted for studies comparing people with AUD against non-AUD (reference category), again using a DerSimonian & Laird random-effects model [Reference DerSimonian and Laird8] to derive a summary RR. We used the metan command in Stata 10.1 to complete this analysis [10].
RESULTS
Characteristics of included studies
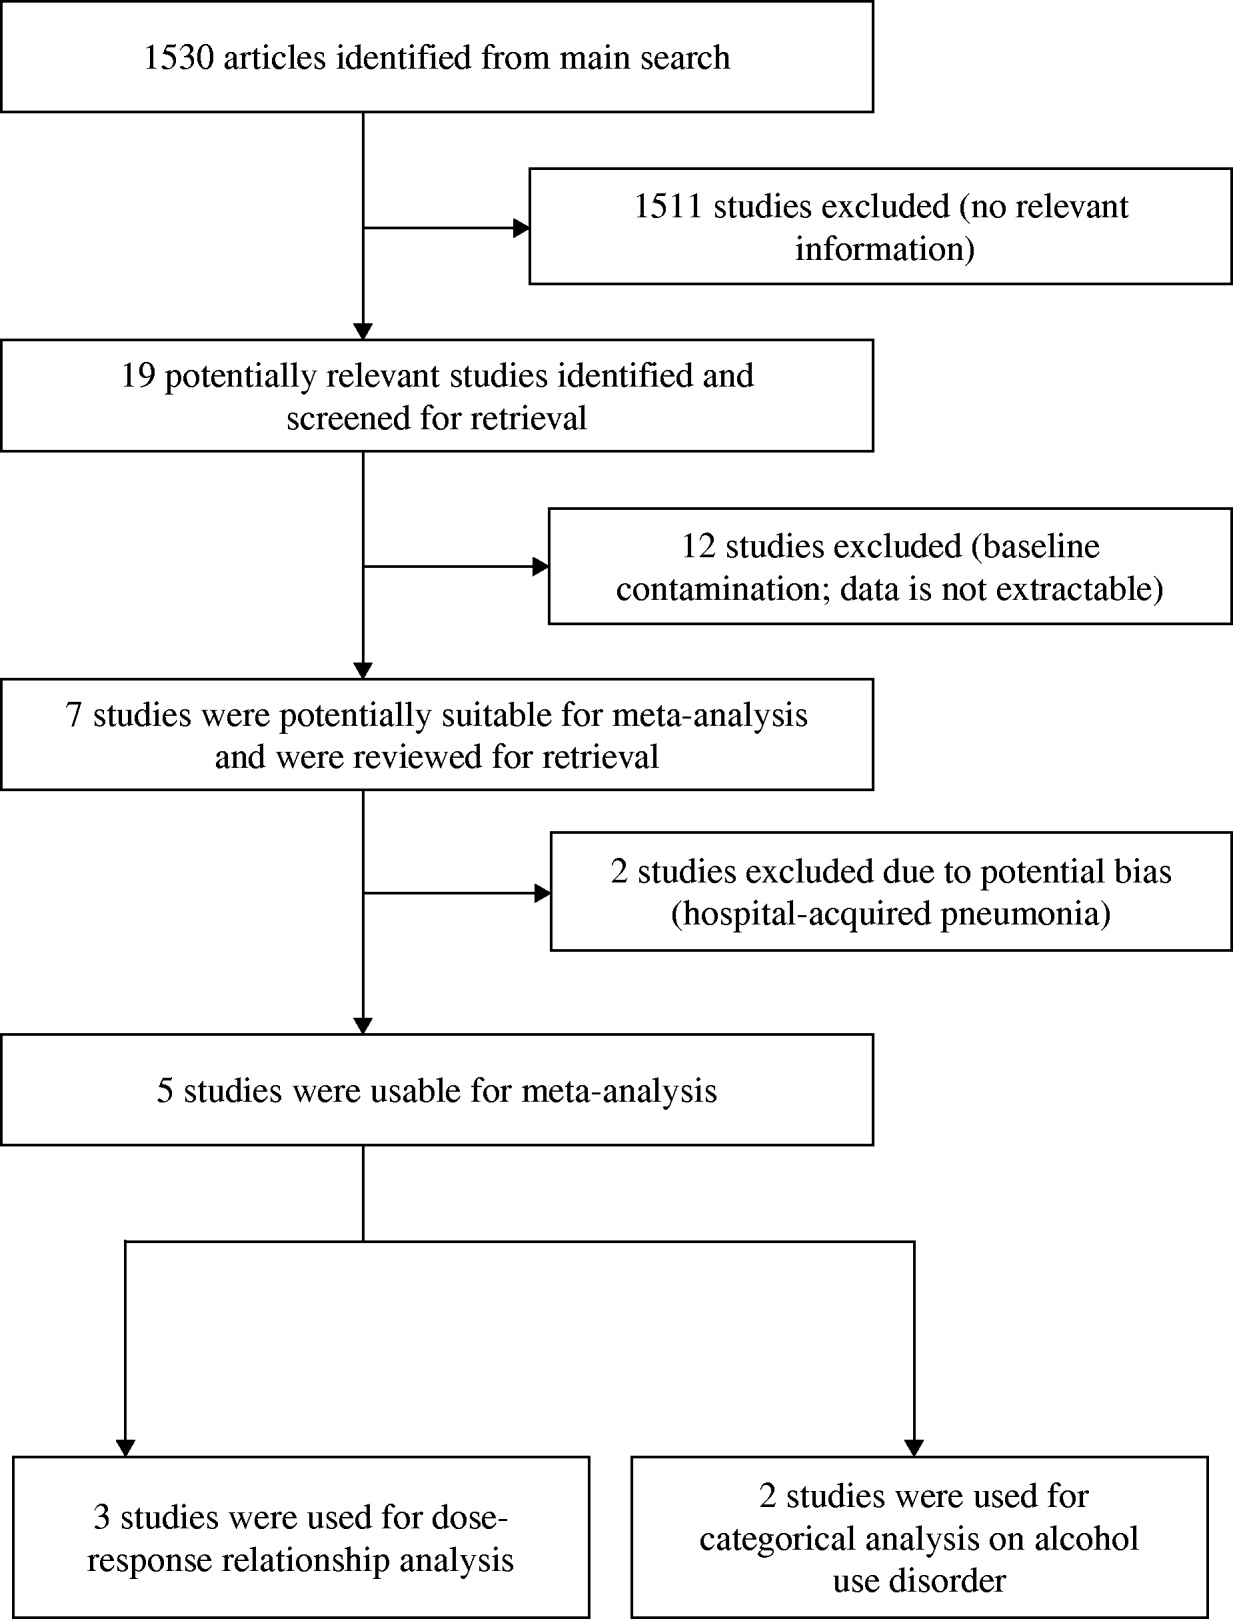
We identified five studies (providing seven datasets) that met the inclusion criteria, three of which (five datasets) were suitable for dose–response analysis (see Fig. 1). Three studies reported the results undifferentiated by sex, while two studies reported the results by sex. Two studies on HAP [Reference Gacouin13, Reference Bard14] were excluded from analysis due to potential sampling bias. Table 1 summarizes the characteristics of the included studies. Three studies were conducted in Spain, while USA and Finland each contributed one study. Collectively, the five included studies had a total of 112 100 individuals with 2371 cases of CAP. A detailed description of included studies is provided in Table 1.

Fig. 1. Study selection process.
Table 1. Characteristics of included studies

CAP, Community-acquired pneumonia; COPD, chronic obstructive pulmonary disease.
Association of AUD and the risk of CAP
Two studies [Reference Koivula, Sten and Mäkelä15, Reference Fernández-Solá16] provided risk estimates that allowed us to examine the association between people with clinically defined AUD (i.e. alcohol abuse or dependence diagnosed by a physician or AUD defined by the presence of alcohol withdrawal syndrome) and the risk of CAP. People with AUD as defined above had an eightfold increased risk of CAP (RR 8·22, 95% CI 4·85–13·95) compared to people without AUD.
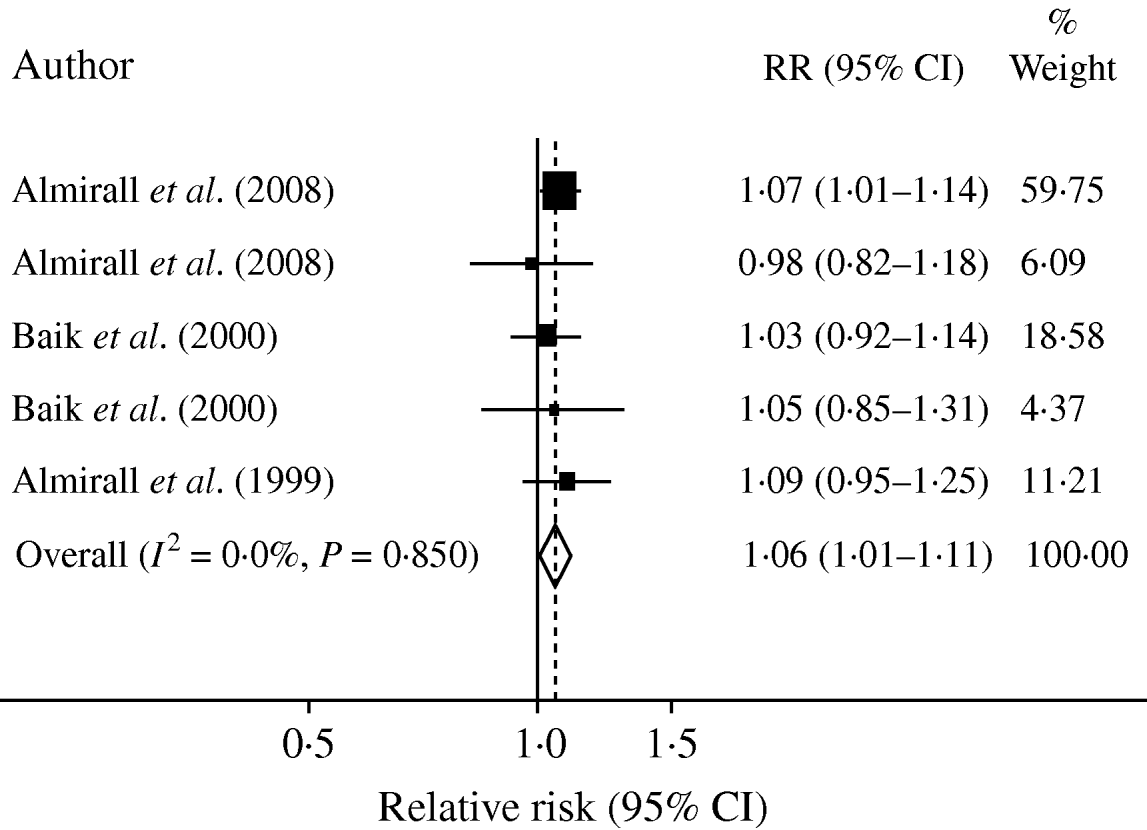
A formal meta-analysis of RR of the onset of CAP and alcohol consumption yielded a pooled RR of 1·06 (95% CI 1·01–1·11) per standard drink of 12 g pure alcohol per day as shown in Figure 2. As one of the datasets contributed about 60% of the total number of subjects, pooled RR was recalculated excluding this dataset as a sensitivity analysis. Recalculation yielded a pooled RR of 1·04 (95% CI 0·97–1·12) per drink similar to the results of the original analysis but lacking statistical significance due to the decreased number of subjects.

Fig. 2. Forest plot of individual datasets based on one drink (12 g) daily.
Dose–response relationship
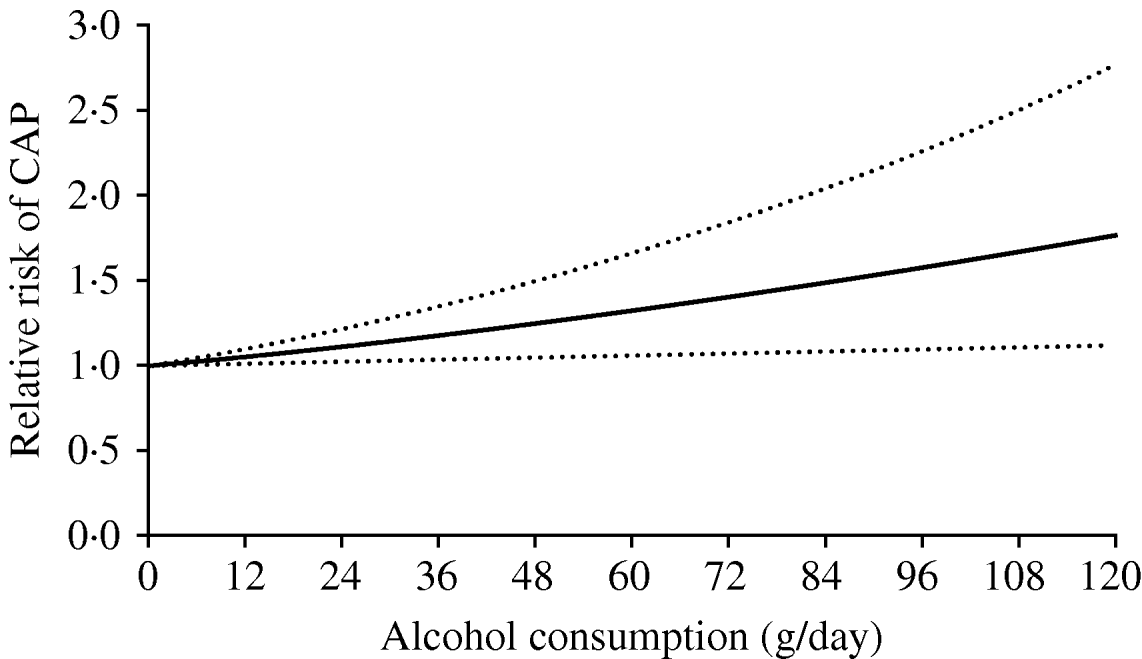
A total of 44 fractional polynomial models (eight first- and 36 second-degree models) were fitted and compared using the closed test procedure. The random-effects linear model (P=1) provided the best fit to the data (Q=14·44, d.f.=20, P=0·808, I 2=0%, 95% CI 0–47). Figure 3 depicts the dose–response relationship between alcohol consumption and the risk of CAP. Results show that the risk of pneumonia increased linearly with increasing alcohol consumption. Individuals consuming 24, 60, and 120 g alcohol daily had RRs of 1·12 (95% CI 1·02–1·23), 1·33 (95% CI 1·06–1·67) and 1·76 (95% CI 1·13–2·77), respectively, relative to non-drinkers.

Fig. 3. Meta-analysis of studies showing the linear dose–response relationship between alcohol consumption and the risk of community-acquired pneumonia (CAP).
Publication bias
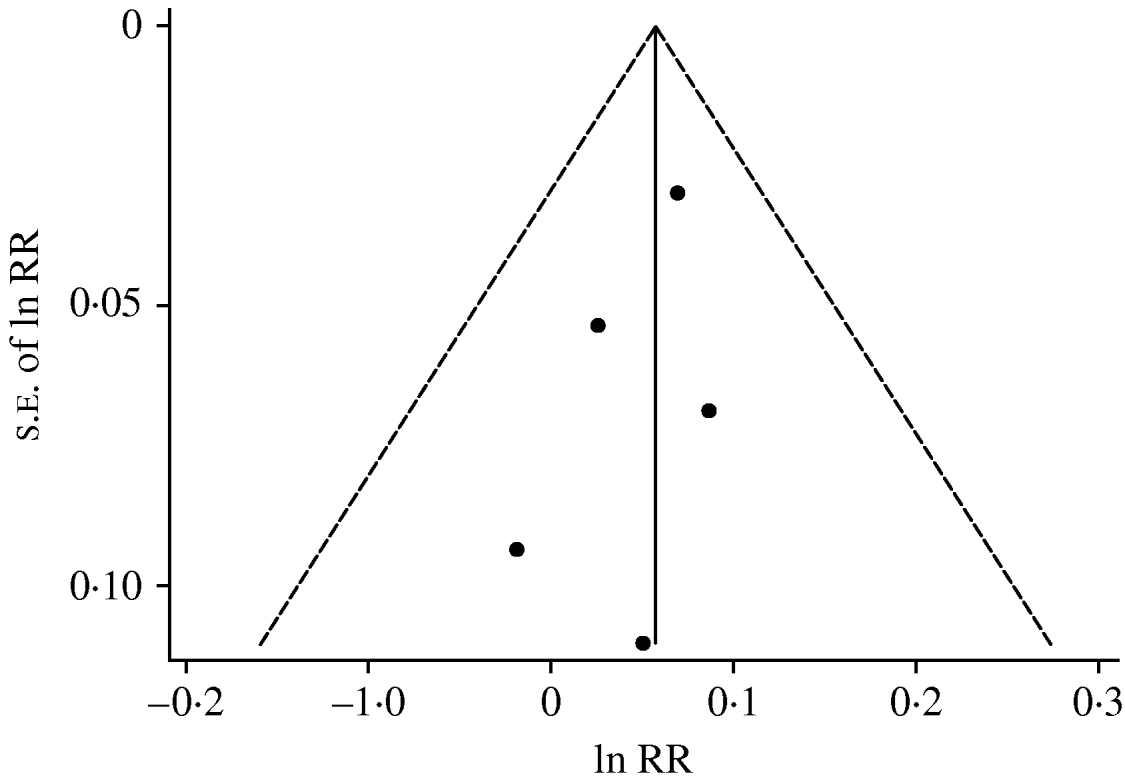
Figure 4 plots the natural logarithms of RRs against their standard errors for the five datasets that were included in the dose–response analysis. The funnel plot showed no evidence of asymmetry. Both Begg's (P=0·462) and Egger's (P=0·372) tests also suggested no significant asymmetry of the funnel plot, indicating no evidence of publication bias.

Fig. 4. Funnel plot with pseudo-95% confidence limits. ln RR=natural logarithm of relative risk; s.e.=standard error.
DISCUSSION
The results of the meta-analysis showed a strong and consistent relationship between alcoholism and the risk of CAP with a RR of 8·22 (95% CI 4·85–13·95) compared to non-alcoholics. In addition, a clear dose–response relationship was shown with a monotonic increase of the risk of pneumonia with increasing alcohol consumption. Even though the number of studies included in the meta-analysis was relatively small, the total number of participants across studies was substantial. Most of the studies reported RR estimates adjusted for age, sex, smoking, and other confounding factors, and no evidence of publication bias was found.
In addition, the results of the excluded two studies on HAP are in line with findings for CAP. In particular, Gacouin and co-authors [Reference Gacouin13] reported increased hazard ratios (HRs) for HAP and ventilator-associated pneumonia (VAP) in at-risk drinkers (i.e. those who drank >14 drinks per week or >4 drinks per occasion) (HR 1·92, 95% CI 1·17–3·14 for HAP and HR 1·76, 95% CI 1·05–3·06 for VAP). Bard and co-authors [Reference Bard14] reported substantially higher incidence rates for pneumonia as a complication in trauma patients with alcohol withdrawal syndrome compared to those without withdrawal syndrome (18·2% vs. 1·1%).
This opens the question, whether alcohol consumption is only associated with pneumonia, or whether alcohol consumption is a causal factor for the incidence of this disease. A key requirement for this decision would be a plausible biological pathway [Reference Hill17, Reference Rothman, Greenland and Lash18].
Clinical and experimental evidence indicates several pathways showing how alcohol consumption may affect respiratory and immune systems, making especially heavy drinkers susceptible to pulmonary infections. Detrimental immunological effects of ethanol include:
• deterioration of innate immunity with decreased production of bactericidal substances such as lysozyme, complement, etc. [Reference Zhang19];
• decreased phagocytic and antigen-presenting activities of alveolar macrophages [Reference Szabo, Mandrekar and Catalano20];
• decreased recruitment of polymorphonuclear leukocytes (PMN) due to suppression of chemoattractants production and impaired response of PMN to chemotactic signals as well as impairment of functional activity of PMNs [Reference Zhang19, Reference Neuman21];
• inhibition of bone marrow granulopoietic function due to suppression of granulopoietic cytokine production by infected tissues and impairment of the granulopoietic progenitor cell response to the cytokine stimulation [Reference Heermans22];
• deterioration of acquired immunity including development of lymphopenia, suppression of lymphoblast transformation and blunted lymphocyte proliferative responses to specific antibodies [Reference Zhang19];
• diminished number of CD4+ T-lymphocytes and their capacity to produce IFN-γ and impaired ability to develop specific antibodies following new antigen challenges [Reference Gamble, Mason and Nelson23].
Moreover, impairment of mechanical defence mechanisms described in heavy drinkers involves diminished oropharyngeal tone resulting in increased risk of aspiration and decreased bronchoalveolar lavage due to suppression of coughing and decreased cilia motility [Reference Szabo and Mandrekar24]. In addition, heavy drinking often causes liver damage, nutritional deficiency, or results in poor personal hygiene, which also results in the impaired immunity associated with alcohol dependence [Reference Szabo and Mandrekar24].
In summary, multiple detrimental effects of drinking, in particular heavy drinking, have been shown to cause profound suppression of host defensive mechanisms and result in increased susceptibility to development of pneumonia. This conclusion is corroborated by a recent review of van der Poll & Opal in the Lancet which list alcoholism as a strong risk factor for pneumococcal pneumonia [Reference van der Poll and Opal25].
CONCLUSIONS
Alcohol consumption constitutes an independent risk factor for incidence of CAP. A monotonic dose–response relationship was found, and the RR for people with AUD was greater than eightfold. Data from HAP yielded similar risks. As a consequence, problem alcohol use should be screened in people presenting with pneumonia, and brief interventions or treatment should be offered for those screening positive, respectively showing manifest AUD [Reference Room, Babor and Rehm26]. This would prevent complications during therapy and risk of dropout or re-infection. Furthermore, proven effective public health interventions for alcohol may reduce the incidence of pneumonia especially in areas where there is high level of both alcohol use and infection risk [Reference Room, Babor and Rehm26, Reference Rehm and Greenfield27].
ACKNOWLEDGEMENTS
We thank Dr Paul Shuper for helpful comments on earlier versions of this text and the core group of the Comparative Risk Assessment for alcohol within the Global Burden of Disease and Injury 2005 Project for advising on the systematic reviews. NIAAA (contract no. HHSN267200700041C ‘Alcohol- and Drug-Attributable Burden of Disease and Injury in the US’ to J.R.), the Global Burden of Disease and Injury 2005 Project, and the Centre for Addiction and Mental Health in Toronto, Canada provided financial and/or technical support for this study. In addition, support to CAMH for salary of scientists and infrastructure was provided by the Ontario Ministry of Health and Long Term Care. The content of this paper is solely the responsibility of the authors and does not necessarily represent the official views of the NIAAA or NIH or those of the Ministry of Health and Long Term Care.
DECLARATION OF INTEREST
None.


