1 Introduction
Research in designing is based on the scientific paradigm that assumes that there are regularities that underlie phenomena. The role of research is to discover those regularities and represent them in a general way by abstracting from individual instances. The resulting models can be used to explain and predict similar instances, potentially becoming theories in the domain in which they occur (Popper Reference Popper1962; Kuhn Reference Kuhn1996).
The regularities studied in design research relate to either the products or the processes of designing. A number of models describing regularities in processes of designing have been proposed in the 1960s and 1970s, particularly in engineering design (Asimov Reference Asimov1962; Jones Reference Jones1970; Hubka Reference Hubka1974; VDI 1985; Ullman Reference Ullman1992; Dym Reference Dym1994; Hubka & Eder Reference Hubka and Eder1996; Roozenburg & Eekels Reference Roozenburg and Eekels1996; Cross Reference Cross2000; Ulrich & Eppinger Reference Ulrich and Eppinger2000; Pahl & Beitz Reference Pahl and Beitz2007). They have been used as frameworks for locating specific design techniques, delineating different types of designing (e.g., original versus adaptive design), and proposing guidelines for transforming a set of design goals into the structure of a design solution. While models may be seen as either descriptive or prescriptive (Finger & Dixon Reference Finger and Dixon1989), a clear distinction is often difficult to make (Wynn & Clarkson Reference Wynn, Clarkson, Clarkson and Eckert2005).
One of the most detailed and widely referenced prescriptive models of designing is the ‘Systematic Approach’ developed by Pahl & Beitz (Reference Pahl and Beitz2007), which was first published in German in 1977. The authors built this model based on their experience and observations of professional designers, and presented it as a stepwise procedure used as a prescriptive approach. The Systematic Approach has had a significant influence on the development of other models of designing, including the VDI-2221 (VDI 1985) guideline (according to Eder Reference Eder2012), and Ullman’s (Reference Ullman1992) ‘mechanical design process’ (according to Wallace & Blessing (Reference Wallace and Blessing2000)). It is viewed as one of the standard references for engineering design in general (Adams Reference Adams2015) and engineering design education in particular (Wallace & Blessing Reference Wallace and Blessing2000). In Pahl and Beitz’ home country Germany, in particular, it has been part of the engineering curricula of many technical universities (H. Binz, personal communication, 19 June 2016). Other countries in which universities teach or make reference to the Systematic Approach include the United StatesFootnote 1 , CanadaFootnote 2 , the United KingdomFootnote 3 , IndiaFootnote 4 , Hong KongFootnote 5 and AustraliaFootnote 6 .
1.1 The systematic approach
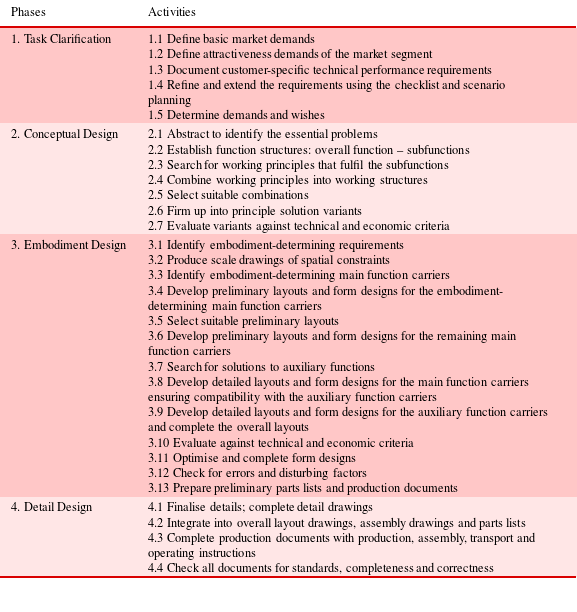
Pahl and Beitz’ Systematic Approach (in this paper referred to as PBSA) describes engineering design as a sequence of four phases: (1) Task Clarification, (2) Conceptual Design, (3) Embodiment Design, and (4) Detail Design. Task Clarification is concerned with collecting, formulating and documenting the requirements of the product to be designed. Conceptual Design aims to identify the basic principles and outline of a design solution (or concept). Embodiment Design then elaborates the design into a layout that satisfies various technical and economic criteria. Detail Design finalises the design and prepares production documents. Each of the four phases comprises a sequence of activities that may be executed iteratively. After every phase a ‘decision-making step’ is performed to assess the results of the phase and decide whether the subsequent phase can be started or whether the phase needs to iterate. Here, ‘[t]he smallest possible iteration loop is desirable’ (Pahl & Beitz Reference Pahl and Beitz2007, p. 129). Pahl and Beitz do not explicitly exclude iterations across different phases. On the other hand, the ‘phase-based’ character of PBSA clearly favours a ‘waterfall’ view where iterations are to occur only within a phase (Tate & Nordlund Reference Tate and Nordlund1996; Unger & Eppinger Reference Unger and Eppinger2011). Table 1 shows the phases of PBSA, and the activities associated with each phase. Iterations within and across different phases are not shown in the Table.
Table 1. Pahl & Beitz’ (Reference Pahl and Beitz2007) Systematic Approach
1.2 Aim of this study
The aim of research reported in this paper is to examine whether PBSA is able to predict the design behaviour of mechanical engineering students. For this purpose, experiments are set up to provide measurements for the observations of students’ behaviour. Possible outcomes may be a complete or partial match between model and observations, or a mismatch (Popper Reference Popper1962). For PBSA, specifically, we focus on testing the process model: Can this model predict the behaviour of students designing, and if not where are the differences? Other possible claims attributed to PBSA, such as whether following the proposed process model leads to better designs, are not tested in this study.
The empirical observations in this study are provided by protocols of 15 design sessions involving mechanical engineering students after their first year of design education and 31 design sessions of students from the same institution taught three different concept generation methods within a course on design education. All 46 design sessions covered an entire design process from requirements specification to solution description. The design protocols and PBSA are coded uniformly using the Function–Behaviour–Structure (FBS) ontology (Gero Reference Gero1990; Gero & Kannengiesser Reference Gero, Kannengiesser, Chakrabarti and Blessing2014), to allow their comparison. We use qualitative and quantitative measures for this comparison, derived from cumulative occurrence analysis of FBS design issues.
1.3 Significance of this study
If this study succeeds in showing that Pahl and Beitz’ model is predictive of students’ design behaviour, it can be treated as a predictive model of students designing. If in future studies similar results are found for practitioners designing more complex systems, then PBSA could become a general predictive model of designing. This would increase confidence in the applicability of PBSA, thus supporting its use as a design theory (Pedersen et al. Reference Pedersen, Emblemsvåg, Bailey, Allen and Mistree2000; Vermaas Reference Vermaas, Chakrabarti and Blessing2014). The ontologically based method used in this paper also allows testing other design approaches in a similar way, independently of the specific design discipline of the approach. Different approaches can thus be compared and evaluated.
2 Method
2.1 FBS coding
Comparing PBSA and the empirical data requires that they both be expressed in a uniform representation. In our previous work on analysing models of designing (Kannengiesser & Gero Reference Kannengiesser and Gero2015) we used the FBS schema (Gero Reference Gero1990). It consists of six design issues: requirements, function, expected behaviour, behaviour derived from structure (or, shorthand, structure behaviour), structure, and description.
Requirements (R): includes all expressions of (existing or fictitious) customer or market needs, demands, wishes and constraints that are explicitly provided to the designer.
Function (F): includes teleological representations that can cover any expression related to potential purposes of the artefact. Unlike requirement issues, function issues are not directly provided to the designer; they are generated by the designer based on interpretations of the design task.
Expected Behaviour (Be): includes attributes that describe the artefact’s expected interaction with the environment. They can be used as guidance and measurable assessment criteria for potential design solutions.
Structure Behaviour (or ‘Behaviour derived from Structure’; Bs): includes those attributes of the artefact that are measured, calculated or derived from observation of a specific design solution and its interaction with the environment.
Structure (S): includes the components of an artefact and their relationships.
Description (D): includes any form of design-related representations produced by a designer, at any stage of the design process.
Using the FBS schema every design process can be described as a sequence of activities, each of which is concerned with generating an FBS design issue. For empirical data these activities correspond directly to the segments in design protocols. For PBSA, we can derive the sequence of design activities (or their resulting design issues) using the 20 processes defined in the situated FBS framework (sFBS) (Gero & Kannengiesser Reference Gero and Kannengiesser2004), shown in Figure 1. The sFBS framework can be seen as a design simulation model as it captures the physical and cognitive activities involved in the interactions of designers with their environment. It includes three worlds:
The external world contains objects and representations in the environment of the designer. It includes external function (F
![]() $^{\text{e}}$
), external behaviour (B
$^{\text{e}}$
), external behaviour (B
![]() $^{\text{e}}$
), external structure (S
$^{\text{e}}$
), external structure (S
![]() $^{\text{e}}$
), and requirements on function (FR
$^{\text{e}}$
), and requirements on function (FR
![]() $^{\text{e}}$
), on behaviour (BR
$^{\text{e}}$
), on behaviour (BR
![]() $^{\text{e}}$
) and on structure (SR
$^{\text{e}}$
) and on structure (SR
![]() $^{\text{e}}$
).
$^{\text{e}}$
).
The interpreted world contains experiences, percepts and concepts produced by the designer’s interactions with the external world. It includes interpreted function (F
![]() $^{\text{i}}$
), interpreted behaviour (B
$^{\text{i}}$
), interpreted behaviour (B
![]() $^{\text{i}}$
) and interpreted structure (S
$^{\text{i}}$
) and interpreted structure (S
![]() $^{\text{i}}$
).
$^{\text{i}}$
).
The expected world contains the designer’s hypotheses, goals and expected results of actions. It includes expected function (Fe
![]() $^{\text{i}}$
), expected behaviour (Be
$^{\text{i}}$
), expected behaviour (Be
![]() $^{\text{i}}$
) and expected structure (Se
$^{\text{i}}$
) and expected structure (Se
![]() $^{\text{i}}$
).
$^{\text{i}}$
).
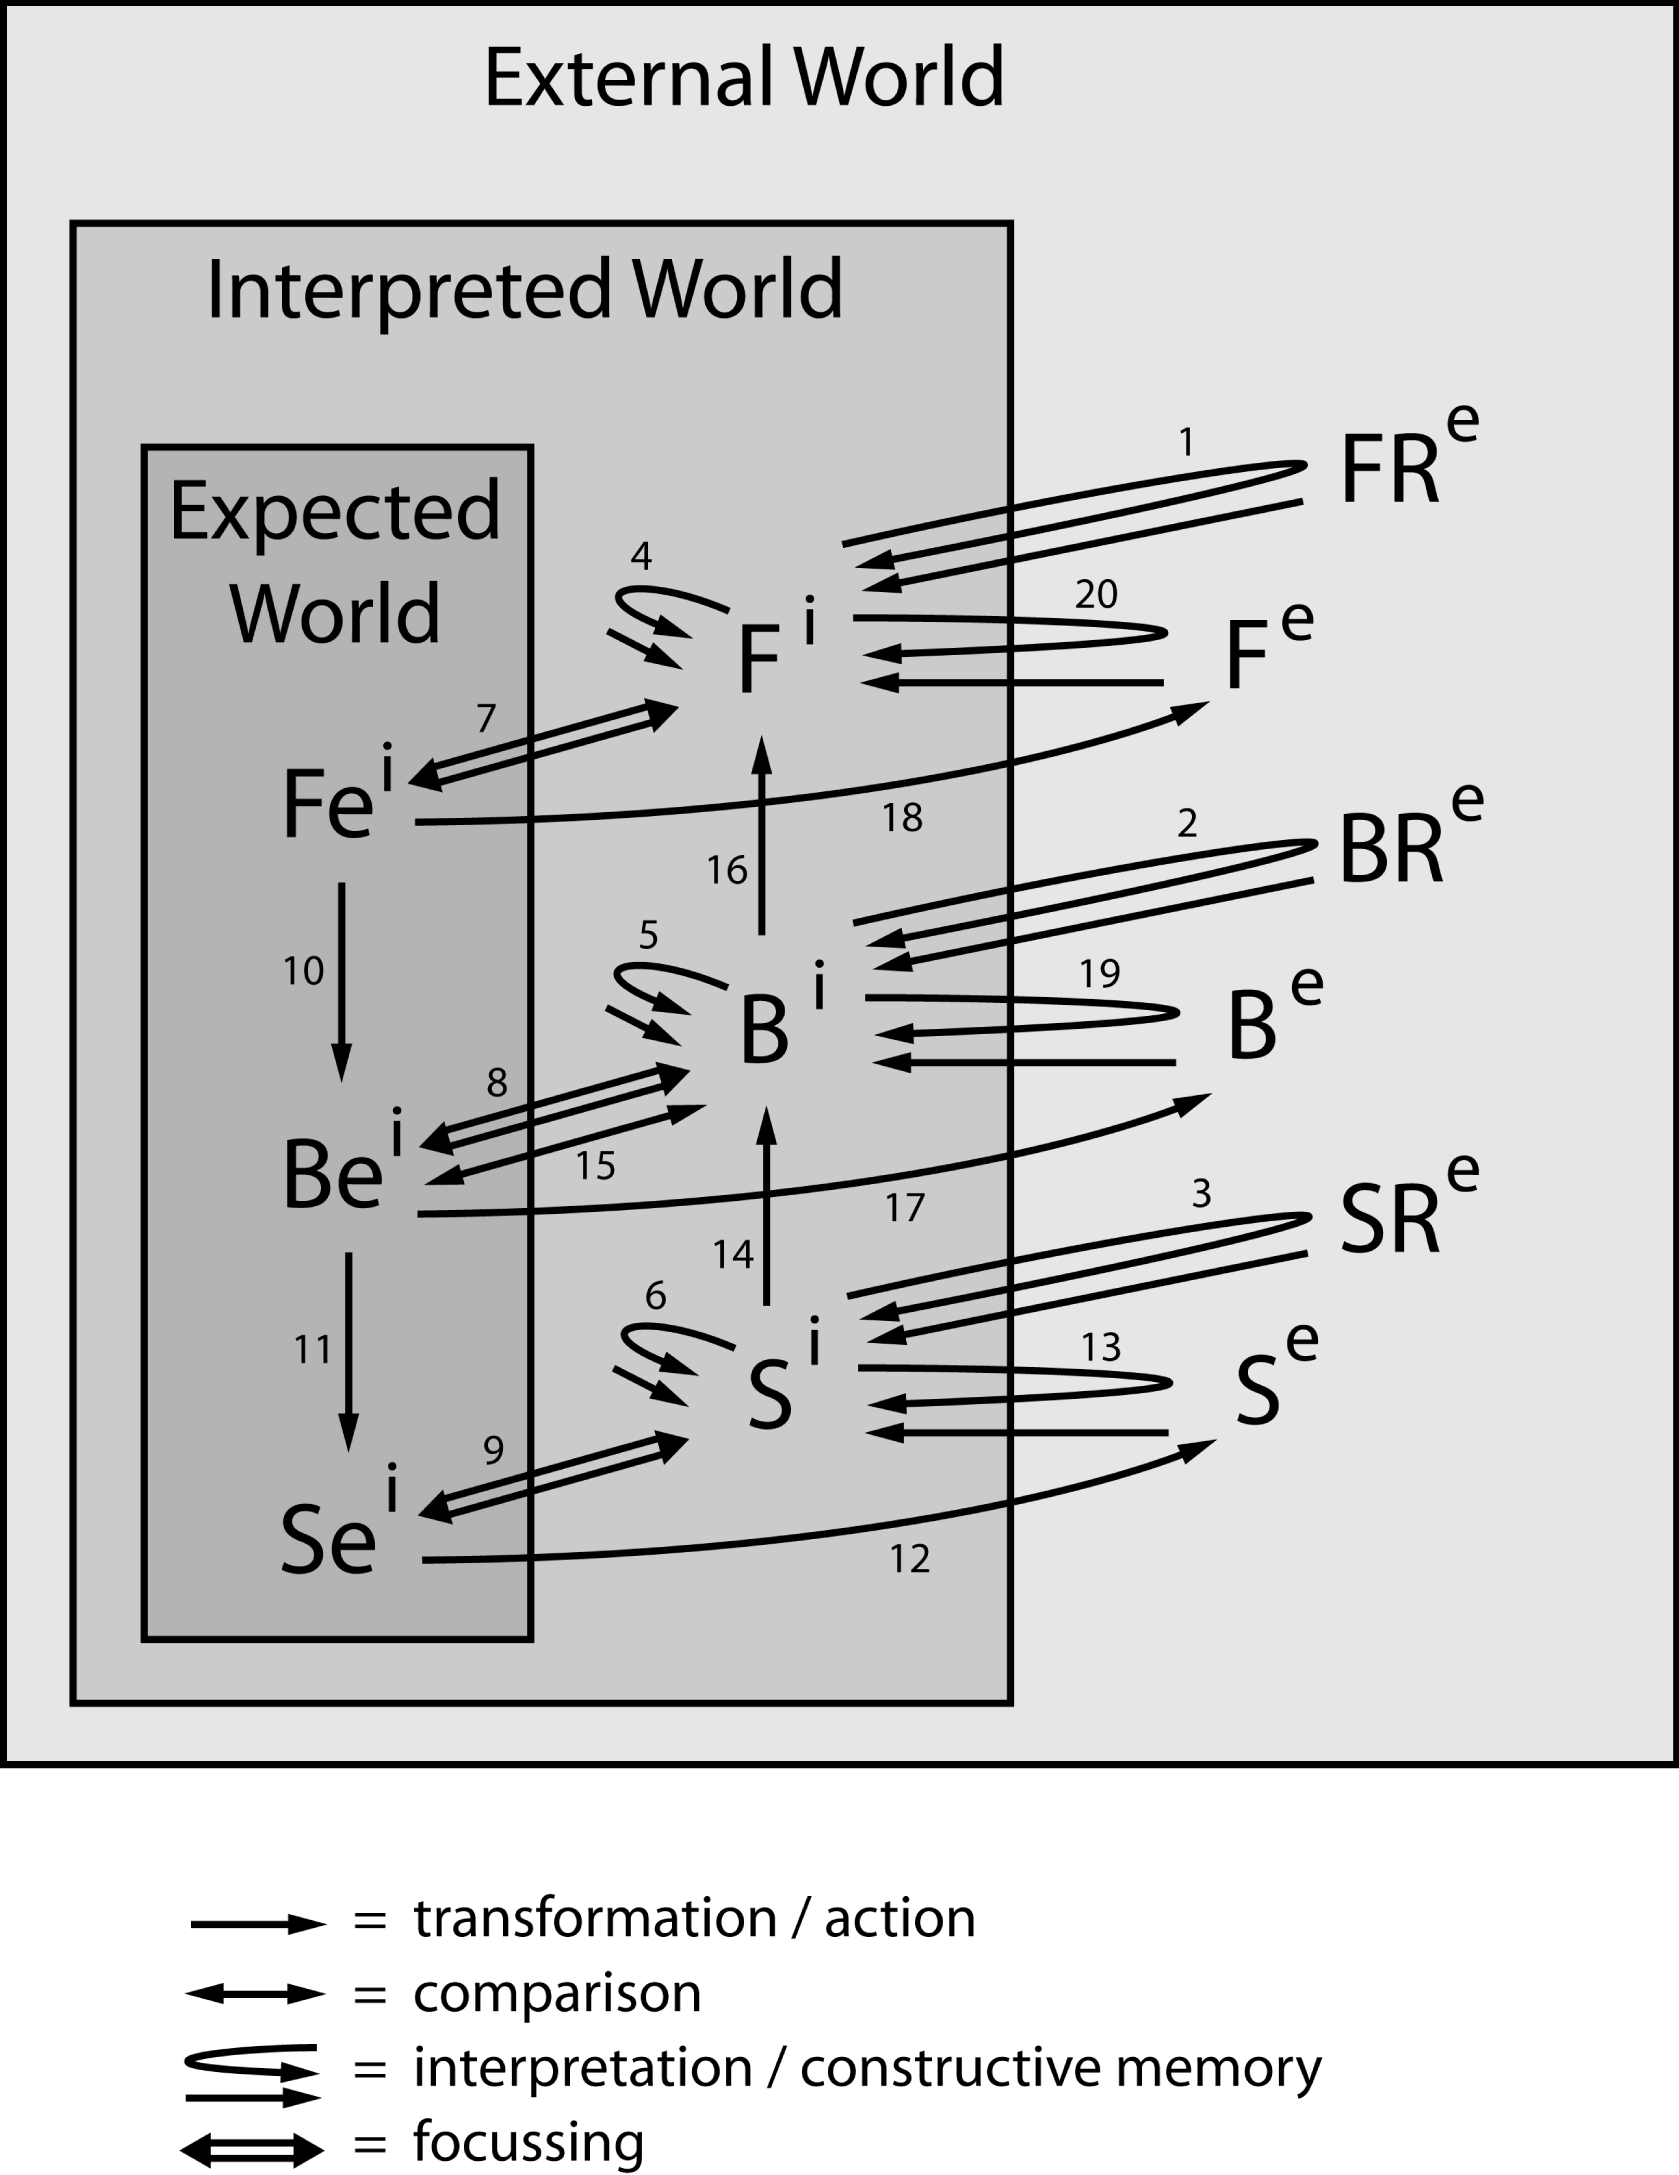
Figure 1. The situated FBS framework.
Mapping the activities described in PBSA onto the sFBS framework allows considering the designer’s situated interactions in the simulation model. At the same time, the basic representation of designing in terms of the six design issues is maintained. This is because the results of executing the 20 processes are specialised classes of design issues that can be aggregated back to the original six categories. The aggregation of the 20 sFBS processes to the six FBS design issues is shown in Table 2.
Table 2. The results of each of the 20 sFBS processes (labelled in the sFBS framework shown in Figure 1) are aggregated, via sFBS design issues, to the six FBS design issues
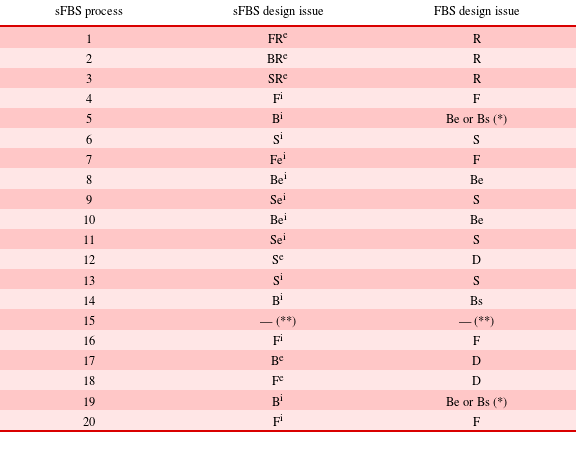
*Depending on whether the behaviour produced in these processes is interpreted as expected/desired or ‘actual’/emerging.**This process produces no design issue.
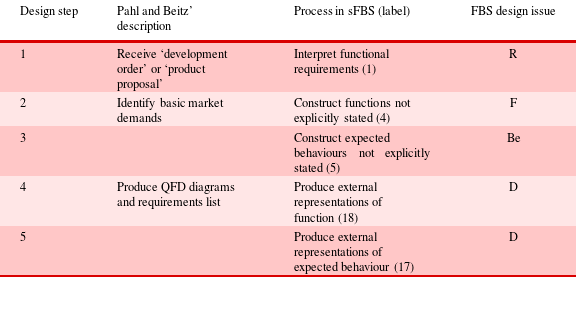
Mapping the activities of PBSA onto the sFBS framework requires some interpretation of it in terms of more elementary steps and the logical sequences of these steps. In their book, Pahl and Beitz provide sufficient elaboration and illustration to support this interpretation for most of their defined activities. Take the first activity, ‘Define basic market demands’, described within the design phase of Task Clarification. This activity requires as input the interpretation of a ‘development order’ or ‘product proposal’ that contains the product’s desired ‘functionality and performance’, which in the FBS design issue system is a requirement issue (interpreted by process 1 in the sFBS framework). Next, ‘basic market demands’, such as ‘suitable for tropical conditions’ and ‘
![]() $\text{P}>20\;\text{kW}$
’ (Pahl & Beitz Reference Pahl and Beitz2007, p. 147), are constructed by the designer as ‘implicit requirements, i.e., they are not articulated by the customer’ (ibid, p. 150). We map these market demands onto function and expected behaviour issues (constructed by processes 4 and 5). They are compiled in a ‘requirements list’ and ‘Quality Function Deployment (QFD)’ diagrams (ibid, p. 145) that represent description issues (produced by processes 18 and 17). As shown in Table 3, these mappings result in five elementary design steps, each of which produces one design issue, and their logical sequence. More detailed commentaries for each of the mappings and a complete elaboration can be found in Kannengiesser & Gero (Reference Kannengiesser and Gero2015) and will not be repeated here.
$\text{P}>20\;\text{kW}$
’ (Pahl & Beitz Reference Pahl and Beitz2007, p. 147), are constructed by the designer as ‘implicit requirements, i.e., they are not articulated by the customer’ (ibid, p. 150). We map these market demands onto function and expected behaviour issues (constructed by processes 4 and 5). They are compiled in a ‘requirements list’ and ‘Quality Function Deployment (QFD)’ diagrams (ibid, p. 145) that represent description issues (produced by processes 18 and 17). As shown in Table 3, these mappings result in five elementary design steps, each of which produces one design issue, and their logical sequence. More detailed commentaries for each of the mappings and a complete elaboration can be found in Kannengiesser & Gero (Reference Kannengiesser and Gero2015) and will not be repeated here.
Table 3. The steps involved in Pahl and Beitz’ activity of ‘Define basic market demands’ and their mappings onto the FBS design issue system and the sFBS framework
Mapping all activities defined in PBSA onto the sFBS framework results in 87 elementary steps coded in terms of FBS design issues (Kannengiesser & Gero Reference Kannengiesser and Gero2015).
The three sets of mappings of elementary steps can be viewed as a basis for simulation models that need to be complemented with assumptions regarding:
-
(1) the number of occurrences of every elementary step; and
-
(2) the number of iterations within a design phase.
The first of these assumptions cannot be made without knowledge of specific instances of designing including knowledge about the novelty and complexity of the design task. Staying on the model level rather than the instance level, our working assumption is that every elementary step occurs only once within the same iteration.
The second assumption is similarly based on task- and designer-specific knowledge that is not available at this general level. We assume a ‘typical’ scenario where the phases of task clarification and detail design are iterated once, and the phases of conceptual design and embodiment design are iterated twice (see Kannengiesser & Gero (Reference Kannengiesser and Gero2015) for the detailed elaboration). This results in a total of 235 steps, as some of the 87 elementary steps are repeated (once or twice, depending on the phase they belong to).
Iterations across different phases are not taken into account for the simulation model. This is due, on the one hand, to the lack of a detailed description of these iterations in Pahl and Beitz’ book and, on the other hand, to the ‘linear’ character of PBSA and other phase-based models of designing (Tate & Nordlund Reference Tate and Nordlund1996; Unger & Eppinger Reference Unger and Eppinger2011). The impact of this assumption on the results of the study will be discussed later in the paper.
2.2 Cumulative occurrence analysis
A number of analyses can be applied to the resulting sequences of FBS issues, irrespective of whether they represent design protocols or PBSA. In related studies (Gero, Kannengiesser & Pourmohamadi Reference Gero, Kannengiesser, Pourmohamadi and Gero2014; Kannengiesser & Gero Reference Kannengiesser and Gero2015) cumulative occurrence analysis was found useful for characterising and comparing different design issue sequences qualitatively and quantitatively. The cumulative occurrence
![]() $c$
of design issue
$c$
of design issue
![]() $x$
at design step
$x$
at design step
![]() $n$
is defined as
$n$
is defined as
![]() $c=\sum _{i=1}^{n}x_{i}$
, where
$c=\sum _{i=1}^{n}x_{i}$
, where
![]() $x_{i}$
equals 1 if design step
$x_{i}$
equals 1 if design step
![]() $i$
is coded as
$i$
is coded as
![]() $x$
and 0 if design step
$x$
and 0 if design step
![]() $i$
is not coded as
$i$
is not coded as
![]() $x$
. Plotting the results of this equation on a graph with the design steps
$x$
. Plotting the results of this equation on a graph with the design steps
![]() $n$
on the horizontal axis and the cumulative occurrence
$n$
on the horizontal axis and the cumulative occurrence
![]() $c$
on the vertical axis will visualise the occurrence of the design issues. Figure 2 shows a general representation of such a graph. The corresponding plot showing the cumulative occurrence of the six design issues in PBSA is shown in Figure 3.
$c$
on the vertical axis will visualise the occurrence of the design issues. Figure 2 shows a general representation of such a graph. The corresponding plot showing the cumulative occurrence of the six design issues in PBSA is shown in Figure 3.

Figure 2. Graphical representation of the cumulative occurrence of design issues across design steps.

Figure 3. Cumulative occurrence of the six design issues in the Systematic Approach.
Four measures are used for analysing the cumulative occurrence graphs:
-
(i) First occurrence at start: This measure indicates whether a design issue first occurs near the start of designing or at a later stage. Specifically, the measure has the value:
-
(a) ‘Yes’ if the first occurrence of the design issue is within the first 25 design steps, and
-
(b) ‘No’ if the first occurrence of the design issue is not within the first 25 design steps.
-
-
(ii) Continuity: This measure indicates whether a design issue occurs throughout designing or only up to a certain point. Specifically, the measure has the value:
-
(a) ‘Yes’ if the slope of the asymptote of the accumulation curve towards the end of designing is positive, and
-
(b) ‘No’ if the slope of the asymptote of the accumulation curve towards the end of designing is zero (it cannot negative).
-
-
(iii) Linearity: This measure indicates whether the speed at which design issues are generated (equivalent to the cognitive effort expended on these design issues) is constant. It is measured using the coefficient of determination (R
 $^{\text{2}}$
) that indicates linear fit and ranges from 0 to 1. As a threshold for linear fit we set the commonly used value of 0.95; i.e., the graph is considered:
$^{\text{2}}$
) that indicates linear fit and ranges from 0 to 1. As a threshold for linear fit we set the commonly used value of 0.95; i.e., the graph is considered:-
(a) ‘linear’ if R
 $^{\text{2}}$
is at least 0.95, and
 -
(b) ‘nonlinear’ if R
 $^{\text{2}}$
is less than 0.95.
-
-
(iv) Slope: The measure represents the rate at which design issues are generated. It is calculated only for graphs that are found to be linear.
The two measures of continuity and first occurrence at start are direct characterisations of cumulative occurrence, both available from a qualitative assessment of the graph. They tell us whether a design issue is focused on from the very start of the design process and whether it is continuously focused on throughout the design activity, respectively. The measures of slope and linearity have been derived using a grounded theory approach, through a process of discovery by looking at the results of previous analyses (e.g., Gero et al. (Reference Gero, Kannengiesser, Pourmohamadi and Gero2014)) where some design issue graphs appeared to be linear.
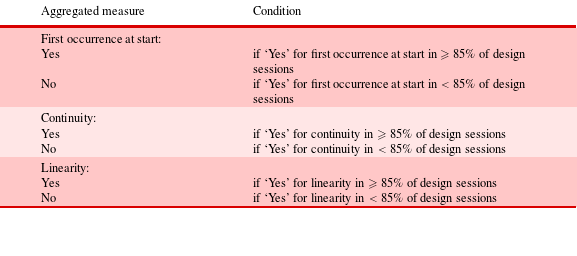
The measures for the empirical data are aggregated across individual graphs according to the conditions shown in Table 4. The threshold value of 85% for each aggregated measure is slightly lower than in similar studies in the authors’ previous work; this is due to the relatively small number of protocols in the present datasets. The aggregated measures can then be compared against the corresponding measures for PBSA.
Table 4. Aggregating measures for the empirical datasets
2.2.1 Design sessions with mechanical engineering students
Datasets from a number of previous sessions of mechanical engineering undergraduates designing are utilised. Specifically, data from two prior studies related to understanding (i) designing at different stages in design education and (ii) designing using different concept generation techniques (Gero, Jiang & Williams Reference Gero, Jiang and Williams2013). These studies use the design protocol technique, where designers are asked to think aloud to capture their cognitive activities during a design session (Ericsson & Simon Reference Ericsson and Simon1993; Van-Someren, Barnard & Sandberg Reference Van-Someren, Barnard and Sandberg1994; Gero & McNeill Reference Gero and McNeill1998). Design protocols are records of the designers’ utterances and their physical design activities such as drawings.
Although the studies were conducted separately, both draw from the same general student population: years 2–4 of a single mechanical engineering (ME) department within a large mid-Atlantic, land-grant university. The ME department uses design as a context for its four-year curriculum. A first-year general engineering course, ‘Introduction to Engineering Design,’ provides students three 5-week modules covering Computer-Aided Design, programming, and an introduction to systematic design processes. While PBSA is part of the background reading material, along with multiple other engineering design texts, it is not taught explicitly in the classroom. The second-year mechanical engineering course, ‘Engineering Design and Economics,’ focuses on exposing students to mechanical engineering design and design methodologies at an early stage in their professional development. Classroom meetings are typically devoted to hands-on, team-based activities, which range from product dissections (IC engines, air compressors, electric drills, disposable cameras, etc.) to various speculative design scenarios. These activities provide an opportunity for the instructor to perform individual mentoring and instruction. In addition to these in-class activities, student design teams work together out of class on a semester project wherein they design a novel consumer product. Finally, the fourth-year (senior) mechanical engineering course provides a two-semester capstone design experience. In the first semester, students attend a seminar series related to all aspects of the product realisation process; the second semester is devoted to product embodiment and detailed design.
In addition to being enrolled in the same educational program, participants in both studies were assessed using the same speculative design scenarios during the experimental sessions. In total four different scenarios, all pertaining to assistive-technology design, were used:
-
(i) Window opener: Students were asked to design a device that could aid disabled users with opening a stuck double-hung window without relying on electric power.
-
(ii) Door opener: Students were asked to design a portable device to help stroke patients, who are unable to perform bilateral tasks, with opening doors.
-
(iii) Wheelchair kerb-assist: Students were asked to design a device to add to an existing hand/arm-powered wheelchair that will allow paraplegic wheelchair users to traverse a standard roadside kerb unassisted.
-
(iv) Bath helper: Students were asked to design a system that to help nurses in assisting their patients in and out of bath tubs.
Additional details of the two studies are provided below.
2.2.2 Students after one year of formal education in design
The overall purpose of this study was to research the potential effects of design education on students’ design behaviour. Specifically, protocol analysis was used to analyse and compare the experiment design sessions of two student groups: a control group enrolled in a curriculum with a theoretical engineering science focus, and an experiment group enrolled in a curriculum with a design focus (mechanical engineering). To explore the effects of the two curricula on design cognition, the team conducted a longitudinal study that followed students from their sophomore to senior years. Participants were solicited during their sophomore year and agreed to participate in the three-year study (Lee, Gero & Williams Reference Lee, Gero and Williams2012).
Our focus in this paper is on the beginning of the participants’ second year, after they have been taught multiple design methodologies. A dataset of 15 design sessions was available that is relevant for this study. This dataset was the result of 15 teams of two self-selected volunteer students who had not worked together previously. Each team was given the same design task and instructed to design a product to meet the requirements in the design task. Teaming produces natural verbalisation so no training in ‘think aloud’ was needed. Each team used the same room and were given the same instructions that included a specified available time of 45 minutes. The protocol was collected using two fixed-position cameras and two Lavalier wireless microphones. The utterances and gestures in the protocol videos were transcribed, segmented and coded using the FBS design issue coding scheme using two independent coders. This resulted in a sequence of design issues represented by their FBS codes for each design session. This sequence formed the basis for all further analysis presented in this paper.
2.3 Students using different concept generation methods
The overall aim of this second study was to investigate the effects on design cognition of teaching different concept generation methods. The research investigated three methods used in designing: brainstorming, morphological analysis, and TRIZ. Participants were solicited from the ME senior capstone design sequence in the same institution as the student cohort described in Section 3.1. Each concept generation method was introduced in class and was used in at least one design task within a project setting. Following the week when the concept generation methods were learnt, student pairs attended a design session and solved a speculative design brief using the ideation technique covered in the week’s class. The conditions were the same as for the earlier cohort with one difference, participants were asked to make use of the ideation technique covered in the previous week. Three experiment sessions were conducted two weeks apart resulting in three primary datasets: Brainstorming (10 design sessions), morphological analysis (11 design sessions), and TRIZ (10 design sessions) (Gero et al. Reference Gero, Jiang and Williams2013).
3 Results
In this section, we present the aggregated results of the cumulative occurrence analysis for the empirical data, compared with PBSA.
3.1 Students after one year of formal training in design methodology
Comparisons between the design behaviour of students after one year of education in design methodology and PBSA are shown in Table 5, where the results of measuring first occurrence at start, continuity and linearity for the two datasets are displayed. To allow readers to carry out their own qualitative assessments using the cumulative occurrence graph in Figure 3, we also include a corresponding graph for one of the design sessions in Figure 4.
Table 5. First occurrence at start, continuity, and linearity for the six design issues (Stud-2nd
![]() $=$
students after one year of design education)
$=$
students after one year of design education)
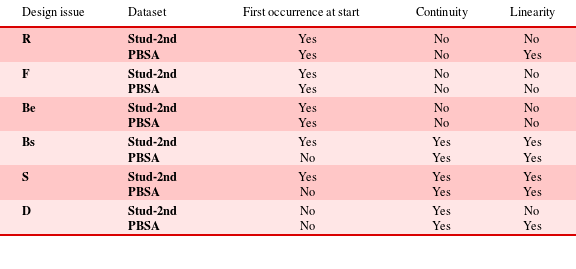

Figure 4. Cumulative occurrence of the six design issues in one of the students’ design sessions.
In both the design sessions and PBSA, requirement issues, function issues and expected behaviour issues occur at start, and description issues do not occur at start. A difference between the two datasets can be seen for structure behaviour issues and structure issues, where there is occurrence at start in the design sessions but not in PBSA.
For the measure of continuity, there is no difference between the design sessions and PBSA: structure behaviour issues, structure issues and description issues occur continuously, while requirement issues, function issues and expected behaviour issues do not occur continuously.
With respect to the measure of linearity, there is some consistency between the empirical data and PBSA in that in both datasets the graphs for structure behaviour issues and structure issues are linear, while for function issues and expected behaviour issues they are not. The datasets differ for requirement issues and description issues, each of which has a linear graph based on PBSA and nonlinear graphs based on the empirical data.
Comparisons of the slopes for structure behaviour issues and structure issues (based on their linearity in both the design sessions and PBSA) are shown in Tables 6 and 7. The slope of structure issues is very similar across PBSA and the second-year students, but quite different for structure behaviour issues.
Table 6. Structure behaviour issues: Slope

Table 7. Structure issues: Slope

3.2 Students applying specific concept generation methods
Comparisons between the design behaviour of students using specific concept generation techniques and PBSA are shown in Tables 8–13, using the results of measuring first occurrence at start, continuity and linearity (Stud-Brain
![]() $=$
students using brainstorming; Stud-Morph
$=$
students using brainstorming; Stud-Morph
![]() $=$
students using morphological analysis; Stud-TRIZ
$=$
students using morphological analysis; Stud-TRIZ
![]() $=$
students using TRIZ).
$=$
students using TRIZ).
Table 8. Requirement issues: first occurrence at start, continuity, and linearity

*The number of occurrences of requirement issues was too low (
![]() ${<}10$
) to produce statistically meaningful results.
${<}10$
) to produce statistically meaningful results.
Table 9. Function issues: first occurrence at start, continuity, and linearity

Table 10. Expected behaviour issues: first occurrence at start, continuity, and linearity

Table 11. Structure behaviour issues: first occurrence at start, continuity, and linearity

Table 12. Structure issues: first occurrence at start, continuity, and linearity

Table 13. Description issues: first occurrence at start, continuity, and linearity

With respect to first occurrence at start, there is no uniform behaviour across the empirical datasets and PBSA. However, for most design issues there is commonality between PBSA and two of the three empirical datasets.
In terms of continuity, the empirical datasets are largely consistent with PBSA: Structure behaviour issues and structure issues occur continuously, while requirement issues, function issues and expected behaviour issues do not occur continuously. It is only for description issues where one of the empirical datasets (namely, brainstorming) differs from the others in that it is not continuous.
Regarding linearity, the results are largely consistent across all datasets. The graphs for structure behaviour issues and structure issues are linear in all three empirical datasets and PBSA. The graphs for function issues and expected behaviour issues are all nonlinear. The graphs for description issues are linear for all but one dataset (TRIZ) that exhibits nonlinearity. For requirement issues, the empirical data was insufficient to produce any results.
Comparisons of the slopes for structure behaviour issues and structure issues (based on their linearity in both the three empirical datasets and PBSA) are shown in Tables 14 and 15. In addition, the slopes for description issues (except for the TRIZ dataset where there is nonlinearity) are shown in Table 16. It can be seen that the slope for structure behaviour issues is much lower in PBSA than in the empirical datasets. For structure issues, the slope in PBSA is similar to the ones in brainstorming and morphological analysis. For description issues, the slopes in all the linear datasets are also very similar.
Table 14. Structure behaviour issues: Slope

Table 15. Structure issues: Slope

Table 16. Description issues: Slope

4 Discussion
The results of this study show that PBSA can be seen as a model that is suitable for predicting most of the design behaviour of mechanical engineering students studied. This statement is based on the similarity of the graphs representing PBSA and those representing the students’ design behaviour and the quantitative similarities of the data represented by those graphs. In particular, the second-year students who do not apply any specific concept generation method seem to follow very closely the overall sequence of (FBS-ontological) design steps mapped out in PBSA. In many aspects the same can be stated for the students applying specific concept generation methods, although a few more qualitative differences were identified in this comparison.
Some specific differences exist between PBSA and the empirical data that we believe are worth noting. One of them concerns the first occurrence of structure issues and structure behaviour issues. While PBSA predicts that these design issues will not occur until later during designing, for the second-year students the opposite was the case: They produced structure issues and structure behaviour issues very early on in their design sessions. It is only the datasets representing students that apply morphological analysis (for Bs and S issues) and TRIZ (for S issues) where first occurrence at start was observed in less than 85% of the design sessions. Even if iterations in PBSA (which Pahl and Beitz do not exclude) were to be taken into account (including intra- and inter-stage iterations), there would still be no early occurrence of structure issues and structure behaviour issues in their model.
What do these differences mean? One possible interpretation is that the ability of the students to carry out a design task after one year of study is not developed sufficiently to be completely covered by PBSA. For example, it may be assumed that the students tend to neglect task clarification by prematurely focussing on specific design solutions. On the other hand, such behaviour has also been observed for instances of designing involving professional designers (Ullman, Dietterich & Stauffer Reference Ullman, Dietterich and Stauffer1988; Lawson Reference Lawson1994; Cross Reference Cross, Eastman, Newstetter and McCracken2001). Therefore, it can be concluded that the differences between the model and the empirical data rather indicate that PBSA seems to be incomplete as a predictive model of designing since it does not predict designers’ early focus on generating solutions. Such incompleteness may consist of only a few missing elaborations of the model. For example, it may be that the four phases in PBSA do not occur in a waterfall fashion but should be regarded as overlapping. If the conceptual design phase (where structure issues are first mentioned by Pahl and Beitz) is understood as running in parallel with (and not subsequent to) the task clarification phase, PBSA may be able to predict the early focus on design solutions. Further possible extensions of this approach may be based on other models of designing, such as design thinking and experiences from their application in engineering design courses (Dym et al. Reference Dym, Agogino, Eris, Frey and Leifer2005).
5 Conclusion
Any scientific study of design (which does not necessarily imply that design, as the object of study, or designing is itself a science) involves the development of models and their testing (Popper Reference Popper1962). Models can be generated in many ways: scientifically or by abstracting observations of practitioners (Vermaas Reference Vermaas, Chakrabarti and Blessing2014). The Systematic Approach by Pahl and Beitz is a result of their observations of design professionals. It is presented and used as a prescriptive approach to designing, and was not necessarily intended to be a descriptive or predictive model. This paper has examined if the Systematic Approach can be used as a predictive model by testing its predictive capability against empirical data from mechanical engineering students. The results of this testing indicate that the Systematic Approach can be treated as such a model for most of the design issue behaviours observed empirically.
The Systematic Approach was not explicitly taught to the students, and was provided only as part of the reading material. Based on the results of our study, it may be useful to consider a more explicit role of Pahl and Beitz’ model in the design curriculum. Additional support for these considerations may be provided if similar results can be found for professional designers, which will be part of future studies. If this is the case, it may also counter some of the commonly stated perceptions that systematic design approaches in the literature are not adopted in practice (Eder Reference Eder1998; Frost Reference Frost1999; Birkhofer et al. Reference Birkhofer, Kloberdanz, Sauer and Berger2002; Jensen & Andreasen Reference Jensen and Andreasen2010).
The basis for this study is a translation of both the model and the empirical data into a common representation. This is the condition for comparing them and identifying commonalities. We previously applied this method to comparisons between models of designing in different disciplines (Kannengiesser & Gero Reference Kannengiesser and Gero2015). Other models of designing can be analysed and compared with empirical data, on the condition that they are described in sufficient detail to derive statistically meaningful measures from their corresponding design issue graphs. This work thus contributes to the scientific study of design.
Acknowledgments
This research has been supported in part by the National Science Foundation grant numbers CMMI-1161715, CMMI-1400466 and EEC-1463873. Any opinions, findings, and conclusions or recommendations expressed in this material are those of the authors and do not necessarily reflect the views of National Science Foundation.


