INTRODUCTION
With rising global population, pressure on the resource base and climate change, even marginal lands, which currently support 50% of world population and are at risk of degradation under annual cropping, must be farmed sustainably in future to ensure increasing demands for food and livelihood are met (Tilman et al., Reference Tilman, Balzer, Hill and Befort2011). Perennial grains hold promise of meeting these convergent needs for protection of fragile lands, while simultaneously allowing farmers to support themselves and their families (Glover et al., Reference Glover, Reganold, Bell, Borevitz, Brummer, Buckler, Cox, Cox, Crews, Culman, Dehaan, Eriksson, Gill, Holland, Hu, Hulke, Ibrahim, Jackson, Jones, Murray, Paterson, Ploschuk, Sacks, Snapp, Tao, Van Tassel, Wade, Wyse and Xu2010). To do so, perennial grains must stabilize land and soil resources, whilst contributing grain and/or forage in mixed crop-livestock farming systems.
Research has commenced to develop perennial grains from a number of annual crops (Batello et al., Reference Batello, Wade, Cox, Pogna, Bozzini and Chopianty2014). In rice, following successful hybridization between Oryza sativa L. and Oryza longistaminata using embryo rescue, (first reported by Tau and Sripichitt, Reference Tau and Sripichitt2000), efforts to develop perennial rice have continued (Hu et al., Reference Hu, Tau, Sacks, Fu, Xu, Li, Yang, McNally, Khush, Paterson and Li2003; Sacks et al., Reference Sacks, Dhanapala, Sta. Cruz and Sullan2006; Schmit Reference Schmit, Piggin, Courtois and Schmit1996; Zhang et al., Reference Zhang, Batello, Wade, Cox, Pogna, Bozzini and Chopianty2014), with the long-term goal of ultimately breeding perennial rice to stabilize the fragile soils of rainfed lowland and rainfed upland rice-based farming systems.
Lao PDR has significant reliance on rainfed lowland rice for food security (McLean et al., Reference McLean, Dawe, Hardy and Hettel2002), with upland areas important for local needs but under environmental pressure. Perennial rice could assist in stabilizing fragile soil environments in Lao PDR, while being compatible with current farming systems. Consequently, in this study, derivatives of perennial rice were evaluated in Lao PDR under rainfed conditions, with access to supplementary irrigation as needed to assist survival through the dry season, which is normally from December to April. Soils in Lao PDR are sandy in texture, low in pH and available nutrients, and low in water-holding capacity (Linquist and Sengxua, Reference Linquist and Sengxua2001). Thus, cultivars are normally required with an ability to handle some rainfall deficit (Wade et al., Reference Wade, Fukai, Samson, Ali and Mazid1999a).
This paper reports the field evaluation of perennial rice derivatives derived from the cross between Oryza sativa and Oryza longistaminata, under rainfed lowland conditions in Lao PDR. Field experiments were conducted at Na Pok, Xepon and Pakse in 2011 and 2012. The objectives were (1) to assess survival, regrowth and field performance of perennial rice derivatives over 2 successive years at three locations in Lao PDR, (2) to assess suitability of perennial rice for rainfed environments and (3) to identify what further research is needed.
MATERIALS AND METHODS
The experiments were conducted in 6 site-year (Environment E) combinations in Lao PDR. Three sites were chosen: Na Pok (17o 57’ N, 102o 34’ E, 171 m) in Vientiane Province, Xepon (16o 41’ N, 106o 15’ E, 186 m) in Savannakhet Province, and Pakse (15o 9’ N, 105o 47’ E, 148 m) in Champassak Province, with each site continued for 2 years, 2011 and 2012. Environments are referred to by their environment code, e.g., Xepon 2011 is X1 (Table 1). A randomized complete blocks design was used, with 13 genotypes and 3 replicates. Plot size was 1.5 x 2.0 m, with 0.25 m row spacing and 0.15 m between hills.
Table 1. The six environments used to discriminate perennial rice genotypes.

* l.s.d. = 0.26; p = 0.05.
†Xepon 2012 had to be abandoned after severe trampling by livestock; M = missing.
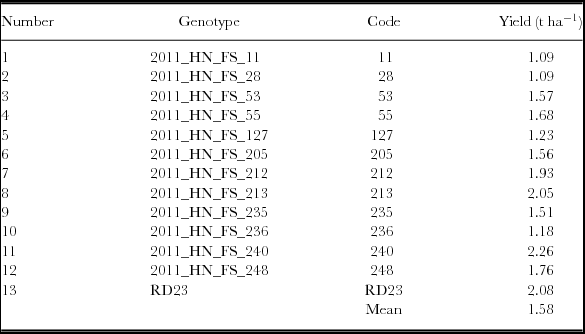
The 13 genotypes (G) comprised Oryza sativa cultivar RD23, and 12 perennial rice derivatives obtained from the cross between Oryza sativa cv. RD 23 and Oryza longistaminata (Table 2). RD23 is a popular Indica lowland rice cultivar released in Thailand, which is widely grown across south-east Asia because of its broad adaptation, photoperiod insensitivity, high yield potential, good disease resistance and high grain quality. In contrast, O. longistaminata is a wild rhizomatous perennial adapted to swampy regions, but with poor agronomic type. The cross between them was made with the intent of combining the perennial habit of O. longistaminata, with the agronomic features, broad adaptation and yield performance of RD23 (Tau and Sripichitt, Reference Tau and Sripichitt2000). Despite the wide cross, which required embryo rescue, it proved possible to identify progeny able to regrow after harvest, a few of which were also able to set seed (Hu et al., Reference Hu, Tau, Sacks, Fu, Xu, Li, Yang, McNally, Khush, Paterson and Li2003; Sacks et al., Reference Sacks, Dhanapala, Sta. Cruz and Sullan2006). Further cycles of selection for spikelet fertility and agronomic type resulted in the materials tested here. Details about the development of these materials are reported in Zhang et al. (Reference Zhang, Batello, Wade, Cox, Pogna, Bozzini and Chopianty2014). Genotypes are referred to by their genotype code, e.g., 2011_HN_FS_11 is Line 11 (Table 2).
Table 2. Genotypes evaluated in perennial rice experiments at Na Pok, Xepon and Pakse in 2011 and 2012. Perennial rice entries were derived from the cross between Oryza sativa cv. RD23 and O. longistaminata. (l.s.d. = 0.22; p = 0.05).
The soil at Xepon had a pH of 4.5, organic C 1.34 g kg−1, total N 0.08%, available P 3.57 mg kg−1, and exchangeable K 17.1 cmol kg−1. In Pakse, pH was 5.3, with organic C 0.67 g kg−1, total N 0.034%, available P 80.5 mg kg−1, and exchangeable K 60.8 cmol kg−1. At Na Pok, total N was not measured, but the soil pH was 5.8, organic C 1.30 g kg−1, available P 15.7 mg kg−1, and exchangeable K 12.0 cmol kg−1. Each site received 30, 30 and 30 kg ha−1 of N, P and K, respectively, as a basal dressing.
On 23 July 2011, each site was established by transplanting from adjacent seedbeds. After harvest, stubble was cut to 10 cm, so that consistent stubble for regrowth was available. The perennial rice derivatives were allowed to regrow, while RD23 had to be replanted on 28–30 May 2012. Each site had access to irrigation, which was used to assist dry season survival if needed. Crops matured on average from 26 Oct–2 Nov in 2011, and 10–16 Oct in 2012. Flowering time, plant height and panicles per plant were recorded, along with plant survival in 2012. Yield of grain and straw was measured from 0.9 m of the middle four rows (0.9 m−2).
Yield data were extracted from appropriate single-site analyses. G x E interactions were analysed using the pattern analysis tool in CropStat (De Lacy et al., Reference DeLacy, Basford, Cooper, Bull, McLaren, Cooper and Hammer1996). This method involved the joint application of cluster analysis and ordination to a transformed G x E matrix. Since the objective was to understand genotype adaptation for breeding, the G x E matrix was transformed by environment standardization (Cooper, Reference Cooper1999). The transformed data were clustered using an agglomerative hierarchical algorithm based on minimizing incremental sum of squares (Ward, Reference Ward1963). Scores for both genotypes and environments from the two-component interaction principal components model (IPCA) were computed for PCA1, PCA2 and PCA3, and plotted as biplots, with environment points at the end of spokes with labels as in Table 1, and genotype points as symbols with labels as in Table 2. Patterns of grain yield and other selected parameters were then examined for genotype groups over environment groups.
RESULTS
Long-term weather data showed temperatures ranged from 15–35°C, with the lowest minimums in December–January after the wet season, and the highest maximums in March–May towards the end of the dry season (Table 3). Temperatures followed similar patterns at the three sites, but Champassak was slightly warmer, with higher evaporative demand. Mean annual rainfall was higher in Champassak (2044 mm) than Vientiane (1661 mm) than Savannakhet (1452 mm), but in all cases, there was a pronounced dry season from November–March, with an average of only 70 mm of rain being received during those 5 months.
Table 3. Long-term mean monthly maximum and minimum temperature (°C) and pan evaporation (mm), and monthly rainfall (mm) in 2011 and 2012 relative to the long-term mean monthly rainfall (mm), for Vientiane, Savannakhet and Champassak in Lao PDR.
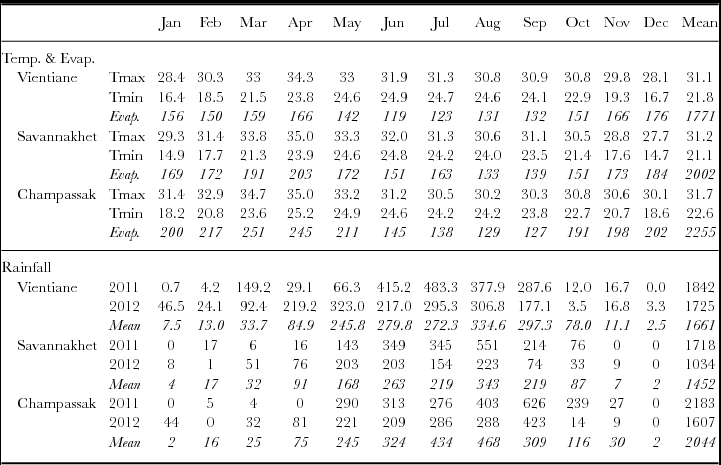
In 2011, the rains were later than average (Table 3), delaying transplanting to 23 July. While the wet season finished early in Na Pok relative to its long term mean, rainfall was higher than average there from January–May 2012, while Xepon and Pakse had more typical dry seasons. Nevertheless, the high evaporative demand during the dry season was barely relieved by the limited rainfall and infrequent life-saving irrigation, which was applied in flushes for survival only, so flowering did not occur in the dry season. Consequently, grain yields could only be harvested from the wet season crops in 2011 and 2012. In the 2012 wet season, however, all sites had a dry finish from October onwards (Table 3), and grain yields were observed to be much lower in this second wet season. Unfortunately, after the first heavy rains in 2012, the Xepon site had to be abandoned, when livestock broke the fence, grazed the first green shoots available after the dry season, and severely trampled the plots. Thus, 13 genotypes and 5 environments were available for G x E analysis.
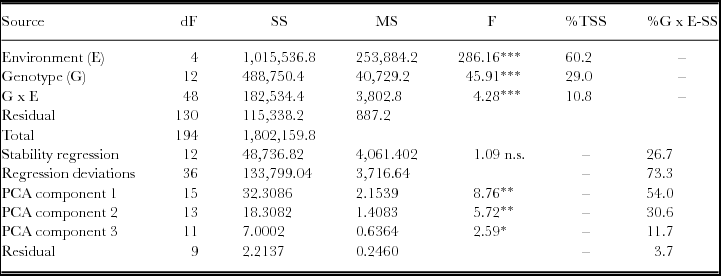
Site mean yield ranged from 0.17 to 2.72 t ha−1 (Table 1). Grain yields in the first wet season averaged 2.35 t ha−1, but only 0.43 t ha−1 from second wet season regrowth. Genotype mean yield ranged from 1.09 to 2.26 t ha−1, with an overall mean yield of 1.58 t ha−1 (Table 2). For grain yield, genotype main effects accounted for 29.0% of total sum of squares (TSS), with G x E interactions responsible for 10.8% and environments 60.2% (Table 4). Stability regression accounted for only 26.7% of the G x ESS). Cluster analysis on environment standardized residuals was used to identify three environment groups and six genotype groups, which preserved 49.7, 98.0 and 42.8% of the ESS, GSS, and G x ESS, respectively. Ordination analysis indicated three interaction principal component axes (IPCA), accounting for 54.0, 30.6 and 11.7% of the G x ESS, respectively, or 96.3% in total (Table 4).
Table 4. Across site ANOVA for G x E interaction studies with 13 genotypes and 5 environments.
The cluster dendogram for environments (Figure 1a) initially separated two major fusions, Na Pok to the north (Environment group E1), and Xepon and Pakse to the south. Xepon 2011 (E2) then separated from Pakse (E3), before both Na Pok and Pakse separated by year into their 2011 and 2012 environments. In the cluster dendogram for genotypes (Figure 1b), four genotypes (Fusion 23) separated initially from the remaining nine (Fusion 24), which then divided into two groups of five (Fusion 21) and four genotypes (Fusion 22). Each of these three fusions (23, 21 and 22) then divided in turn, with a single genotype separating from each. Fusion 23 divided into genotype group G1 (Line 11) and genotype group G2 (Line 28, 127 and 236). Fusion 21 separated into G3 (Line 53) and G4 (Line 55, 205, 212 and 235). Fusion 22 divided into G5 (Line 248) and G6 (Line 213 and 240 and cultivar RD23).
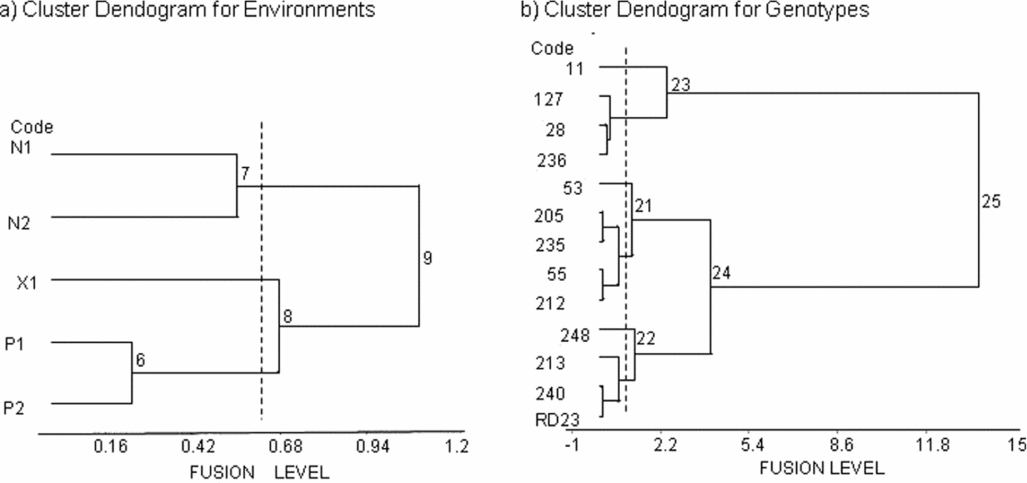
Figure 1. Environment (a) and genotype (b) groupings applied to standardized yield data for 13 perennial rice derivatives (Oryza sativa L., cv. RD23/Oryza longistaminata) over 5 environments. The dendograms show fusion levels at which the groups join. The fusion level is proportional to the increase in within group SS at each fusion. The vertical dashed lines represent the truncation (a) of 5 environments into 3 groups, and (b) of 13 genotypes into 6 groups, using Ward's agglomerative clustering algorithm. Refer to Tables 1 and 2 for environment and genotype abbreviations, respectively.
For the biplots, all environments were positive for PCA1 (Figure 2a). PCA2 separated the environments by location, with the Na Pok environments (E1) positive, the Pakse environments (E3) neutral and Xepon 2011 (E2) negative. PCA3 then separated the environments by year, with both Na Pok 2012 and Pakse 2012 environments positive, Xepon 2011 neutral, and both Na Pok 2011 and Pakse 2011 negative (Figure 2b). For genotypes, PCA1 initially separated G1 and G2 which were negative, from G3 and G4 which were neutral, and G5 and G6 which were positive (Figure 2a), and also contributed to separating G1 and G5 from G2 and G6, respectively. PCA2 then separated G3 from G4. Finally, PCA3 (Figure 2b) also separated G1 from G2, and illustrated the adaptive patterns of the genotype groups in relation to the environment groups, as discussed in 4.2.
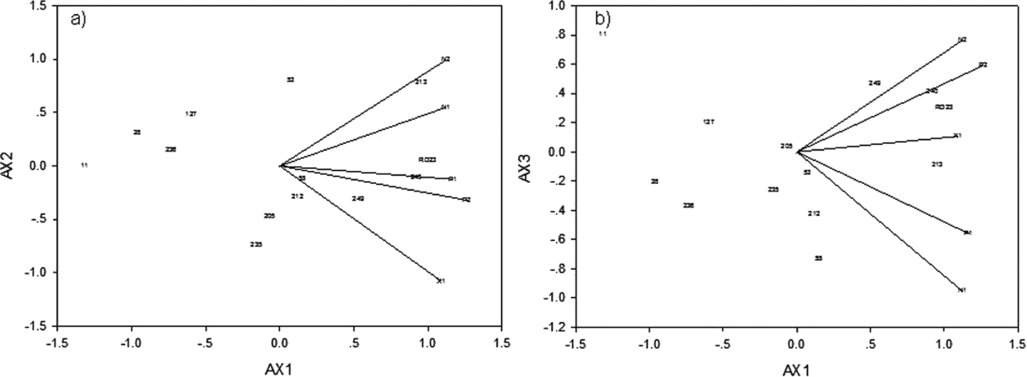
Figure 2. Principal component analysis (location standardized) for the 3 environment group x 6 genotype group interaction for grain yield, for (a) PCA1 and PCA2 and (b) PCA1 and PCA3, from 5 environments and 13 perennial rice derivatives (Oryza sativa L., cv. RD23/Oryza longistaminata). Refer to Tables 1 and 2 for environment and genotype abbreviations, respectively. The G x E interactions for PCA1 and PCA2, and for PCA1 and PCA3, accounted for 84.6 and 65.7% of the sum of squares, respectively.
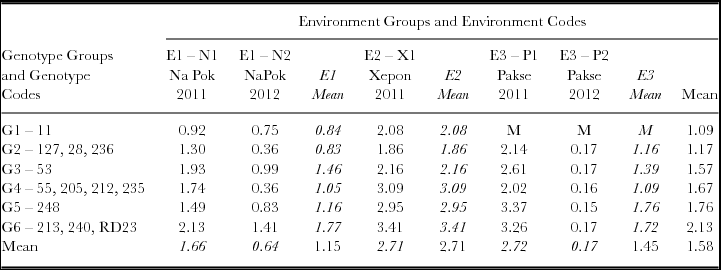
Grain yields are shown for the 6 genotype groups across the three environment groups in Table 5. Among environments on average, the 2011 environments out-yielded the 2012 environments, with Xepon and Pakse 2011 yielding 2.72 t ha−1, Na Pok and Pakse 2012 yielding only 0.41 t ha−1, with Na Pok 2011 intermediate (1.66 t ha−1). Among genotype groups, G5 and G6 were highest yielding (2.04 t ha−1), G1 and G2 were lowest yielding (1.15 t ha−1), with G3 and G4 intermediate (1.65 t ha−1). Genotype groups did not differ in Pakse 2012, with all groups averaging about 0.17 t ha−1. Otherwise, G6 (Line 213, 240 and RD23) was highest yielding over all environments, while G5 (Line 248) yielded well in Xepon and Pakse in 2011, but was intermediate at Na Pok in both years. In contrast, G1 (Line 11) and G2 (Line 28,127 and 236) were generally lowest yielding over all environments, with G1 (Line 11) perhaps separating due to its failure at Pakse in both years. While the intermediate yielding groups were similar on average, G3 (Line 53) performed better in Na Pok in both years, while G4 (Line 55, 205, 212, 235) performed well at Xepon in 2011, but poorly in Pakse 2011 and Na Pok 2012.
Table 5. Grain yield (t ha−1) for 6 genotype groups across 3 environment groups. (l.s.d. = 0.21; P = 0.05; M = missing).
The attributes of the genotype groups are presented in Table 6. G5 and G6, G3 and G4, and G1 and G2 maintained their overall rankings as high, mid and low yielding over years. Again, G6 (Line 213, 240 and RD23) was highest yielding in both years, with high plant survival in 2012, and high panicle numbers per plant in both years. G5 (Line 248) also yielded well, had a similar attribute pattern to G6 overall, but produced the highest straw yield of 4.27 t ha−1 in Xepon 2011. In contrast, the low-yielding G1 (Line 11) and G2 (Line 28, 127 and 236) were lowest in most attributes, apart from G1 (Line 11) being tallest at 91 cm, latest in flowering at 99 days, and lowest in panicle number per plant. Among the intermediates, G3 (Line 53) was the earliest flowering at 75 days, the shortest at 71 cm, and retained a high panicle number per plant in both years, with all plants surviving in 2012. As a result, the 2012 yield of Line 53 was the highest proportion of its 2011 yield at 26.0%, with only G6 (the high-yielding Line 213, 240 and RD23) having a similar proportion at 24.5%, followed by 18.8% for G5 (Line 248). The other intermediate group G4 (Line 55, 205, 212 and 235) had the lowest plant survival in 2012 at 82% and lower panicle numbers per plant, so its 2012 yield was only 13.7% of its 2011 yield, a result similar to that of the low-yielding groups G1 and G2.
Table 6. Main effect of genotype groupings on yield components of perennial rice derivatives. In 2011, data on flowering time, plant height and panicles plant−1 are from Xepon 2011 only, while grain yield is the mean of Xepon 2011, Pakse 2011 and Na Pok 2011. In 2012, regrowth at Xepon 2012 was destroyed by livestock trampling, so data presented are means from Na Pok 2012 and Pakse 2012 only. (l.s.d. is p = 0.05).

* For Line 213 and 240 only. The annual rice cultivar RD23 failed to survive, (Plant survival 0%), and had to be re-sown on 28–30 May 2012.
These trait associations can be summarized using correlation analysis. Grain yield in 2012 was correlated with grain yield in 2011 (r = 0.72**), plant survival in 2012 (r = 0.56*), and panicle number per plant in 2012 (r = 0.52*). Panicles per plant in 2012 were correlated with panicles per plant in 2011 (r = 0.83**), and grain yield in 2011 (r = 0.48*). Plant height in 2012 was negatively correlated with panicles per plant in 2011 (r = −0.48*), and straw yield in 2011 (r = −0.51*).
DISCUSSION
Genotype effects accounted for 39.8% of the TSS for grain yield (Table 4). Two vectors accounted for 72.9% of G x E, suggesting a high repeatable component, which was consistent with other studies in rice (Botwright Acuna et al., Reference Botwright Acuna, Lafitte and Wade2008; Wade et al., Reference Wade, McLaren, Quintana, Harnpichitvitaya, Rajatasereekul, Sarawgi, Kumar, Ahmed, Sarwoto Singh, Rodriguez, Siopongco and Sarkarung1999b). Thus, cluster and ordination analysis reduced the matrix from 13 genotypes × 5 environments to 6 genotype groups x 3 environment groups, whilst retaining the repeatable component of G x E.
Environment groupings
Cluster and ordination analysis clarified the relationships among the five environments, and how their conditions influenced genotype response. The sites differed in soil fertility, with soil pH and available P decreasing from Na Pok to Pakse to Xepon. In the first wet season, Na Pok experienced an earlier cessation in wet season rainfall in October 2011 (Table 3), which accounted for its lower yield of 1.66 t ha−1, relative to Xepon and Pakse with 2.72 t ha−1 (Table 5). From regrowth in the second wet season, yields were much lower (0.43 t ha−1), after the high evaporative demand in the dry season, and the early cessation of wet season rainfall at all sites in 2012.
In the dendograms (Figure 1a), environments were initially separated geographically and by soil fertility, and by the timing of rainfall cessation in the 2011 wet season, which separated Na Pok from Xepon from Pakse. Environments were then split by year (Figure 1a), especially by the impact of environmental stresses on yield from regrowth in the second wet season, 2012. Gauch and Zobel (Reference Gauch and Zobel1989) stated three genotypes by three environments was the absolute minimum for G x E analysis. Here, only five environments were available, after losing Xepon in the second year. Consequently, only three environment groups could be identified with confidence. Nevertheless, the observation that environments were also separated by year, especially by the impact of environmental stresses on yield from regrowth in the second year, was expected to be reinforced, had data from the third site at Xepon also been available in the second year.
For the biplots (Figure 2a), PCA1 was interpreted to represent yield potential, which was clearly shown by the genotype groupings in 4.2. PCA2 represented soil fertility and seasonal favourability, especially in the first wet season, which separated the locations. PCA3 (Figure 2b) then represented the environmental stresses encountered by regrowth in the second wet season, when yields were very low, contributing only 18.4% of first-year grain yields on average. These environmental factors defined the relationships among environments, and the basis of genotype group responses, as discussed in 4.2.
Adaptation of genotype groups
The 13 genotypes were grouped in cluster and ordination analysis by their responses to the environmental challenges above. This is best illustrated in the biplots (Figure 2a and b), with PCA1 separating high-yielding groups (G5 and G6) to the right, intermediate-yielding groups (G3 and G4) to the middle, and low-yielding groups (G1 and G2) to the left. The combination of PCA1 to PCA3 then separated the subgroups: G1 from G2, G3 from G4 and G5 from G6; based on their differential responses to environmental stresses. PCA1 to PCA3 summarized the patterns of genotype adaptation across the environment groups, based on the projection of each genotype or genotype group on the respective environmental vectors (Botwright Acuna and Wade, Reference Botwright Acuna and Wade2013; Yan, Reference Yan2002). Thus, G6 (Line 213, 240 and RD23) was widely adapted to all environments, with G5 (Line 248) being especially adapted to the 2012 environments. G3 and G4 were neutral, though G3 (Line 53) showed some preference for the Na Pok environments. G1 and G2 were poorly adapted everywhere, with the tall and late G1 (Line 11) being especially poor in the dry finish at Na Pok 2011. These results suggest Lines 213, 240 and 248 could be considered for release, given their broad adaptation, and their survival and performance in the second wet season. The results also suggest it will be important to select perennial rice for improved survival during the dry season, and capacity for regrowth and yield in the following wet season, in order to ensure long-term stability of performance over subsequent cycles.
Implications for future research
The derivatives tested here were from quite early in the breeding process, and were not specifically selected for performance under the harsher rainfed lowland conditions in Lao PDR. Nevertheless, under the conditions encountered, the yields expressed here in the first wet season were consistent with average expectations of rainfed lowland rice in Lao PDR, where performance is limited by sandy soils of low fertility and low water holding capacity (Linquist and Sengxua, Reference Linquist and Sengxua2001). While yields were lower in the second wet season (Table 5), it is noteworthy that all derivatives survived the dry season, with access to life-saving irrigation, and were able to regrow and produce grain in the second wet season. This is a promising outcome, as the annual rice RD23 was not able to survive and regrow in these conditions (Table 6), and had to be re-sown. Importantly, Line 213, 240 and 248 were able to yield comparably to RD23 from regrowth in that second wet season, under the same conditions. This result suggests that, even without further development, the better performing lines could be considered for release where supplementary irrigation is available in the dry season, or more importantly, for favourable rainfed conditions, especially those in which a shorter or milder dry season is expected, such as in northern or eastern Laos.
Although yields of line 213, 240 and 248 in the second wet season were comparable with the re-sown annual check RD23, yields were nevertheless observed to be substantially lower in the second year. In contrast, under the milder conditions encountered in Yunnan Province of China, perennial rice derivatives have recently been reported to be able to perform for up to four cycles, with decline in yield observed only when environmental stresses (low temperature and/or rainfall deficit) were encountered (Zhang et al., Reference Zhang, Hu, Yang, Liu, Yang, Zhou, Samson, Boualaphanh, Huang, Huang, Zhang, Huang, Tao, Harnpichitvitaya, Wade and Hu2017). This paper adds to that conclusion, by demonstrating that perennial rice derivatives could still survive and produce grain in Lao PDR, under more severe environmental stresses than were reported in Yunnan. This supports the contention that promising perennial rice derivatives may be suitable for release under rainfed conditions, which is where perennial rice is really needed, to stabilize and diversify mixed crop-livestock systems in more marginal environments. Perennial rice would be expected to contribute to soil stability there, by retaining some ground cover and viable roots throughout the dry season, thereby reducing nutrient and soil losses to leaching and erosion, while also potentially providing grain and fodder for livestock.
CONCLUSIONS
This manuscript, with its companion paper (Zhang et al., Reference Zhang, Hu, Yang, Liu, Yang, Zhou, Samson, Boualaphanh, Huang, Huang, Zhang, Huang, Tao, Harnpichitvitaya, Wade and Hu2017), is the first report on field performance of perennial rice, a potential new crop. Perennial rice derivatives, admittedly with access to life-saving irrigation in the dry season, were able to survive, regrow and produce grain in a second wet season in Lao PDR. Critically, they were able to do this when the annual rice RD23 was not able to regrow, and had to be re-sown. Line 213, 240 and 248 were able to produce comparable yields to RD23 in that second wet season, under the same harsh conditions. Development of perennial rice should target rainfed environments, especially the uplands, where the greatest impact on system sustainability, food security and farmer livelihood is expected. Attention should also be directed to farmer perception of perennial rice, its potential role in their farming systems, its compatibility with livestock, and its ecosystem benefits. Research should especially target the montaine lowlands and uplands, where the need is greatest for system sustainability.
Acknowledgements
The Australian Centre for International Agricultural Research (ACIAR) supported this research, under CSE/2009/004, Developing Improved Farming and Marketing Systems in Rainfed Regions of Southern Lao PDR. We thank the Provincial Governments of Savannakhet and Champassak, and the National Agricultural and Forestry Research Institute for providing land, facilities and labour for the successful conduct of these experiments.


