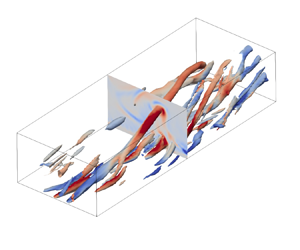
Hostname: page-component-7bb8b95d7b-lvwk9 Total loading time: 0 Render date: 2024-10-01T11:39:54.543Z Has data issue: false hasContentIssue false

Effects of streamwise rotation on helicity and vortex in channel turbulence

Published online by Cambridge University Press:  08 February 2024

Running Hu
Affiliation:
LHD, Institute of Mechanics, Chinese Academy of Sciences, Beijing 100190, PR China School of Engineering Science, University of Chinese Academy of Sciences, Beijing 100049, PR China
Xinliang Li
Affiliation:
LHD, Institute of Mechanics, Chinese Academy of Sciences, Beijing 100190, PR China School of Engineering Science, University of Chinese Academy of Sciences, Beijing 100049, PR China
Changping Yu*
Affiliation:
LHD, Institute of Mechanics, Chinese Academy of Sciences, Beijing 100190, PR China
*
Email address for correspondence: [email protected]

Abstract

Helicity plays a key role in the evolution of vortex structures and turbulent dynamics. The helicity dynamics and vortex structures in streamwise-rotating channel turbulence are discussed in this paper using the helicity budget equation and the differentiated second-order structure function equation of helicity. Generally, rotation and Reynolds numbers exhibit opposing effects on the interscale helicity dynamics and the vortices. Under the buffer layer, the positions of the helicity peaks are proportional to the ratio between the Reynolds and rotation numbers. The mechanism is related to the opposing effects of convection and rotation. Rotation directly affects the helicity balance through the Coriolis term and corresponding pressure term. In the buffer layer, the scale helicity is negative at small scales but positive at large scales, which is mainly induced by the spatial effects (the production and the spatial turbulent convection) but reduced by interscale cascades. Examination of structures reveals the close association between scale helicity and streaks, with streak lift angles exhibiting an increase with rotation and a decrease with Reynolds numbers. In the log-law layer, the Coriolis terms and corresponding pressure terms are proportional to the rotation numbers but remain independent of the Reynolds numbers. The negative scale helicity is forward cascaded towards small scales. Generally, spanwise vortices in the log-law layer are related to sweep events and forward cascades. Our findings indicate that these spanwise vortices are suppressed by rotation but recover with increasing Reynolds numbers, aligning with the effects observed in the scale helicity balance.

Type
JFM Papers
Copyright
© The Author(s), 2024. Published by Cambridge University Press

1. Introduction

Rotation is a critical component in turbomachinery as it is responsible for transferring energy between the rotor and the fluid medium (Weiss et al. Reference Weiss, Gardner, Schwermer, Klein and Raffel2019; Jing & Ducoin Reference Jing and Ducoin2020; Liu et al. Reference Liu, Tang, Scillitoe and Tucker2020). Channel turbulence with rotation is a simplified model for turbulence observed in rotating machinery. As rotation is introduced, the wall-bound turbulence is strongly modified. Based on the Lie group method, Oberlack (Reference Oberlack2001) proposed the linear profile of the mean velocity in the spanwise-rotation channel turbulence. Specifically, in the channel centre, the streamwise mean velocity is linear and the slope is proportional to the rotation rates (Johnston, Halleent & Lezius Reference Johnston, Halleent and Lezius1972). With increasing rotation rates, the ‘second plateau’ emerges in the Reynolds shear stress, resulting in a parabolic streamwise mean velocity profile (Xia, Shi & Chen Reference Xia, Shi and Chen2016). In addition, large longitudinal Taylor–Görtler-like (TG) vortices appear in the cross-section (Kristoffersen & Andersson Reference Kristoffersen and Andersson1993; Dai, Huang & Xu Reference Dai, Huang and Xu2016). In streamwise-rotating channel turbulence, Oberlack et al. (Reference Oberlack, Cabot, Reif and Weller2006) used the group analysis and large eddy simulation (LES) to identify the secondary mean flow, i.e. the spanwise mean velocity perpendicular to the main flow. Furthermore, the secondary mean flow is reversed around the channel centre, which has been verified through the stability analysis (Masuda, Fukuda & Nagata Reference Masuda, Fukuda and Nagata2008) and various direct numerical simulation (DNS) (Yang, Su & Wu Reference Yang, Su and Wu2010; Yang & Wang Reference Yang and Wang2018; Yang et al. Reference Yang, Deng, Wang and Shen2018; Dai, Huang & Xu Reference Dai, Huang and Xu2019; Yan, Li & Yu Reference Yan, Li and Yu2022). Yang et al. (Reference Yang, Su and Wu2010) expanded the helical wave decomposition (HWD) (Waleffe Reference Waleffe1992, Reference Waleffe1993) to the periodic channel domain and found that the inertial wave is responsible for the secondary mean flow in the streamwise-rotating channel turbulence. Yang & Wang (Reference Yang and Wang2018) found that the necessary computational configuration is sensitive to the rotation rates and gave the three criteria for fine configurations. In terms of flow structures, Dai et al. (Reference Dai, Huang and Xu2019) found the inclined streamwise vortices in streamwise-rotating channel turbulence, where the inclination angles are inversely proportional to the rotation rates. Furthermore, Yang & Wang (Reference Yang and Wang2018) found that when the rotation number $Ro_{\tau }=150$, the inclined angle is negligible and TG vortices appear.

In terms of interscale transfers, the second-order structure function was introduced by Kolmogorov (Reference Kolmogorov1941). The budget equation of the second-order structure function is named as the Kolmogorov equation. Then, the generalized Kolmogorov equation (GKE) was used in the transfers of wall-bound flows (Danaila et al. Reference Danaila, Anselmet, Zhou and Antonia2001; Marati, Casciola & Piva Reference Marati, Casciola and Piva2004), including the channel turbulence (Marati et al. Reference Marati, Casciola and Piva2004; Cimarelli, De Angelis & Casciola Reference Cimarelli, De Angelis and Casciola2013; Cimarelli et al. Reference Cimarelli, De Angelis, Schlatter, Brethouwer, Talamelli and Casciola2015, Reference Cimarelli, De Angelis, Jimenez and Casciola2016) and separated flows (Mollicone et al. Reference Mollicone, Battista, Gualtieri and Casciola2018). Compared with the spectral analysis, the second-order structure function provides a natural definition of scales in inhomogeneous turbulence and the GKE methods could describe the interscale dynamics in inhomogeneous turbulence. For example, Cimarelli et al. (Reference Cimarelli, De Angelis, Jimenez and Casciola2016) investigated the interscale transfers in the wall-normal directions and found two ways of interscale energy transfers, consistent with the classical attached vortex model (Marusic & Monty Reference Marusic and Monty2019). Recently, Gatti et al. (Reference Gatti, Chiarini, Cimarelli and Quadrio2020) used the generalized Kolmogorov equation for the Reynolds stresses to study the roles of Reynolds stresses in interscale dynamics, where three examples were discussed in detail. In the streamwise-rotating channel turbulence, Yang et al. (Reference Yang, Deng, Wang and Shen2020b) used spectral analysis to study the interscale transfers and found four key processes for sustaining the motion of large-scale TG vortices. Hu, Li & Yu (Reference Hu, Li and Yu2023) analysed the multiscale behaviours of the inclined vortices and explained the mechanisms through the generalized Kolmogorov equation for Reynolds stresses. Yang et al. (Reference Yang, Deng, Wang and Shen2018) decomposed the pressure fluctuating field into the two parts induced by rotation and convection and they identified the effects of rotation on the pressure fields through spectral analysis.

Helicity is the contraction of the velocity and vorticity, and is another second-order inviscid invariant in addition to energy in three-dimensional turbulence (Moffatt & Tsinober Reference Moffatt and Tsinober1992; Alexakis & Biferale Reference Alexakis and Biferale2018). The conservation of helicity stems from the conservation of vorticity line topology and Helmholtz's laws (Davidson Reference Davidson2016). Therefore, helicity intrinsically represents the topology of the vortices. Specifically, there are three typical helical structures: linkage, twisting and writhing (Irvine Reference Irvine2018). Helicity plays a vital role in mixing, instability (Tsinober Reference Tsinober2019) and dynamos in magnetohydrodynamic turbulence (Pouquet & Yokoi Reference Pouquet and Yokoi2022). Traditionally, the study of helicity mainly concentrated on the homogeneous turbulence, such as the scaling laws (Brissaud et al. Reference Brissaud, Frisch, Leorat, Lesieur and Mazure1973; Teimurazov et al. Reference Teimurazov, Stepanov, Verma, Barman, Kumar and Sadhukhan2018), decaying laws (Polifke & Shtilman Reference Polifke and Shtilman1989; Biferale et al. Reference Biferale, Boffetta, Celani, Lanotte, Toschi and Vergassola2003), HWD (Waleffe Reference Waleffe1992), intermittency (Chen et al. Reference Chen, Chen, Eyink and Holm2003b) and cascades (Alexakis & Biferale Reference Alexakis and Biferale2018; Chen, Chen & Eyink Reference Chen, Chen and Eyink2003a). In anisotropic turbulent flows, there is also valuable research. Pelz et al. (Reference Pelz, Yakhot, Orszag, Shtilman and Levich1985) found that in channel turbulence, in the inner layer with high dissipation, the normalized helicity is evenly probable, but the normalized helicity tends to be greatly distinguished. Hiejima (Reference Hiejima2020) studied the instability of Batchelor vortices and found the helicity instability, which is related to a negative helicity with a large swirl number. Povitsky (Reference Povitsky2017) studied the three-dimensional flow with elevated helicity in the driven cavity and confirmed that the cases with strong helicity mix better than several other cases. In the presence of the boundary layer, streamwise-rotating channel turbulence is a natural helical flow. The coupling effects between helicity and the boundary layer have not been taken into consideration until recent years. Yang & Wang (Reference Yang and Wang2018) introduced the HWD in this flow and investigated the transfer process in the whole domain. Yu et al. (Reference Yu, Hu, Yan and Li2022) studied the helicity distribution in such a flow and performed simple multiscale analysis related to the dual channel of the helicity cascades. The dual channel process was first found in homogeneous turbulence (Yan et al. Reference Yan, Li and Yu2022) and then generalized to the streamwise-rotating channel turbulence by Yu et al. (Reference Yu, Hu, Yan and Li2022). Nevertheless, in streamwise-rotating channel turbulence, the interscale helicity dynamics and their relations with vortices have not been thoroughly studied.

In this paper, we discuss the effects of rotation and Reynolds numbers on the helicity dynamics through the helicity budgets, the differentiated structure function equation as well as the vortex structures. The paper is organized as follows. In § 2, we give the details of simulations and basic statistics. Next, in § 3, we first derive the budget equation for the scale helicity and then analyse related dynamics. Then, the relation between helicity and the vortices is discussed in § 4. Finally, conclusions are given in § 5.

2. Numerical simulations

The governing equations, i.e. the incompressible Navier–Stokes (N–S) equations, can be written as

(2.1) \begin{equation} \left.\begin{array}{l@{}l} \dfrac{\partial {U_i}}{\partial t} +{U_j} \dfrac{\partial U_i}{\partial x_j} ={-}\dfrac{1}{\rho}\dfrac{\partial P}{\partial x_i} +\nu\dfrac{\partial ^2 U_i}{\partial x_ix_i} +2\epsilon_{ij1}U_j\varOmega - \dfrac{\varPi}{\rho}\delta_{i1}, \\ \dfrac{\partial U_i}{\partial x_i} =0, \end{array}\right\} \end{equation}

where $U_i$ is the velocity, $P$ is the total pressure including the centrifugal effects (Davidson Reference Davidson2013), $\rho$ is the density, $\nu$ is the kinematic viscosity, $\varOmega$ is the rotation rate, $\varPi$ is a constant pressure gradients and $\delta _{ij}$ is the Kronecker delta. The computational configurations are shown in table 1. The Reynolds number $Re_\tau =u_\tau h/\nu$ ranges from $180$ to $590$ and the rotation number $Ro_\tau =2\varOmega h/u_\tau$ ranges from $0$ to $60$, where $u_\tau$ is the friction velocity and $h=1$ is the channel half-width. The cases used in this paper have reached the statistical equilibrium states. For the averaged quantities, the results in this paper are averaged over 40 $h/u_\tau$ after the statistical steady state is reached. In addition, the friction velocity $u_\tau$ and the viscous length scale $\delta =\nu /u_\tau$ are used to normalize the quantities in the following analyses, which are marked by the superscript ‘$+$’. Additionally, the error bars of the main results are evaluated using the standard deviation and are indicated in the figure captions and Appendix A.2.

Table 1. Computational descriptions of simulations.

2.1. Helicity

The mean helicity $H$, fluctuating helicity $\langle h \rangle$ and their components ($H_i$ and $\langle h_i \rangle$) are defined as

(2.2a,b)\begin{equation} H=\sum_{i=1}^3 H_i=\sum_{i=1}^3\left\langle U_{\underline{i}}\right\rangle \left\langle W_{\underline{i}} \right\rangle, \quad\left\langle h \right\rangle=\sum_{i=1}^3\left\langle h_i \right\rangle =\sum_{i=1}^3\left\langle u_{\underline{i}}\omega_{\underline{i}} \right\rangle, \end{equation}

where $W_i=\epsilon _{ijk}\partial U_k/ \partial x_j$ is the vorticity, ${u_i}$ is the fluctuating velocity, ${\omega _i}=\epsilon _{ijk} \partial u_k/\partial x_j$ is the fluctuating vorticity, the underlines in the subscript represent no contraction, and $\langle {\cdot } \rangle$ represents the average on the $x_1$ and $x_3$ direction. The mean velocities and vorticities are given in Appendix A.1 for reference.

Figure 1(a,b) shows the mean helicity $H$ and its decomposition $H_i$, respectively. As shown in figure 1(a), the mean helicity is positive around the wall but negative around the channel centre. However, with increasing rotation, the mean helicity is extended to the vicinity of the wall. In contrast, as $Re_\tau$ increases, the mean helicity is reduced. The decomposition in figure 1(b) does not include the wall-normal component, because $H_2=\langle U_2 \rangle \langle W_2 \rangle =0$. In addition, when $x_2^+\lessapprox 4$, $H_1\approx -H_3$, which is because

(2.3)\begin{equation} \left.\begin{gathered} \left\langle U_1 \right\rangle\left\langle W_1 \right\rangle=\left\langle U_1 \right\rangle \left\langle \frac{\partial U_3}{\partial x_2} \right\rangle \approx \left\langle \frac{\partial U_1}{\partial x_2} \right\rangle\left\langle \frac{\partial U_3}{\partial x_2} \right\rangle x_2,\\ \left\langle U_3 \right\rangle \left\langle W_3 \right\rangle={-}\left\langle U_3 \right\rangle \left\langle \frac{\partial U_1}{\partial x_2} \right\rangle \approx{-}\left\langle \frac{\partial U_1}{\partial x_2} \right\rangle\left\langle \frac{\partial U_3}{\partial x_2} \right\rangle x_2. \end{gathered}\right\} \end{equation}

Figure 1. Profile of mean helicity: (a) overall helicity $H^+$; (b) decomposed helicity $H_i^+$ of ST30 and the grey filled region shows the error bar of $H^+$.

Figure 2 gives the fluctuating helicity $\langle h \rangle$. The distribution of $\langle h \rangle$ is similar to that of $H$ but has a shorter positive range. With rotation becoming stronger, the maxima of the helicity shift towards lower locations. In contrast, as $Re_\tau$ increases, the fluctuating helicity is reduced. The decomposed fluctuating helicity $\langle h_i \rangle$ of ST30 is shown in figure 2(b). When $x_2\lessapprox 4$, $\langle h_1 \rangle \approx -\langle h_3 \rangle$, which can be deduced in a way similar to (2.3). Furthermore, $\langle h_2 \rangle$ is one order less than the other two components. Above the buffer layer, the three components are all negative.

Figure 2. Profile of fluctuating helicity: (a) overall helicity $\langle h \rangle$; (b) decomposed helicity $\langle h_i \rangle$ of ST30 and the grey filled region shows the error bar of $\langle h \rangle ^+$.

Figure 3 shows the relation between the peak position $x_2^+ |_{max{[\langle h \rangle ^+]}}$ and the parameter $Re_\tau /Ro_\tau$. As $Ro_\tau$ increases or $Re_\tau$ decreases, the peaks approach the wall. Especially, ST07 and ST15R have the same $Re_\tau /Ro_\tau$, and their peaks almost overlap with each other. The relation between the peak positions and the parameter $Re_\tau /Ro_\tau$ is fitted using a sigmoid function, leading to the following expression:

(2.4)\begin{equation} x_2^+ |_{\max{[\left\langle h \right\rangle ^+]}}=2.061/(0.1316+\exp({-}0.1218\, Re_\tau/Ro_\tau)). \end{equation}

In terms of the underlying mechanisms, as shown by the N–S equations (2.1), the Coriolis effects is proportional to the rotation rates $\varOmega$. As $Ro_\tau$ increases, rotation effects could penetrate deeper regions within the boundary layer. Considering the effects of $Re_\tau$, for the near-wall inclined vortex structures, the streamwise velocity and the rotation-induced spanwise velocity are two opposing effects (Hu et al. Reference Hu, Li and Yu2023), which could be the same for the helicity. The streamwise velocity effects can be reflected through $Re_\tau$. In the following analysis, the mechanism will be further discussed using the helicity budgets and structure functions.

Figure 3. Relation between the peak $x_2^+ |_{max{[\langle h \rangle ^+]}}$ and the parameter $Re_\tau /Ro_\tau$. The black solid line is the fitted sigmoid function (2.4) and the black dashed line serves as a reference for the linear law.

2.2. Helicity budget

The budget equation for $\langle h \rangle$ is written as

(2.5) \begin{align} &-\! \left\langle \gamma_{i2} \right\rangle \frac{\mathrm{d} \left\langle U_i \right\rangle }{\mathrm{d}\kern 0.06em x_2} -\left\langle u_iu_2 \right\rangle \frac{\mathrm{d} \left\langle W_i \right\rangle}{\mathrm{d}\kern 0.06em x_2} -\frac{\mathrm{d} \left\langle hu_2 \right\rangle}{\mathrm{d}\kern 0.06em x_2} +\frac{1}{2}\frac{\mathrm{d} }{\mathrm{d}\kern 0.06em x_2}\left\langle u_iu_i\omega_2 \right\rangle -\frac{1}{\rho}\frac{\mathrm{d} \left\langle \omega_2 p_R\right\rangle }{\mathrm{d}\kern 0.06em x_2} -\frac{1}{\rho}\frac{\mathrm{d} \left\langle \omega_2 p_T\right\rangle}{\mathrm{d}\kern 0.06em x_2} \nonumber\\ &\quad +\nu\frac{\mathrm{d} ^2 \left\langle h \right\rangle}{\mathrm{d}\kern 0.06em x_2^2} -2\nu \left\langle \frac{\partial u_i}{\partial x_j}\frac{\partial \omega_i}{\partial x_j} \right\rangle +2\varOmega\epsilon_{ij1}\left\langle u_j \omega_i \right\rangle =0, \end{align}

where $\gamma _{ij} = \omega _iu_j-\omega _ju_i$ is the helical stress, and $p_R$ and $p_T$ are the decomposed pressure related to the Coriolis terms and the turbulent convection, respectively (Yang et al. Reference Yang, Deng, Wang and Shen2020a; Hu, Li & Yu Reference Hu, Li and Yu2022a).

For the helical stress $\langle \gamma _{ij} \rangle$, the following relations can be derived:

(2.6a,b)\begin{equation} \left\langle \gamma_{12} \right\rangle =\frac{\mathrm{d} }{\mathrm{d}\kern 0.06em x_2} \left\langle u_2 u_3 \right\rangle,\quad -\left\langle \gamma_{32} \right\rangle =\frac{\mathrm{d} }{\mathrm{d}\kern 0.06em x_2} \left\langle u_1 u_2 \right\rangle. \end{equation}

That is, partial components of $\langle \gamma _{ij} \rangle$ can be represented by the wall-normal gradients of the Reynolds stresses. According to (2.6a,b), the production and the Coriolis term can be simplified, and the fluctuating helicity budget equation (FHE) can be rewritten as

(2.7)\begin{align} &\underbrace{\vphantom{\left\langle \frac{\partial^2}{\partial X_2^2}\right\rangle} -\frac{\mathrm{d} \left\langle u_2 u_3 \right\rangle }{\mathrm{d}\kern 0.06em x_2} \frac{\mathrm{d} \left\langle U_1 \right\rangle }{\mathrm{d}\kern 0.06em x_2} +\frac{\mathrm{d} \left\langle u_1 u_2 \right\rangle }{\mathrm{d}\kern 0.06em x_2} \frac{\mathrm{d} \left\langle U_3 \right\rangle }{\mathrm{d}\kern 0.06em x_2} -\left\langle u_iu_2 \right\rangle \frac{\mathrm{d} \left\langle W_i \right\rangle}{\mathrm{d}\kern 0.06em x_2} }_{ \left\langle\varPi\right\rangle } \underbrace{-\vphantom{\left\langle \frac{\partial^2}{\partial X_2^2}\right\rangle}\frac{\mathrm{d} \left\langle hu_2 \right\rangle}{\mathrm{d}\kern 0.06em x_2} +\frac{1}{2}\frac{\mathrm{d} }{\mathrm{d}\kern 0.06em x_2}\left\langle u_iu_i\omega_2 \right\rangle }_{\left\langle T \right\rangle} \nonumber\\ &\quad \underbrace{\vphantom{\left\langle \frac{\partial^2}{\partial X_2^2}\right\rangle}-\frac{1}{\rho}\frac{\mathrm{d} \left\langle \omega_2 p_R\right\rangle }{\mathrm{d}\kern 0.06em x_2} }_{\left\langle G_R \right\rangle} \underbrace{\vphantom{\left\langle \frac{\partial^2}{\partial X_2^2}\right\rangle}-\frac{1}{\rho}\frac{\mathrm{d} \left\langle \omega_2 p_T\right\rangle}{\mathrm{d}\kern 0.06em x_2} }_{\left\langle G_T \right\rangle} +\underbrace{\vphantom{\left\langle \frac{\partial^2}{\partial X_2^2}\right\rangle}\nu\frac{\mathrm{d} ^2 \left\langle h \right\rangle}{\mathrm{d}\kern 0.06em x_2^2} }_{\left\langle D \right\rangle} \underbrace{\vphantom{\left\langle \frac{\partial^2}{\partial X_2^2}\right\rangle}-2\nu \left\langle \frac{\partial u_i}{\partial x_j}\frac{\partial \omega_i}{\partial x_j} \right\rangle}_{-\left\langle E \right\rangle} +\underbrace{\vphantom{\left\langle \frac{\partial^2}{\partial X_2^2}\right\rangle}2\frac{\mathrm{d} \left\langle u_1 u_2 \right\rangle }{\mathrm{d}\kern 0.06em x_2}\varOmega}_{\left\langle C \right\rangle} =0, \end{align}

where $\langle \varPi \rangle$ is the production and represents the interaction between the mean and fluctuating fields, $\langle T \rangle$ is the spatial turbulent convection, $\langle G_R \rangle$ and $\langle G_T \rangle$ are the pressure transfer terms related to the rotation effect and turbulent convection, $\langle D \rangle$ is the spatial viscous diffusion, $\langle E \rangle$ is the pseudo-dissipation, and $\langle C \rangle$ is the Coriolis term. Here, $\langle G \rangle =\langle G_T \rangle +\langle G_R \rangle$ is the total pressure transfer term. As shown in the equation, the Coriolis force directly affects the helicity distribution. Specifically, $\int _{-1}^0 \langle C \rangle \,\textrm {d}x_2=0$. The Coriolis term is a transfer term similar to the turbulent convection. This is non-trivial, because in the budget equation of the turbulent kinematic energy (TKE) and the GKE, the Coriolis term is zero and only redistributes energy among three components of TKE (Yang & Wang Reference Yang and Wang2018). The direct effects of $\langle C \rangle$ on the fluctuating helicity imply that in addition to the TKE, $\langle h \rangle$ could be another important quantity in the dynamics of the streamwise-rotating channel turbulence.

The results of the FHE are given in figure 4. The production $\langle \varPi \rangle$ is mainly negative. There are mainly two mechanisms: the coupling effects between the helical stresses and the mean velocity gradients, and those between the Reynolds stresses and the mean vorticity gradients. The near-wall behaviour analyses in Appendix B.1 indicate that the first mechanism is dominant in the viscous sublayer. In fact, numerical results suggest that the first mechanism ($- \langle \gamma _{i2} \rangle \,{\mathrm {d} \langle U_i \rangle }/{\mathrm {d} x_2}$) is always dominant, which is not shown here. The term in fact extracts positive fluctuating helicity to the mean helicity. The spatial turbulent convection $\langle T \rangle$ is mainly induced by convection ($-\mathrm {d} \langle h u_2 \rangle$) and vortex deformation ($\mathrm {d} \langle u_iu_i\omega _2 \rangle /\mathrm {d} x_2/2$). The term extracts positive helicity from the buffer layer to higher layers. Similarly, the viscous diffusion $\langle D \rangle$ transfers the positive helicity from the buffer layer and the high viscous sublayer towards the wall. Different from the pseudo-dissipation of energy, the helicity pseudo-dissipation $\langle E \rangle$ is not positive-definite. It is positive in the vicinity of the wall but negative at higher wall-normal positions. The Coriolis term $\langle C \rangle$ and the pressure term $\langle G \rangle$ are the two direct effects induced by rotation. In streamwise-rotating channel turbulence, the profile of the Reynolds stress $\langle u_1u_2 \rangle$ is approximately not affected by rotation (Yang & Wang Reference Yang and Wang2018). According to the definition of the Coriolis term and the profile of Reynolds stress $\langle u_1u_2 \rangle$, it could be inferred that the term is negative around the wall but positive around the channel centre. The term transfers positive helicity from the buffer layer toward the higher layers. In contrast, the pressure term $\langle G \rangle$ transfers positive helicity from the channel centre toward the wall. The term is induced by the turbulent convection $\langle G_T \rangle$ and the Coriolis force $\langle G_R \rangle$. According to the Green function of the pressure Poisson equation (Kim Reference Kim1989), the pressure always has the opposite values with its origin (convection or rotation) (Yang & Wang Reference Yang and Wang2018; Yang et al. Reference Yang, Deng, Wang and Shen2018). In fact, since there is no fluctuating helicity in non-rotating channel turbulence, the Coriolis term and the corresponding pressure transfer term are the direct reasons for the non-zero fluctuating helicity. However, the Coriolis term has the opposite sign with the fluctuating helicity, especially for ST07. The rotation-induced pressure transfer terms could be the main source for the fluctuating helicity.

Figure 4. Fluctuating helicity budget: (a) ST07; (b) ST30. The black solid lines of $x_2^+=23.4$ and $x_2^+=7.8$ give the zeros points of the helicity distribution in figure 2(a).

Figure 5 shows the distribution of $\langle G_R \rangle$, $\langle C \rangle$ and $\langle T\rangle$ for different cases. As shown, the two terms $\langle G_R \rangle$ and $\langle C \rangle$ are both proportional to $Ro_\tau$, while their relationship with $Re_\tau$ remains less evident. In comparison, the turbulent convection $\langle T \rangle$ is increased by both $Ro_\tau$ and $Re_\tau$. Especially, the comparison between ST15 and ST15R indicates that the Reynolds number effects are more remarkable for $\langle T \rangle$. These findings suggest that the contrasting impacts of $Re_\tau$ and $Ro_\tau$ on the peak law (2.4) might be associated with the terms $\langle T \rangle$ and $\langle G_R \rangle +\langle C \rangle$, respectively.

Figure 5. (a) $\langle G_R \rangle$, (b) $\langle C \rangle$ and (c) $\langle T \rangle$ of different cases in the helicity budget.

In addition, the near-wall behaviours of all terms in the helicity budget are estimated in Appendix B.1:

(2.8)\begin{equation} \left.\begin{gathered} |\left\langle\varPi\right\rangle^+|\sim x_2^{{+}2},\quad |\left\langle T\right\rangle^+|\sim x_2^{{+}2},\quad |\left\langle G \right\rangle^+ |\sim 1,\\ |\left\langle D \right\rangle^+ |\sim 1,\quad |\left\langle E \right\rangle^+ |\sim 1,\quad |\left\langle C \right\rangle^+ |\sim x_2^{{+}2}, \end{gathered}\right\} \end{equation}

which is verified in figure 6. Especially, on the wall, there is a relation between the pressure transfer and viscous effects:

(2.9)\begin{equation} \left.\left\langle G \right\rangle^+ \right|_{x_2={\pm} h}=\left.\left\langle D \right\rangle^+ \right|_{x_2={\pm} h}= \tfrac{1}{2}\left.\left\langle E \right\rangle^+ \right|_{x_2={\pm} h}, \end{equation}

which means that the total pressure transfer is equal to the viscous diffusion on the wall. The relation is proved in Appendix B.2.

Figure 6. Near-wall behaviours of helicity budget of ST30.

3. Differentiated generalized Kolmogorov equation of helicity

According to the multiscale property of turbulence, the interscale dynamics are as important as the spatial ones. In this section, our focus lies on examining the distribution of scale helicity and its corresponding budget equation, thereby elucidating the multiscale behaviours of helicity and several crucial physical processes.

3.1. Scale helicity distribution

First, we want to explain the relation between structure function and Fourier spectrum. Taking the scale energy for example (Davidson Reference Davidson2015), supposing the energy spectrum gives the exact definition of the energy at specific scale, one-dimensional Fourier transformation leads to the conclusion that the second-order structure function represents all energy in eddies of size $r$ or less plus a term related to the enstrophy in eddies of size $r$ or greater. However, since eddies of given size contribute to the energy spectrum across the full range of wavenumbers, the energy spectrum is not the exact definition of scale helicity. Therefore, for simplicity, one can also believe that the second-order structure function for energy (helicity) represents all energy (helicity) in eddies of size $r$ or less.

To get the helicity at a given scale, differentiation with respect to the scale $r$ is needed. Since the streamwise direction is strongly affected by rotation (Yang & Wang Reference Yang and Wang2018), in this paper, the focus is on the interscale dynamics in the $x_1$ direction. The scale helicity is then defined as

(3.1)\begin{equation} \left\langle \delta h \right\rangle ({X}_2,{r_1}) =\left\langle \partial_{r_1}( \delta {u}_i(\boldsymbol{X},{r_1}) \delta {\omega}_i(\boldsymbol{X},{r_1})) \right\rangle, \end{equation}

where $\delta$ means the increment of a quantity at two positions, $\boldsymbol {X}=(\boldsymbol {x}+\boldsymbol {x'})/2$ is the centre of the two positions, $r_1$ is the streamwise component of $\boldsymbol {r}$ and $\boldsymbol {r}=(\boldsymbol {x}-\boldsymbol {x'})$ is the scale vector. Specifically, the velocity and the vorticity increments between the two positions $\boldsymbol {x}$ and $\boldsymbol {x'}$ are defined as

(3.2a,b)\begin{equation} \delta {u}_i(\boldsymbol{X},{r_1})={u}_i(\boldsymbol{x})-{u}_i(\boldsymbol{x'}),\quad \delta {\omega}_i(\boldsymbol{X},{r_1})={\omega}_i(\boldsymbol{x})-{\omega}_i(\boldsymbol{x'}). \end{equation}

The streamwise scale helicity $\langle \delta h \rangle ({X}_2,r_1)$ is shortened as $\langle \delta h \rangle$ hereafter. When $r_1$ tends to infinity, the integral of the scale helicity tends to 2 times the fluctuating helicity:

(3.3)\begin{equation} \lim_{r_1\rightarrow\infty}\int_{0}^{r_1}\left\langle \delta h \right\rangle (X_2,l_1)\,\mathrm{d}l_1 = \lim_{r_1\rightarrow\infty}\left\langle (u_i-u_i') (\omega_i-\omega_i') \right\rangle = 2\left\langle u_i\omega_i \right\rangle, \end{equation}

which supports our definition about the scale helicity.

Figure 7(a) shows the scale helicity distribution of ST30 at different positions. As shown, the distribution at $x_2^+=10.5$ is negative at small scales ($r_1^+\lessapprox 10^2$) but positive at larger scales ($r_1^+\gtrapprox 10^2$), consistent with the observation of Yu et al. (Reference Yu, Hu, Yan and Li2022). It means that from the wall towards the channel centre, the small-scale helicity first changes from positive to negative. The change of large-scale helicity happens at a higher wall-normal position. The comparison of different cases in the buffer layer is shown in figure 7(b). As $Ro_\tau$ increases from 0 to 30, the small-scale helicity has a larger negative value. With continued intensification of rotation, the small-scale helicity slightly decreases and the large-scale positive helicity completely diminishes. It means that the scale helicity changes its signs at lower wall-normal positions. In contrast, as $Re_\tau$ increases, the scale helicity slightly decreases.

Figure 7. Scale helicity distribution: (a) $\langle \delta h \rangle$ of ST30, and the pink filled region shows the error bar of $\langle \delta h \rangle$ in the buffer layer $x_2^+=10.5$; (b) $\langle \delta h \rangle$ in the buffer layer ($x_2^+=10.3$ for ST07R and ST15R, $x_2^+=10.0$ for ST07RR and $x_2^+=10.5$ for the other cases).

Similarly, the scale distribution of the pressure is defined as

(3.4)\begin{equation} \left\langle \delta p^2 \right\rangle ({X}_2,{r_1}) =\left\langle\partial_{r_1}( \delta p (\boldsymbol{X},{r_1}) \delta p (\boldsymbol{X},{r_1}))\right\rangle. \end{equation}

The decomposed scale pressures $\langle \delta p_R^2 \rangle$ and $\langle \delta p_T^2 \rangle$ are defined in the same way. Figure 8 displays the normalized scale pressure and its decomposition of ST30. As shown, $p_R$ has a larger streamwise length scale than $p$ and $p_T$, which can be inferred from the Poisson equation of the decomposed pressures (Yang et al. Reference Yang, Deng, Wang and Shen2018).

Figure 8. Scale distribution of the pressure and its decomposition of ST30 non-dimensionalized using the corresponding mean-square value in the buffer layer $x_2^+=10.5$. The grey filled region shows the error bar of $\langle \delta p^{2} \rangle /2/\langle p^{2} \rangle$.

3.2. DHGKE analysis

To analyse the interscale dynamics in channel turbulence, the GKE was used by Marati et al. (Reference Marati, Casciola and Piva2004) and Cimarelli et al. (Reference Cimarelli, De Angelis and Casciola2013, Reference Cimarelli, De Angelis, Schlatter, Brethouwer, Talamelli and Casciola2015, Reference Cimarelli, De Angelis, Jimenez and Casciola2016). In the present study, the interscale dynamics in the streamwise-rotating channel turbulence are investigated from the perspective of scale helicity through corresponding budgets, which is named as the differentiated generalized Kolmogorov equation for helicity (DHGKE) hereafter. Deduced from the N–S equation, with the assumption $\langle U_2 \rangle =\langle W_2 \rangle =0$, $\boldsymbol {\varOmega }=\varOmega \boldsymbol {e}_1$, DHGKE is written as

(3.5) \begin{align} \underbrace{\vphantom{\left\langle \frac{\partial^2}{\partial X_2^2}\right\rangle} \frac{\partial }{\partial r_1} \frac{\partial}{\partial t} \delta u_i \delta \omega_i }_{\varDelta_t} &= \underbrace{\vphantom{\left\langle \frac{\partial^2}{\partial X_2^2}\right\rangle} -\frac{\partial}{\partial r_1} \delta u_i \delta u_j \frac{\mathrm{d}{} \left\langle W_i^\ast \right\rangle}{\mathrm{d}{} X_j} -\frac{\partial}{\partial r_1} (\delta \omega_i\delta u_j-\delta u_i \delta \omega_j) \frac{\mathrm{d}{} \left\langle U_i^\ast \right\rangle}{\mathrm{d}{} X_j} }_{\varPi^{S}}\nonumber\\ &\quad\underbrace{\vphantom{\left\langle \frac{\partial^2}{\partial X_2^2}\right\rangle} -\frac{\partial}{\partial r_1}\frac{\partial }{\partial r_j}( \delta h \delta u_j ) +\frac{1}{2}\frac{\partial}{\partial r_1}\frac{\partial }{\partial r_j}( \delta \omega_j \delta u^2 ) }_{T^{SS}} \underbrace{\vphantom{\left\langle \frac{\partial^2}{\partial X_2^2}\right\rangle} -\frac{\partial}{\partial r_1}\frac{\partial }{\partial X_j}( u_j^\ast\delta h ) +\frac{1}{2}\frac{\partial}{\partial r_1}\frac{\partial }{\partial X_j}( \delta u^2 \omega_j^\ast ) }_{T^{SP}}\nonumber\\ &\quad \underbrace{\vphantom{\left\langle \frac{\partial^2}{\partial X_2^2}\right\rangle} -\frac{1}{\rho}\frac{\partial}{\partial r_1}\frac{\partial }{\partial X_j}( \delta \omega_j \delta p_T ) }_{G_T^{S}} \underbrace{\vphantom{\left\langle \frac{\partial^2}{\partial X_2^2}\right\rangle} -\frac{1}{\rho}\frac{\partial}{\partial r_1}\frac{\partial }{\partial X_j}( \delta \omega_j \delta p _R)}_{G_R^{S}} +\underbrace{\vphantom{\left\langle \frac{\partial^2}{\partial X_2^2}\right\rangle} 2\nu \frac{\partial}{\partial r_1}\frac{\partial^2 ( \delta h ) }{\partial r_j\partial r_j} }_{D^{SS}} +\underbrace{\vphantom{\left\langle \frac{\partial^2}{\partial X_2^2}\right\rangle}\frac{\nu}{2}\frac{\partial}{\partial r_1}\frac{\partial ^2 ( \delta h )}{\partial X_j \partial X_j} }_{D^{SP}}\nonumber\\ &\quad \underbrace{\vphantom{\frac{\partial}{\partial r_1}\left\langle \frac{\partial^2}{\partial X_2^2}\right\rangle}-4 \frac{\partial }{\partial r_1}\epsilon^{H\ast}}_{{-}E^S} +\underbrace{\vphantom{\frac{\partial}{\partial r_1}\left\langle \frac{\partial^2}{\partial X_2^2}\right\rangle} 2\varOmega \frac{\partial}{\partial r_1} \left(\delta \omega_2 \delta u_3 - \delta u_2 \delta \omega_3 +\delta u_k \delta \frac{\partial u_k}{\partial x_1}\right)}_{C^{S}}, \end{align}

where $\ast$ represents the average at the two positions $\boldsymbol {x}$ and $\boldsymbol {x'}$, $\varDelta _t$ is the time derivatives, $\varPi ^{S}$ is the production, $T^{SS}$ is the interscale turbulent convection, $T^{SP}$ is the spatial turbulent convection, $G_R^{S}$ and $G_T^{S}$ are the pressure transfer terms related to the rotation effects and turbulent convection, $D^{SS}$ is the interscale viscous diffusion, $D^{SP}$ is the spatial viscous diffusion, $E^{S}$ is the pseudo-dissipation, and $C^{S}$ is the Coriolis transfer term. Here, $G^{S} = G_T^{S} + G_R^{S}$ is the total pressure transfer term.

If averaging over the $x_1- x_3$ plane, using the relation $\partial /\partial X_1 \langle {\cdot } \rangle =\partial /\partial X_3 \langle {\cdot } \rangle =0$ and ${\partial }/{\partial t}=0$, DHGKE can be written as

(3.6) \begin{align} &\underbrace{\vphantom{\left\langle \frac{\partial^2}{\partial X_2^2}\right\rangle} -\frac{\partial}{\partial r_1}\left\langle \delta u_i \delta u_2 \right\rangle \frac{\mathrm{d}{} \left\langle W_i^\ast \right\rangle}{\mathrm{d}{} X_2} -\frac{\partial}{\partial r_1}\left\langle \delta \omega_i\delta u_2-\delta u_i \delta \omega_2 \right\rangle \frac{\mathrm{d}{} \left\langle U_i^\ast \right\rangle}{\mathrm{d}{} X_2} }_{\left\langle \varPi^{S}\right\rangle} \underbrace{\vphantom{\left\langle \frac{\partial^2}{\partial X_2^2}\right\rangle} -\frac{\partial}{\partial r_1}\frac{\partial }{\partial r_j}\left\langle \delta h \delta u_j \right\rangle +\frac{1}{2}\frac{\partial}{\partial r_1}\frac{\partial }{\partial r_j}\left\langle \delta \omega_j \delta u^2 \right\rangle }_{\left\langle T^{SS} \right\rangle }\nonumber\\ &\quad \underbrace{\vphantom{\left\langle \frac{\partial^2}{\partial X_2^2}\right\rangle} -\frac{\partial}{\partial r_1}\frac{\partial }{\partial X_2}\left\langle u_2^\ast\delta h \right\rangle +\frac{1}{2}\frac{\partial}{\partial r_1}\frac{\partial }{\partial X_2}\left\langle \delta u^2 \omega_2^\ast \right\rangle }_{\left\langle T^{SP} \right\rangle } \underbrace{\vphantom{\left\langle \frac{\partial^2}{\partial X_2^2}\right\rangle} -\frac{1}{\rho}\frac{\partial}{\partial r_1}\frac{\partial }{\partial X_2}\left\langle \delta \omega_2 \delta p_T \right\rangle }_{\left\langle G_T^{S} \right\rangle } \underbrace{\vphantom{\left\langle \frac{\partial^2}{\partial X_2^2}\right\rangle} -\frac{1}{\rho}\frac{\partial}{\partial r_1}\frac{\partial }{\partial X_2}\left\langle \delta \omega_2 \delta p _R\right\rangle}_{\left\langle G_R^{S} \right\rangle }\nonumber\\ &\quad +\underbrace{\vphantom{\left\langle \frac{\partial^2}{\partial X_2^2}\right\rangle} 2\nu \frac{\partial}{\partial r_1}\frac{\partial^2 \left\langle \delta h \right\rangle }{\partial r_j\partial r_j} }_{\left\langle D^{SS} \right\rangle } +\underbrace{\vphantom{\left\langle \frac{\partial^2}{\partial X_2^2}\right\rangle}\frac{\nu}{2}\frac{\partial}{\partial r_1}\frac{\partial ^2 \left\langle \delta h \right\rangle}{\partial X_2^2} }_{\left\langle D^{SP} \right\rangle } +\underbrace{\vphantom{\frac{\partial}{\partial r_1}\left\langle \frac{\partial^2}{\partial X_2^2}\right\rangle}2\varOmega\frac{\partial}{\partial r_1}\frac{\partial }{\partial X_2}\left\langle \delta u_2 \delta u_1 \right\rangle }_{\left\langle C^{S} \right\rangle }=0. \end{align}

Similar to the GKE results given by Marati et al. (Reference Marati, Casciola and Piva2004) and the limited behaviours in (3.3), when $r_1\rightarrow \infty$, there are also relations for the spatial and interscale transfer terms:

(3.7)\begin{equation} \left.\begin{gathered} \lim_{r_1\rightarrow\infty}\int_{0}^{r_1}\left\langle D^{SS} \right\rangle (X_2,l_1)\,\mathrm{d}l_1=\lim_{r_1\rightarrow\infty}\int_{0}^{r_1}\left\langle D^{SP} \right\rangle (X_2,l_1)\,\mathrm{d}l_1,\\ \lim_{r_1\rightarrow\infty}\int_{0}^{r_1}\left\langle T^{SS} \right\rangle (X_2,l_1)\,\mathrm{d}l_1=\lim_{r_1\rightarrow\infty}\int_{0}^{r_1}\left\langle T^{SP} \right\rangle (X_2,l_1)\,\mathrm{d}l_1. \end{gathered}\right\} \end{equation}

DHGKE results of ST07 and ST30 in the viscous sublayer ($x_2^+=3.5$) are shown in figures 9(a) and 9(b), respectively. As shown in figure 9(a), the pressure terms $\langle G^{S}_{R} \rangle$ and $\langle G^{S}_{T} \rangle$ are the main positive sources for the scale helicity. The interscale viscous diffusion $\langle D^{SS} \rangle$ transfers positive helicity from $r_1^+\sim 100$ to smaller scales ($r_1^+\sim 20$). In contrast, the spatial viscous diffusion $\langle D^{SP} \rangle$ is mainly negative and transfers positive scale helicity to higher wall-normal position. Consistent with the helicity budget in figure 4, the production $\langle \varPi ^{S}\rangle$ and the Coriolis term $\langle C^{S} \rangle$ are both negative here and restrain the scale helicity in the viscous sublayer. The spatial and interscale turbulent convections $\langle T^{SP} \rangle$ and $\langle T^{SS} \rangle$ are also negative. Generally, for energy transfer in streamwise-rotating channel turbulence (Yang & Wang Reference Yang and Wang2018), the pressure transfers are negligible. However, the pressure transfers are the main sources for the scale helicity here, while other terms except for $\langle D^{SS} \rangle$ suppress the development of the scale helicity. Figure 9(b) gives the DHGKE results of ST30. The amplitudes of all terms increase with rotation rates. Compared with other terms, the convection-induced pressure term $\langle G_T^{S} \rangle$ is strengthened. Additionally, the distribution of the interscale turbulent convection $\langle T^{SS} \rangle$ is completely changed. The term transfers positive helicity towards small scales. Relatively, $\langle D^{SS} \rangle$, $\langle D^{SP} \rangle$ and $\langle T^{SP} \rangle$ are weaker in ST30 than in ST07. It is because that $\langle C^{S} \rangle$ and $\langle G^{S}_R \rangle$ are defined to be proportional to the rotation rates, while the other turbulent processes are not.

Figure 9. DHGKE in the viscous sublayer ($x^+_2=3.5$): (a) ST07; (b) ST30.

Figure 10 shows the results in the buffer layer ($x^+_2=10.5$). For ST07, most terms have a similar distribution as those in the viscous sublayer. However, the spatial viscous diffusion $\langle D^{SP} \rangle$ is negligible in this layer. Here, $\langle T^{SS} \rangle$ is more important and transfers positive helicity towards smaller scales. Most importantly, the production term $\langle \varPi ^{S}\rangle$ is dominant in this layer and its peak locates on $r^+_1 \approx 30$. Notably, as shown in figure 7(b), the scale helicity in this layer is negative when $r^+_1 \lessapprox 100$ but positive when $r^+_1$ is larger, and its negative peaks also locate on $r_1^+\approx 30$. This implies that the production term is the main term inducing the sign change of the scale helicity. Similarly, $\langle T^{SP} \rangle$ is negative at small scales but positive at large scales, and could also be related to the scale discrepancy of the scale helicity distribution, even if its negative peak locates at a smaller scale ($r^+_1\approx 20$). Therefore, $\langle \varPi ^{S}\rangle$ and $\langle T^{SP} \rangle$ are the core effects of the mean flow and spatial turbulent convection on the small-scale negative helicity. In contrast, the interscale transfer terms $\langle D^{SS} \rangle$ and $\langle T^{SS} \rangle$ are positive at small scales but negative at large scales. These two terms cascade positive scale helicity to small scales and cancel the imbalance of chirality. The behaviours of $\langle T^{SS} \rangle$ are far different from the findings in homogeneous turbulence, where only the prevalence of a single chirality is considered (Mininni & Pouquet Reference Mininni and Pouquet2009, Reference Mininni and Pouquet2010; Mininni, Rosenberg & Pouquet Reference Mininni, Rosenberg and Pouquet2012; Hu, Li & Yu Reference Hu, Li and Yu2022b). DHGKE results of ST30 in figure 10(b) are more concise than those of ST07. Here, $\langle T^{SP} \rangle$, $\langle G^{S}_T \rangle$ and $\langle D^{SP} \rangle$ are negligible, while other terms have the same distribution as those of ST07. The results of ST30 highlight the effects of the mean flow gradients on the discrepancy between small- and large-scale helicity.

Figure 10. DHGKE in the buffer layer ($x^+_2=10.5$): (a) ST07; (b) ST30.

To further discuss the mechanisms related to the peak laws (2.4), figure 11(ad) shows the effects of $Re_\tau$ and $Ro_\tau$ on $\langle \varPi ^{S}\rangle$, $\langle T^{SS} \rangle$, $\langle G^{S}_R \rangle$ and $\langle C^S \rangle$, respectively, around the peaks ($x^+_2\approx 5.4$). As shown, the production $\langle \varPi ^S \rangle$, the Coriolis term $\langle C^S \rangle$ and corresponding pressure term $\langle G^{S}_R \rangle$ are remarkably proportional to the rotation rates, yet they remain unaffected by variations in the Reynolds number $Re_\tau$. In contrast, $Re_\tau$ has the opposing effects with $Ro_\tau$ on the interscale turbulent convection $\langle T^{SS} \rangle$. Specifically, at $r_1^+\sim 10$, $\langle T^{SS} \rangle$ exhibits a positive and amplified trend with the intensification of rotation, but becomes negative with increasing $Re_\tau$. When summing over $r_1^+$, the positive values at small scales induced by rotation are partially counteracted by the negative values at large scales, while $Re_\tau$ merely enhances the negative amplitudes of $\int \langle T^{SS} \rangle \,\mathrm {d}r_1$. This reveals the detailed opposing effects of $Re_\tau$ and $Ro_\tau$ on the peak laws (2.4) through the convection $\langle T^{SS} \rangle$ and rotation $\langle G^{S}_R \rangle +\langle C^S \rangle$.

Figure 11. (a) $\langle \varPi ^{S}\rangle$, (b) $\langle T^{SS} \rangle ^+$, (c) $\langle G^{S}_R \rangle ^+$ and (d) $\langle C^S \rangle ^+$ for different cases around the peak of the fluctuating helicity ($x_2^+=5.3$ for ST07R and ST15R, $x_2^+=5.4$ for the other cases).

The DHGKE results in the log-law layer ($x_2^+=80.0$) are shown in figure 12. As shown, even if 81 time slices with a time interval of $1$ $h/u_\tau$ have been used to evaluate the data, the quality of results obtained from ST07 remains relatively poor. Additional error estimations are given in Appendix A.2. Since the results of ST30 are quite similar to those of ST07, the details of ST30 are discussed at first. As shown in figure 12(b), in this layer, similar to the TKE budget equation and GKE, the production $\langle \varPi ^{S}\rangle$ is negligible, attributed to the gradients of mean velocities and vorticities. For the spatial effects, traditionally, in the log-law layer, the spatial energy transfers are also negligible (Marati et al. Reference Marati, Casciola and Piva2004). The physical process in the log-law layer is usually believed to be isolated from the spatial effects and is closely related to the turbulent dynamics in homogeneous turbulence. However, for the DHGKE here, the Coriolis term $\langle C^{S} \rangle$ and the rotation-induced pressure transfer term $\langle G^{S}_R \rangle$ are both spatial transfers. It concretely shows that the turbulent structures are strongly influenced by $\langle C^{S} \rangle$ and $\langle G^{S}_R \rangle$. The two effects exhibit opposing tendencies, akin to those observed in the Reynolds stress budget provided by Yang & Wang (Reference Yang and Wang2018). The positive $\langle C^{S} \rangle$ can be readily deduced from its spatial transfer property and the negative $\langle G^S_R \rangle$ can be inferred from the pressure Poisson equation (Kim Reference Kim1989). In the log-law layer, $\langle T^{SS} \rangle$ cascades negative scale helicity to small scales. Since the main spatial effects locate on the largest scale and the scale helicity is always negative at this location, the interscale dynamics of helicity in the log-law layer are consistent with those of homogeneous turbulence. Similar to $\langle C^{S} \rangle$, $\langle T^{SP} \rangle$ is positive and transfers positive helicity from this layer towards the wall. The results of ST07 are similar to those of ST30, while the term $\langle G^{S}_T \rangle$ is not negligible. Figure 13 shows the Reynolds and rotation number effects on $\langle G^S_R \rangle$ and $\langle C^S \rangle$ in the log-law layer. As shown, with increasing rotation rates, the two terms usually become larger. In contrast, as $Re_\tau$ increases, the amplitudes of the two terms in the log-law layer decrease significantly, which can be linked to the vortex angles discussed in § 4.

Figure 12. DHGKE in the log-law layer ($x^+_2=80.0$): (a) ST07; (b) ST30.

Figure 13. (a) $G^{S+}_R$ and (b) $C^{S+}$ for different cases in the log-law layer ($x_2^+=81.6$ for ST07R and ST15R, $x_2^+=80.3$ for ST07RR, $x_2^+=80.0$ for the other cases).

To further investigate the DHGKE results, the correlation factor for any two variables $\zeta$ and $\xi$ (Baj, Portela & Carter Reference Baj, Portela and Carter2022) is introduced:

(3.8)\begin{equation} \textrm{corr}(\zeta ,\xi )=\frac{\left\langle {\zeta \xi}\right\rangle-\left\langle {\zeta }\right\rangle\left\langle {\xi}\right\rangle}{\sqrt{\left\langle {\zeta^2}\right\rangle-\left\langle {\zeta}\right\rangle^2}\sqrt{\left\langle {\xi^2}\right\rangle-\left\langle {\xi}\right\rangle^2}}. \end{equation}

Figure 14 shows the correlation factor among the terms in the DHGKE of ST30 located at $x_2^+=3.5$ in figure 14(a), $x_2^+=10.5$ in figure 14(b,d) and $x_2^+=80.0$ in figure 14(c). Figure 14(ac) is of the scale $r_1^+=47.1$, and figure 14(d) is of the scale $r_1^+=164.9$. The comparison between figures 14(b) and 14(d) shows that the results of $r_1^+=47.12$ are similar to those of $r_1^+=164.9$. In the viscous sublayer (figure 14a) and the buffer layer (figure 14b), the time derivative $\varDelta _t$ is mainly proportional to the production $\varPi ^{S}$, which is dominant in this layer. Additionally, in the log-law layer, the spatial and interscale turbulent convections $T^{SP}$ and $T^{SS}$ are the dominant terms. The term $T^{SP}$ can be explained as the large-scale sweep effects (Baj et al. Reference Baj, Portela and Carter2022). In addition, in the viscous sublayer (figure 14a) and the buffer layer (figure 14b), $T^{SP}$ and $T^{SS}$ are anti-correlated. In contrast, in the buffer (figure 14b,d) and log-law layer (figure 14c), $D^{SS}$ and $D^{SP}$ are correlated. In Appendix C, the four effects are expanded in two-point correlation. The comparison between the expansions of $D^{SP}$ and $D^{SS}$ (or $T^{SP}$ and $T^{SS}$) indicates that the two terms have the same sub-terms but different signs for every sub-term. Taking $D^{SP}$ and $D^{SS}$ for example, the positive correlation between the two terms can be explained by the prevalence of sub-terms with identical signs compared with those with opposing signs. Specifically, the sub-term $2 ({\partial u_i}/{\partial x_j}) ({\partial \omega _i'}/{\partial x_j'})+2 ({\partial u_i'}/{\partial x_j'}) ({\partial \omega _i}/{\partial x_j})$ have opposing signs in the expansion of $D^{SP}$ and $D^{SS}$, and could be related to the two-point correlation of the pesudo-dissipation. The strong positive correlation between $D^{SP}$ and $D^{SS}$ above the buffer layer means the two-point correlation of the pesudo-dissipation is negligible compared with other sub-terms. Additionally, the anti-correlations between the Coriolis term $C^{S}$ and corresponding pressure term $G^{S}_R$ are also confirmed (Kim Reference Kim1989; Yang et al. Reference Yang, Deng, Wang and Shen2018). Here, $C^{S}$ is also correlated with the production term $\varPi ^{S}$, owing to the fact that, on average, $C^{S}$ can be represented by the Reynolds stress $\delta u_1\delta u_2$ (2.6a,b), which also presents in $\varPi ^{S}$.

Figure 14. Correlation factor of all terms in the DHGKE in the (a) viscous sublayer ($x_2^+=3.5$), (b,d) buffer layer ($x_2^+=10.5$) and (c) log-law layer ($x_2^+=80.0$). Panels (ac) present the results with the scale $r_1^+=47.1$ and panel (d) presents the results with the scale $r_1^+=164.9$.

In conclusion, different from the scale energy dynamics, the two main effects for the scale helicity balance are the Coriolis term and corresponding pressure term. Therefore, helicity could directly reflect the effects of rotation. In the viscous sublayer, another main effect is the interscale viscous diffusion of the scale helicity towards small scales. In the buffer layer, the production and the spatial turbulent convection lead to the scale discrepancy of the scale helicity. The interscale turbulent convection reduces the discrepancy between small- and large-scale helicity. Further studies around the peaks of helicity shows that the opposing effects of $Re_\tau$ and $Ro_\tau$ are mainly related to the turbulent convection and rotation effects (Coriolis term and corresponding pressure term), respectively. In the log-law layer, the negative scale helicity is found at all scales. The interscale turbulent convection has opposite sign with that in the buffer layer and cascades negative helicity towards small scales. Finally, using the correlation analysis, the large-scale sweep effects (Baj et al. Reference Baj, Portela and Carter2022) and other basic results are confirmed. The consistency of the spatial and interscale effects are found and explained by the prevalence of different sub-terms in two-point correlation expansions.

4. Vortex structures

Vortex is an important topic in fluid dynamics. The streaks, streamwise vortices and hairpin vortices in the non-rotating channel turbulence have been studied by various researchers (Jiménez & Pinelli Reference Jiménez and Pinelli1999; Wang, Huang & Xu Reference Wang, Huang and Xu2015). In streamwise-rotating channel turbulence, previous studies mainly cared about the large-scale TG vortices (Yang & Wang Reference Yang and Wang2018; Yan et al. Reference Yan, Li and Yu2022) and the inclined structures (Dai et al. Reference Dai, Huang and Xu2019; Hu et al. Reference Hu, Li and Yu2023). In this study, the vortices are examined from a relatively microscopic perspective.

Figure 15 shows typical vortices in ST30 extracted through the $Q$ criterion ($Q>400$). On the vortices, the overall helicity $h$, the streamwise helicity $h_1$, the streamwise vorticity $\omega _1$ and the rotation-induced pressure $p_R$ are shown in panels (ad), respectively. As shown in figure 15(a), the vortices are almost streamwise, while no typical hairpin vortex is found. In addition, the comparison of the four panels shows that in contrast to $h$, the other three quantities, including $h_1$, exhibit stronger correlations with the vortices filtered by the $Q$ criterion. It could mainly be attributed to two reasons. On one hand, the vortices are predominantly aligned in the streamwise direction. Therefore, the streamwise components $h_1$ and $\omega _1$, along with the streamwise rotation-induced pressure $p_R$, are expected to exhibit a stronger coherence with these vortices. On the other hand, vorticity and vortex are different, especially in viscous flows with strong shear (Moin, Leonard & Kim Reference Moin, Leonard and Kim1986; Charkrit, Shrestha & Liu Reference Charkrit, Shrestha and Liu2020). Given that the helicity is defined based on the local relationship between vorticity and velocity, it follows naturally that the overall helicity is not well distributed on the surface of the vortices. In fact, the helicity can better reflect the vortex dynamics in the log-law layer. Additionally, in near-wall dynamics under the buffer layer, as discussed earlier, helicity still elucidates some crucial processes from the perspectives of chirality and could be correlated with the streaks, which will be further explored in the following discussion.

Figure 15. Distribution of quantities on typical vortices in ST30 drawn with $Q>400$. The slices show the distribution of the quantities at $x_1^+=2147.4$. (a) Fluctuating helicity $h^+$. (b) Streamwise fluctuating helicity $h_1^+$. (c) Streamwise fluctuating vorticity $\omega _1^+$. (d) Rotation-induced pressure $p_R^+$.

To quantitatively identify the rotation effects on the vortices, two angles are used in the following analysis. In the buffer layer where turbulence is generated by strain, the streaks rise to form the streamwise vortices. Therefore, the lift angles of the streak are considered here. The streaks are first extracted through the condition $u_1^+<0$, and then the lift angle $\theta _l$ for every streak is evaluated as (Schoppa & Hussain Reference Schoppa and Hussain2002)

(4.1)\begin{equation} \theta_l=\tan^{{-}1}\left|\frac{\partial u_1/\partial x_3}{\mathrm{d} \left\langle U_1 \right\rangle /\mathrm{d}\kern 0.06em x_2}\right|_{\max}. \end{equation}

Figure 16(a) shows the fluctuating velocity $u_1^+$ on the slice $x_2^+=20.0$, with the blue contour depicting the distribution of streaks. The streaks extracted by $u^+_1<-2$ are displayed in figure 16(b), together with the contour of $\delta h$ with $r_1^+=47.1$. As shown, $\delta h$ is primarily concentrated in the vicinity of the streaks, indicating a strong relationship between the streaks and $\delta h$ within this layer. The lift angle $\theta _l$ is then compared with the cross-section of two streaks in figure 16(c). As $x_2^+$ increases, the streaks gradually roll up to form streamwise vortices in the rotating channel and the lift angles increase from zero towards higher values. The angles $33^\circ$ and $72^\circ$ marked in this figure are the peak values of the probability density function (p.d.f.) of $\theta _l$ in ST30 at $x_2^+=10.5$ and $20.0$, respectively. The p.d.f. of $\theta _l$ is shown in figures 16(c) and 16(d), where panel (c) gives the p.d.f. at $x_2^+=10.5$ and panel (d) gives the p.d.f. at $x_2^+=20.0$. The rotation effects are more apparent at $x_2^+=10.5$. As rotation intensifies, the lift angle distributes in a wider range. Generally, rotation enhances the extraction of energy and helicity from the mean fields. As $Re_\tau$ increases, the rotation effects diminish, consistent with the earlier discussions.

Figure 16. Streaks and their lift angles of ST30. (a) Contour of $u_1^+$ at $x_2^+=20.0$. The grey transparent structures are obtained using the $Q$ criterion $Q>400$. (b) Distribution of $\delta h^+$ at $x_2^+=20.0$ with $r_1^+=47.1$. The black solid lines are the isolines of $u_1^+=-2$. (c) Contour of $U_1^+$ at $x_1^+=2757.6$. The black solid line shows the isoline of $U^+_1=9.0$. (d,e) P.d.f. of the streak lift angles $\theta _l$ at $x_2^+=10.5$ and $x_2^+=20.0$, respectively. The pink filled region in panel (e,f) shows the error bars of the p.d.f. of ST30.

In non-rotating channel turbulence, one of the main flow structures is the hairpin vortex, which rises from the streaks in the buffer layer. Within the log-law layer, the hairpin vortex sweeps down and then breaks into various small-scale structures. The instability of the spanwise component of the hairpin vortex plays important roles in the sweep events (Jiménez & Pinelli Reference Jiménez and Pinelli1999; Adrian Reference Adrian2007). To quantitatively evaluate the rotation effects on the spanwise vortices in the log-law layer, an angle can be defined through the vorticity:

(4.2)\begin{equation} \theta_{\omega}=\tan^{{-}1} \left| \omega_3/\omega_1\right|_{Q>50}. \end{equation}

When $\theta _{\omega }=0^\circ$, the vortex is fully streamwise, whereas when $\theta _{\omega }=90^\circ$, the vortex is fully spanwise. The condition of $Q>50$ is used to get more stable statistics and gives the same qualitative conclusions with $Q>400$. Figure 17(a,b) compares the vortices of ST07 and ST30 in the log-law layer. As shown, the vortices of ST07 are almost streamwise under $x_2^+<110$ but spanwise at higher layers. In comparison, the vortices of ST30 are almost streamwise with a slightly tilted angle. As shown in figure 17(c), ST00 and ST07 have similar p.d.f. distributions. However, as rotation intensifies, the streamwise vortices are strengthened and the spanwise vortices almost diminish when $Ro_\tau =60$. The suppression of the spanwise vortices by rotation reduces the frequency of sweep events and constrains the energy cascades towards small scales (Hu et al. Reference Hu, Li and Yu2023). It thus strengthens the TKE in the log-law layer, especially $\langle u_2^2 \rangle$ and $\langle u_3^2 \rangle$ related to the streamwise vorticity $\omega _1$, consistent with the Reynolds stress budget discussed by Yang & Wang (Reference Yang and Wang2018). In contrast, as $Re_\tau$ increases, the vortex angles strongly decrease. The opposing effects of $Re_\tau$ and $Ro_\tau$ are consistent with the DHGKE results (figure 13).

Figure 17. Vortices in the log-law layer and the p.d.f. of the vortex angle $\theta _\omega$. (a,b) Vortices in the log-law layer ($x_2^+ \in [40.0, 180.0]$) coloured by $x_2^+$ with $Q>50$ of ST07 and ST30, respectively. (c) P.d.f of vortex angles $\theta _{\omega }$ at $x_2^+=80.0$ and the pink filled region shows the error bar of the p.d.f. of ST30.

5. Conclusions

Channel turbulence with streamwise rotation is a typical case of helicity in conjunction with boundary effects. As another inviscid invariant in addition to energy, helicity is a quantitative representation of vortex topology. In this paper, we have investigated the detail of helicity and vortex structures in streamwise-rotating channel turbulence.

First, we give the basic statistics about helicity. The mean helicity and fluctuating helicity are both positive under the buffer layer but negative in the log-law layer. The streamwise component is nearly antisymmetry with the spanwise component in the viscous sublayer, which is the near-wall behaviour of these helicity components. As $Re_\tau /Ro_\tau$ decreases, the peak of the fluctuating helicity shifts towards the wall. This suggests the rotation effects could penetrate deeper regions within the boundary layer and have potential impacts in accelerating the turbulent transition. Second, for the helicity budget, we find that the pressure term transfers positive helicity from the channel centre towards the wall and is the main source of the helicity. The Coriolis force and the production mainly restrain the helicity. The opposing effects of $Re_\tau$ and $Ro_\tau$ can be related to the competitive mechanisms between turbulent convections and rotation effects (Coriolis term and corresponding pressure term). Then, the near-wall behaviours of the helicity budget are derived and verified.

The multiscale behaviours of the helicity are then discussed using the differentiated generalized Kolmogorov equation. Through the scale helicity distribution, we find that the sign change of the scale helicity first happens at small scales and then expands to large scales. Especially, in the buffer layer, the scale helicity is negative at small scales but positive at large scales. Different from the energy, helicity is directly affected by the Coriolis effects and the pressure transfers. As rotation intensifies, the two effects become more important. In the buffer layer, the production and the spatial turbulent convection reach their extremes at small scales, aligning with the distribution of the scale helicity. This suggests a strong relationship between the two terms and the sign change of the scale helicity. The interscale turbulent convection cascades scale helicity among scales, and diminish the negative helicity at small scales and the positive helicity at large scales at the same time. Then, the main effects around the helicity peaks are evaluated. It is confirmed that the interscale turbulent convection is strongly affected by $Re_\tau$, while other key terms are mainly affected by $Ro_\tau$. In the log-law layer, different from the terms in scale energy balance, the spatial transfers induced by rotation play important roles in budget for the scale helicity. Then, the correlation analysis is performed for the DHGKE budget. The large-scale sweep effects (Baj et al. Reference Baj, Portela and Carter2022) and other basic results are confirmed. Additionally, the relations between the spatial and interscale effects are found and explained by the expansions in two-point correlation.

To investigate the physical meaning of the helicity, we study the vortex structures based on the Q criterion. We find that helicity is not well distributed on the surface of vortices. It is due to the discrepancy between vorticity and vortex induced by strong shear stresses. However, helicity could still illustrate some key processes from the perspectives of chirality and be related to streaks. As rotation intensifies or the Reynolds numbers decreases, the streak lift angles have wider ranges, indicating stronger turbulence generation. It is consistent with the tendencies of the peak laws under the buffer layer. In the log-law layer, in non-rotating channel turbulence, the spanwise vortices are closely related to the sweep events and the interscale cascades. Rotation suppresses the spanwise vortices in the log-law layer and thus inhibits the breaking of coherent structures and the forward cascades. The opposing effects of $Re_\tau$ and $Ro_\tau$ are also found here, and could be linked to the competitive effects of the turbulent convections and rotation effects.

In this paper, we discuss the spatial and interscale dynamics in streamwise-rotating channel turbulence. The opposing effects of $Re_\tau$ and $Ro_\tau$, the interscale dynamics of the scale helicity, and the relation between the helicity and vortices are investigated in detail. Helicity in fact plays as an important quantity in the turbulent channel flow with streamwise rotation. In the future, helicity is expected to be investigated in more asymmetrical turbulent flows and applied for further turbulent modelling.

Funding

This work was supported by the National Key Research and Development Program of China (grant nos. 2020YFA0711800 and 2019YFA0405300) and NSFC Projects (grant nos. 12072349, 12232018, 91852203 and 12202457).

Declaration of interests

The authors report no conflict of interest.

Appendix A. Basic statistics and error estimations

A.1. Basic statistics

Figure 18(a,b) shows the profiles of mean velocities $\langle U_1^+ \rangle$ and $\langle U_3^+ \rangle$, respectively. With increasing rotation rates, $\langle U_1^+ \rangle$ is suppressed, while $\langle U_3^+ \rangle$ is enhanced. As $Re_\tau$ intensifies, $\langle U_1^+ \rangle$ and $\langle U_3^+ \rangle$ both slightly increase. Figure 19(a,b) shows the profiles of mean vorticities $\langle W_1^+ \rangle$ and $\langle W_3^+ \rangle$, respectively. The amplitudes of $\langle W_1^+ \rangle$ are increased by rotation but not affected by $Re_\tau$. In contrast, $\langle W_3^+ \rangle$ only slightly affected by strong rotation $Ro_\tau >30$.

Figure 18. Profile of mean velocity: (a) $\langle U_1 \rangle ^+$; (b) $\langle U_3 \rangle ^+$.

Figure 19. Profile of mean vorticity: (a) $\langle W_1 \rangle ^+$; (b) $\langle W_3 \rangle ^+$.

A.2. Error estimations

To estimate the error of the main statistics, the error bars are introduced by calculating the standard deviation (S.D.). For any dataset $\{x_i\}$, S.D. is defined as

(A1)\begin{equation} S.D.=\sqrt{\frac{1}{n-1}\sum(x_i-\bar{x})^2}, \end{equation}

where $\bar {x}$ is the mean value of the dataset $\{x_i\}$ and $n$ is the number of the data in the dataset.

Figure 20 gives error bar details of the mean helicity $H^+$ shown in figure 1(b). The error is indistinguishable compared with the mean value. Similar error bars have been shown for the fluctuating helicity (figure 2b), scale helicity (figure 7a), scale pressure (figure 8), streak lift angles (figure 16d,e) and vortex angles (figure 17c).

Figure 20. (a) Decomposed helicity $H_i^+$ of ST30 and the grey filled region shows the error bar of $H^+$. (b) Details about the error bars.

The error bars of the fluctuating helicity budget and DHGKE are not shown in the main contents, and the quality of the dataset can partially be verified by the balance of the budget (the term ‘sum’). For completeness, the error bar of the poorest quality statistics (DHGKE balance in the log-law layer in figure 12) are given in figure 21. Specifically, we show the error bar of the terms sum and $T^{SS+}$ in the log-law layer of (a) ST07 with 81 slices, (b) ST30 with 41 slices, (c) ST07 with 41 slices and (d) ST07 of only one time slice. The results of ST30 in figure 21(b) are of high quality, even with only 41 time slices. In contrast, the results of ST07 in figure 21(a) have apparently wider error bars, even with 81 time slices. This difference may be attributed to the fact that in the log-law layer, the helicity distribution in ST30 is stronger than that in ST07. The comparison between figures 21(a) and 21(c) shows the effects of the time slice numbers on the error bar. The width of the error bar is almost unaffected by the time slice numbers. However, compared with the results with 81 slices (figure 21a), if only 41 slices (figure 21c) are used, the mean values of the term sum deviate more apparently from zero. It can be inferred that 161 slices of data will not have an apparent influence on the error bar. In fact, for a sufficiently large dataset, the S.D. is independent of the data size. For example, the S.D. of evenly distributed random numbers between 0 and 1 is $1/2\sqrt {3}$ and is independent of the data size. Figure 21(d) shows the result of only one time slice. It has larger variances, which directly affect the error bars in figures 21(a) and 21(c).

Figure 21. Error bars of DHGKE in the log-law layer of (a) ST07 with 81 slices, (b) ST30 with 41 slices, (c) ST07 with 41 slices and (d) ST07 of only one time slice.

Appendix B. Near-wall behaviours of the helicity budget

According to the symmetry, the fluctuating velocities in the vicinity of the wall are estimated as (Kim, Moin & Moser Reference Kim, Moin and Moser1987)

(B1)\begin{equation} \left.\begin{gathered} u_1\sim x_2,\quad u_2\sim x_2^{2},\quad u_3\sim x_2,\\ \omega_1\sim 1,\quad\omega_2\sim x_2,\quad \omega_3\sim 1. \end{gathered}\right\} \end{equation}

The mean velocity can be estimated as

(B2)\begin{equation} \left.\begin{gathered} \left\langle U_1 \right\rangle\sim x_2, \quad\left\langle U_2 \right\rangle=0, \quad\left\langle U_3 \right\rangle\sim x_2,\\ \left\langle W_1 \right\rangle\sim 1,\quad\left\langle W_2 \right\rangle\sim x_2, \quad\left\langle W_3 \right\rangle\sim 1. \end{gathered}\right\} \end{equation}

B.1. The balance in the vicinity of the wall

We then expand the helicity budget based on these relations.

The production is

(B3)\begin{align} \left\langle\varPi\right\rangle&={-}\frac{\mathrm{d} \left\langle u_2 u_3 \right\rangle }{\mathrm{d}\kern 0.06em x_2} \frac{\mathrm{d} \left\langle U_1 \right\rangle }{\mathrm{d}\kern 0.06em x_2} +\frac{\mathrm{d} \left\langle u_1 u_2 \right\rangle }{\mathrm{d}\kern 0.06em x_2} \frac{\mathrm{d} \left\langle U_3 \right\rangle }{\mathrm{d}\kern 0.06em x_2} -\left\langle u_iu_2 \right\rangle \frac{\mathrm{d} \left\langle W_i \right\rangle}{\mathrm{d}\kern 0.06em x_2} \nonumber\\ &\sim{-}\frac{\mathrm{d} \left\langle u_2 u_3 \right\rangle }{\mathrm{d}\kern 0.06em x_2} \frac{\mathrm{d} \left\langle U_1 \right\rangle }{\mathrm{d}\kern 0.06em x_2} +\frac{\mathrm{d} \left\langle u_1 u_2 \right\rangle }{\mathrm{d}\kern 0.06em x_2} \frac{\mathrm{d} \left\langle U_3 \right\rangle }{\mathrm{d}\kern 0.06em x_2}\nonumber\\ &\sim x_2^2. \end{align}

The turbulent convection is

(B4)\begin{align} \left\langle T\right\rangle &=\frac{\mathrm{d} \left\langle hu_2 \right\rangle}{\mathrm{d}\kern 0.06em x_2} -\frac{1}{2}\frac{\mathrm{d} }{\mathrm{d}\kern 0.06em x_2}\left\langle u_iu_i\omega_2 \right\rangle \nonumber\\ &\sim \frac{\mathrm{d} }{\mathrm{d}\kern 0.06em x_2}\left\langle (u_1\omega_1+u_3\omega_3) u_2 \right\rangle -\frac{1}{2}\frac{\mathrm{d} }{\mathrm{d}\kern 0.06em x_2}\left\langle (u_1u_1+u_3u_3)\omega_2 \right\rangle \nonumber\\ &\sim x_2^2. \end{align}

The Coriolis term is

(B5)\begin{equation} C=2\frac{\mathrm{d} \left\langle u_1 u_2 \right\rangle }{\mathrm{d}\kern 0.06em x_2}\varOmega \sim x_2^2. \end{equation}

The viscous diffusion is

(B6)\begin{equation} D=\nu\frac{\mathrm{d}^2 \left\langle h \right\rangle}{\mathrm{d}\kern 0.06em x_2^2} \sim\nu\frac{\mathrm{d} ^2 }{\mathrm{d}\kern 0.06em x_2^2}\left\langle u_1\omega_1+u_3\omega_3 \right\rangle \sim 1. \end{equation}

The pseudo-dissipation is

(B7)\begin{align} -E&={-}2\nu \left\langle \frac{\partial u_i}{\partial x_j}\frac{\partial \omega_i}{\partial x_j} \right\rangle \nonumber\\ &\sim{-}2\nu \left\langle \frac{\partial u_1}{\partial x_2}\frac{\partial \omega_1}{\partial x_2}+\frac{\partial u_3}{\partial x_2}\frac{\partial \omega_3}{\partial x_2} \right\rangle \sim 1. \end{align}

The pressure transport is

(B8)\begin{equation} G={-}\frac{1}{\rho}\frac{\mathrm{d} \left\langle \omega_2 p\right\rangle }{\mathrm{d}\kern 0.06em x_2} \sim{-}\frac{1}{\rho}\left\langle p\frac{\partial \omega_2 }{\partial x_2} \right\rangle \sim 1, \end{equation}

where we use that $p\sim 1$, because the root-mean-square of pressure on the wall is non-zero (Yang et al. Reference Yang, Deng, Wang and Shen2018).

B.2. The balance on the wall

The viscous diffusion on the wall is

(B9)\begin{align} \left.D\right|_{x_2={\pm} h}&=\left.\nu\frac{\mathrm{d} ^2 \left\langle h \right\rangle}{\mathrm{d}\kern 0.06em x_2^2} \right|_{x_2={\pm} h} =\left.\nu\frac{\mathrm{d} ^2 }{\mathrm{d}\kern 0.06em x_2^2}\left\langle u_1\omega_1+u_2\omega_2+u_3\omega_3 \right\rangle \right|_{x_2={\pm} h}\nonumber\\ &=\left.\nu\frac{\mathrm{d} ^2 }{\mathrm{d}\kern 0.06em x_2^2}\left\langle u_1\omega_1+u_3\omega_3 \right\rangle \right|_{x_2={\pm} h}\nonumber\\ &=\left.\nu\frac{\mathrm{d} ^2 }{\mathrm{d}\kern 0.06em x_2^2}\left\langle u_1\left(\frac{\partial u_3}{\partial x_2}-\frac{\partial u_2}{\partial x_3}\right)+u_3\left(\frac{\partial u_2}{\partial x_1}-\frac{\partial u_1}{\partial x_2}\right) \right\rangle \right|_{x_2={\pm} h}\nonumber\\ &=\left.\nu\frac{\mathrm{d} ^2 }{\mathrm{d}\kern 0.06em x_2^2}\left\langle u_1\frac{\partial u_3}{\partial x_2}-u_3\frac{\partial u_1}{\partial x_2} \right\rangle \right|_{x_2={\pm} h}\nonumber\\ &=\nu\left\langle \left(\frac{\partial^2 u_1}{\partial x_2^2}\frac{\partial u_3}{\partial x_2}+\frac{\partial u_1 }{\partial x_2}\frac{\partial^2 u_3}{\partial x_2^2} +\frac{\partial u_1}{\partial x_2}\frac{\partial^2 u_3}{\partial x_2^2}+u_1\frac{\partial^3 u_3}{\partial x_2^3} \right)\right.\nonumber\\ &\quad\left.\left.-\left(\frac{\partial u_1}{\partial x_2}\frac{\partial^2 u_3}{\partial^2 x_2}+\frac{\partial^2 u_1}{\partial x_2^2}\frac{\partial u_3}{\partial x_2}+\frac{\partial^2 u_1}{\partial x_2^2}\frac{\partial u_3}{\partial x_2}+\frac{\partial^3 u_1}{\partial x_2^3}u_3\right)\right\rangle\right|_{x_2={\pm} h}\nonumber\\ &=\nu\left.\left\langle \frac{\partial u_1}{\partial x_2}\frac{\partial^2 u_3}{\partial x_2^2} -\frac{\partial^2 u_1}{\partial x_2^2}\frac{\partial u_3}{\partial x_2}\right\rangle\right|_{x_2={\pm} h}, \end{align}

where

(B10)\begin{align} \frac{\partial ^2 }{\partial x_2^2}\left(u_1\frac{\partial u_3}{\partial x_2}\right) &=\frac{\partial }{\partial x_2}\left( \frac{\partial u_1}{\partial x_2}\frac{\partial u_3}{\partial x_2}+u_1\frac{\partial^2 u_3}{\partial x_2^2} \right)\nonumber\\ &= \frac{\partial^2 u_1}{\partial x_2^2}\frac{\partial u_3}{\partial x_2}+\frac{\partial u_1 }{\partial x_2}\frac{\partial^2 u_3}{\partial x_2^2} +\frac{\partial u_1}{\partial x_2}\frac{\partial^2 u_3}{\partial x_2^2}+u_1\frac{\partial^3 u_3}{\partial x_2^3} \end{align}

and

(B11)\begin{align} \frac{\partial ^2 }{\partial x_2^2}\left(u_3\frac{\partial u_1}{\partial x_2}\right) &=\frac{\partial }{\partial x_2}\left(\frac{\partial u_3}{\partial x_2}\frac{\partial u_1}{\partial x_2}+u_3\frac{\partial^2 u_1}{\partial x_2^2}\right)\nonumber\\ &=\frac{\partial^2 u_3}{\partial^2 x_2}\frac{\partial u_1}{\partial x_2}+\frac{\partial u_3}{\partial x_2}\frac{\partial^2 u_1}{\partial x_2^2}+\frac{\partial u_3}{\partial x_2}\frac{\partial^2 u_1}{\partial x_2^2}+u_3\frac{\partial^3 u_1}{\partial x_2^3}. \end{align}

The pseudo-dissipation on the wall is

(B12)\begin{align} \left.-E\right|_{x_2={\pm} h}&={-}2\nu \left. \left\langle \frac{\partial u_i}{\partial x_j}\frac{\partial \omega_i}{\partial x_j} \right\rangle \right|_{x_2={\pm} h} ={-}2\nu \left. \left\langle \frac{\partial u_i}{\partial x_2}\frac{\partial \omega_i}{\partial x_2} \right\rangle \right|_{x_2={\pm} h}\nonumber\\ &={-}2\nu\left. \left\langle \frac{\partial u_1}{\partial x_2}\left(\frac{\partial^2 u_3}{\partial x_2^2}-\frac{\partial^2 u_2}{\partial x_2\partial x_3}\right) +\frac{\partial u_3}{\partial x_2}\left(\frac{\partial^2 u_2}{\partial x_1\partial x_2}-\frac{\partial^2 u_1}{\partial x_2^2}\right) \right\rangle \right|_{x_2={\pm} h}\nonumber\\ &={-}2\nu\left. \left\langle \frac{\partial u_1}{\partial x_2}\frac{\partial^2 u_3}{\partial x_2^2} -\frac{\partial u_3}{\partial x_2}\frac{\partial^2 u_1}{\partial x_2^2} \right\rangle \right|_{x_2={\pm} h}. \end{align}

Except for the pressure term and the viscous effects, all other terms are zeros on the wall. Therefore,

(B13)\begin{equation} G|_{x_2={\pm} h}=D|_{x_2={\pm} h}= \tfrac{1}{2}E|_{x_2={\pm} h}. \end{equation}

Appendix C. Expansion by two-point correlations of turbulent convection and viscous diffusion

The interscale turbulent helicity transfer:

(C1) \begin{align} T^{H,SS}&={-}\frac{\partial }{\partial r_1}\frac{\partial }{\partial r_j}\left( \delta h \delta u_j \right) +\frac{\partial }{\partial r_1}\frac{1}{2}\frac{\partial }{\partial r_j}\left( \delta \omega_j \delta u^2 \right) \nonumber\\ &=\frac{1}{2}\frac{\partial }{\partial r_1}\left[ \frac{\partial{}}{\partial{x_j}} \left({-}u_i\omega_iu_j+\frac{1}{2} u_iu_i\omega_j \right) + \omega_i'\frac{\partial{}}{\partial{x_j}} u_iu_j + u_i'\frac{\partial{}}{\partial{x_j}} (\omega_iu_j-u_i\omega_j) \right.\nonumber\\ &\quad + u_j'\frac{\partial{}}{\partial{x_j}} u_i\omega_i -\frac{1}{2} \omega_j'\frac{\partial{}}{\partial{x_j}} u_iu_i - u_i'u_j'\frac{\partial{}}{\partial{x_j}} \omega_i - u_i'\omega_i'\frac{\partial{}}{\partial{x_j}} u_j\nonumber\\ &\quad\left. +\,\, (u_i'\omega_j'-\omega_i'u_j')\frac{\partial{}}{\partial{x_j}} u_i +\frac{1}{2} u_i'u_i'\frac{\partial{}}{\partial{x_j}} \omega_j +S.P.\right], \end{align}

where $S.P.$ represents the symmetry part. For instance, $S.P.$ of $-\langle \omega _i'u_j'{\partial {u_i}}/{\partial {x_j}} \rangle$ is $-\langle \omega _iu_j{\partial {u_i'}}/{\partial {x_j}'} \rangle$.

The spatial turbulent helicity transfer:

(C2)\begin{align} T^{H,SP}&=\frac{\partial }{\partial r_1}\left[ -\frac{\partial }{\partial X_j}\left( u_j^\ast\delta h \right) +\frac{1}{2}\frac{\partial }{\partial X_j}\left( \delta u^2 \omega_j^\ast\right)\right]\nonumber\\ &=\frac{1}{2}\frac{\partial }{\partial r_1}\left[ \frac{\partial{}}{\partial{x_j}} \left({-}u_i\omega_iu_j+\frac{{1}}{{2}}u_iu_i\omega_j\right) + \omega_i'\frac{\partial{}}{\partial{x_j}} u_iu_j + u_i'\frac{\partial{}}{\partial{x_j}} (\omega_iu_j-u_i\omega_j)\right.\nonumber\\ &\quad - u_j'\frac{\partial{}}{\partial{x_j}} u_i\omega_i+\frac{1}{2} \omega_j'\frac{\partial{}}{\partial{x_j}} u_iu_i + u_i'u_j'\frac{\partial{}}{\partial{x_j}} \omega_i - u_i'\omega_i'\frac{\partial{}}{\partial{x_j}} u_j\nonumber\\ &\quad \left. -\, ( u_i'\omega_j'-\omega_i'u_j')\frac{\partial{}}{\partial{x_j}} u_i +\frac{1}{2} u_i'u_i'\frac{\partial{}}{\partial{x_j}} \omega_j +S.P.\right]. \end{align}

The interscale viscous diffusion:

(C3)\begin{align} D^{SS} &=2\nu \frac{\partial }{\partial r_1}\frac{\partial^2{ \delta h }}{\partial{}r_j\partial{}r_j} \nonumber\\ &=\frac{\nu}{2}\frac{\partial }{\partial r_1}\left[\frac{\partial ^2 u_i\omega_i }{\partial x_j\partial x_j} - \omega_i'\frac{\partial ^2 u_i }{\partial x_j\partial x_j} - u_i'\frac{\partial ^2 \omega_i }{\partial x_j\partial x_j} +2 \frac{\partial u_i}{\partial x_j} \frac{\partial \omega_i'}{\partial x_j'} +S.P.\right]. \end{align}

The spatial viscous diffusion:

(C4)\begin{align} D^{SP} &=\frac{\nu}{2} \frac{\partial }{\partial r_1}\frac{\partial^2{ \delta h }}{\partial{}X_j \partial{}X_j} \nonumber\\ &=\frac{\nu}{2}\frac{\partial }{\partial r_1}\left[\frac{\partial ^2 u_i\omega_i }{\partial x_j\partial x_j} - \omega_i'\frac{\partial ^2 u_i }{\partial x_j\partial x_j} - u_i'\frac{\partial ^2 \omega_i }{\partial x_j\partial x_j} -2 \frac{\partial u_i}{\partial x_j} \frac{\partial \omega_i'}{\partial x_j'} +S.P.\right]. \end{align}

References

Adrian, R.J. 2007 Hairpin vortex organization in wall turbulence. Phys. Fluids 19 (4), 041301.Google Scholar
Alexakis, A. & Biferale, L. 2018 Cascades and transitions in turbulent flows. Phys. Rep. 767–769, 1101.Google Scholar
Baj, P., Portela, F.A. & Carter, D.W. 2022 On the simultaneous cascades of energy, helicity, and enstrophy in incompressible homogeneous turbulence. J. Fluid Mech. 952, A20.Google Scholar
Biferale, L., Boffetta, G., Celani, A., Lanotte, A., Toschi, F. & Vergassola, M. 2003 The decay of homogeneous anisotropic turbulence. Phys. Fluids 15 (8), 21052112.CrossRefGoogle Scholar
Brissaud, A., Frisch, U., Leorat, J., Lesieur, M. & Mazure, A. 1973 Helicity cascades in fully developed isotropic turbulence. Phys. Fluids 16 (8), 13661367.Google Scholar
Charkrit, S., Shrestha, P. & Liu, C. 2020 Liutex core line and POD analysis on hairpin vortex formation in natural flow transition. J. Hydrodyn. 32 (6), 11091121.Google Scholar
Chen, Q., Chen, S. & Eyink, G.L. 2003 a The joint cascade of energy and helicity in three-dimensional turbulence. Phys. Fluids 15 (2), 361374.CrossRefGoogle Scholar
Chen, Q., Chen, S., Eyink, G.L. & Holm, D.D. 2003 b Intermittency in the joint cascade of energy and helicity. Phys. Rev. Lett. 90 (21), 214503.Google Scholar
Cimarelli, A., De Angelis, E. & Casciola, C.M. 2013 Paths of energy in turbulent channel flows. J. Fluid Mech. 715, 436451.Google Scholar
Cimarelli, A., De Angelis, E., Jimenez, J. & Casciola, C.M. 2016 Cascades and wall-normal fluxes in turbulent channel flows. J. Fluid Mech. 796, 417436.Google Scholar
Cimarelli, A., De Angelis, E., Schlatter, P., Brethouwer, G., Talamelli, A. & Casciola, C.M. 2015 Sources and fluxes of scale energy in the overlap layer of wall turbulence. J. Fluid Mech. 771, 407423.Google Scholar
Dai, Y.-J., Huang, W.-X. & Xu, C.-X. 2016 Effects of Taylor–Görtler vortices on turbulent flows in a spanwise-rotating channel. Phys. Fluids 28 (11), 115104.Google Scholar
Dai, Y.-J., Huang, W.-X. & Xu, C.-X. 2019 Coherent structures in streamwise rotating channel flow. Phys. Fluids 31 (2), 021204.Google Scholar
Danaila, L., Anselmet, F., Zhou, T. & Antonia, R.A. 2001 Turbulent energy scale budget equations in a fully developed channel flow. J. Fluid Mech. 430, 87109.Google Scholar
Davidson, P.A. 2013 Turbulence in Rotating, Stratified and Electrically Conducting Fluids. Cambridge University Press.CrossRefGoogle Scholar
Davidson, P.A. 2015 Turbulence: An Introduction for Scientists and Engineers. Oxford University Press.Google Scholar
Davidson, P.A. 2016 Introduction to Magnetohydrodynamics, 2nd edn. Cambridge University Press.Google Scholar
Gatti, D., Chiarini, A., Cimarelli, A. & Quadrio, M. 2020 Structure function tensor equations in inhomogeneous turbulence. J. Fluid Mech. 898, A5.CrossRefGoogle Scholar
Hiejima, T. 2020 Helicity effects on inviscid instability in Batchelor vortices. J. Fluid Mech. 897, A37.Google Scholar
Hu, R., Li, X. & Yu, C. 2022 a Effects of the Coriolis force in inhomogeneous rotating turbulence. Phys. Fluids 34 (3), 035108.Google Scholar
Hu, R., Li, X. & Yu, C. 2022 b Transfers of energy and helicity in helical rotating turbulence. J. Fluid Mech. 946, A19.Google Scholar
Hu, R., Li, X. & Yu, C. 2023 Multiscale dynamics in streamwise-rotating channel turbulence. J. Fluid. Mech. 972, A14.Google Scholar
Irvine, W.T.M. 2018 Moreau's hydrodynamic helicity and the life of vortex knots and links. Comptes Rendus Mécanique, 346 (3), 170174.Google Scholar
Jiménez, J. & Pinelli, A. 1999 The autonomous cycle of near-wall turbulence. J. Fluid Mech. 389, 335359.CrossRefGoogle Scholar
Jing, Z. & Ducoin, A. 2020 Direct numerical simulation and stability analysis of the transitional boundary layer on a marine propeller blade. Phys. Fluids 32 (12), 124102.Google Scholar
Johnston, J.P., Halleent, R.M. & Lezius, D.K. 1972 Effects of spanwise rotation on the structure of two-dimensional fully developed turbulent channel flow. J. Fluid Mech. 56 (3), 533.Google Scholar
Kim, J. 1989 On the structure of pressure fluctuations in simulated turbulent channel flow. J. Fluid Mech. 205, 421451.CrossRefGoogle Scholar
Kim, J., Moin, P. & Moser, R. 1987 Turbulence statistics in fully developed channel flow at low Reynolds number. J. Fluid Mech. 177, 133166.Google Scholar
Kolmogorov, A.N. 1941 The local structure of turbulence in incompressible viscous fluid for very large Reynolds numbers. C. R. Acad. Sci. URSS 30, 301305.Google Scholar
Kristoffersen, R. & Andersson, H.I. 1993 Direct simulations of low-Reynolds-number turbulent flow in a rotating channel. J. Fluid Mech. 256, 163197.Google Scholar
Liu, Y., Tang, Y., Scillitoe, A.D. & Tucker, P.G. 2020 Modification of shear stress transport turbulence model using helicity for predicting corner separation flow in a linear compressor cascade. Trans. ASME J. Turbomach. 142 (2), 021004.Google Scholar
Marati, N., Casciola, C.M. & Piva, R. 2004 Energy cascade and spatial fluxes in wall turbulence. J. Fluid Mech. 521, 191215.CrossRefGoogle Scholar
Marusic, I. & Monty, J.P. 2019 Attached eddy model of wall turbulence. Annu. Rev. Fluid Mech. 51, 4974.Google Scholar
Masuda, S., Fukuda, S. & Nagata, M. 2008 Instabilities of plane Poiseuille flow with a streamwise system rotation. J. Fluid Mech. 603, 189206.Google Scholar
Mininni, P.D. & Pouquet, A. 2009 Helicity cascades in rotating turbulence. Phys. Rev. E 79 (2), 026304.CrossRefGoogle ScholarPubMed
Mininni, P.D. & Pouquet, A. 2010 Rotating helical turbulence. I. Global evolution and spectral behavior. Phys. Fluids 22 (3), 035105.Google Scholar
Mininni, P.D., Rosenberg, D. & Pouquet, A. 2012 Isotropization at small scales of rotating helically driven turbulence. J. Fluid Mech. 699, 263279.Google Scholar
Moffatt, H.K. & Tsinober, A. 1992 Helicity in laminar and turbulent flow. Annu. Rev. Fluid Mech. 24 (1), 281312.Google Scholar
Moin, P., Leonard, A. & Kim, J. 1986 Evolution of a curved vortex filament into a vortex ring. Phys. Fluids 29 (4), 955963.Google Scholar
Mollicone, J.P., Battista, F., Gualtieri, P. & Casciola, C.M. 2018 Turbulence dynamics in separated flows: the generalised Kolmogorov equation for inhomogeneous anisotropic conditions. J. Fluid Mech. 841, 10121039.Google Scholar
Oberlack, M. 2001 A unified approach for symmetries in plane parallel turbulent shear flows. J. Fluid Mech. 427, 299328.Google Scholar
Oberlack, M., Cabot, W., Reif, B.A.P. & Weller, T. 2006 Group analysis, direct numerical simulation and modelling of a turbulent channel flow with streamwise rotation. J. Fluid Mech. 562, 383403.Google Scholar
Pelz, R.B., Yakhot, V., Orszag, S.A., Shtilman, L. & Levich, E. 1985 Velocity-vorticity patterns in turbulent flow. Phys. Rev. Lett. 54 (23), 2505.Google Scholar
Polifke, W. & Shtilman, L. 1989 The dynamics of helical decaying turbulence. Phys. Fluids A: Fluid Dyn. 1 (12), 20252033.Google Scholar
Pouquet, A. & Yokoi, N. 2022 Helical fluid and MHD turbulence: a brief review. Philos. Trans. R. Soc. A 380 (2219), 20210087.Google Scholar
Povitsky, A. 2017 Three-dimensional flow with elevated helicity in driven cavity by parallel walls moving in perpendicular directions. Phys. Fluids 29 (8), 083601.Google Scholar
Schoppa, W. & Hussain, F. 2002 Coherent structure generation in near-wall turbulence. J. Fluid Mech. 453, 57108.Google Scholar
Teimurazov, A.S., Stepanov, R.A., Verma, M.K., Barman, S., Kumar, A. & Sadhukhan, S. 2018 Direct numerical simulation of homogeneous isotropic helical turbulence with the TARANG code. J. Appl. Mech. Tech. Phys. 59 (7), 12791287.Google Scholar
Tsinober, A. 2019 Essence of Turbulence as a Physical Phenomenon. Springer.CrossRefGoogle Scholar
Waleffe, F. 1992 The nature of triad interactions in homogeneous turbulence. Phys. Fluids A: Fluid Dyn. 4 (2), 350363.Google Scholar
Waleffe, F. 1993 Inertial transfers in the helical decomposition. Phys. Fluids A: Fluid Dyn. 5 (3), 677685.Google Scholar
Wang, Y., Huang, W. & Xu, C. 2015 On hairpin vortex generation from near-wall streamwise vortices. Acta Mechanica Sin. 31 (2), 139152.Google Scholar
Weiss, A., Gardner, A.D., Schwermer, T., Klein, C. & Raffel, M. 2019 On the effect of rotational forces on rotor blade boundary-layer transition. AIAA J. 57 (1), 252266.Google Scholar
Xia, Z., Shi, Y. & Chen, S. 2016 Direct numerical simulation of turbulent channel flow with spanwise rotation. J. Fluid Mech. 788, 4256.CrossRefGoogle Scholar
Yan, Z., Li, X. & Yu, C. 2022 Helicity budget in turbulent channel flows with streamwise rotation. Phys. Fluids 34 (6), 065105.Google Scholar
Yang, Y.T., Su, W.D. & Wu, J.Z. 2010 Helical-wave decomposition and applications to channel turbulence with streamwise rotation. J. Fluid Mech. 662, 91122.Google Scholar
Yang, Z., Deng, B.Q., Wang, B.C. & Shen, L. 2018 Letter: the effects of streamwise system rotation on pressure fluctuations in a turbulent channel flow. Phys. Fluids 30 (9), 17.Google Scholar
Yang, Z., Deng, B.-Q., Wang, B.-C. & Shen, L. 2020 a On the self-constraint mechanism of the cross-stream secondary flow in a streamwise-rotating channel. Phys. Fluids 32 (10), 105115.Google Scholar
Yang, Z., Deng, B.-Q., Wang, B.-C. & Shen, L. 2020 b Sustaining mechanism of Taylor–Görtler-like vortices in a streamwise-rotating channel flow. Phys. Rev. Fluids 5 (4), 044601.Google Scholar
Yang, Z. & Wang, B.-C. 2018 Capturing Taylor–Görtler vortices in a streamwise-rotating channel at very high rotation numbers. J. Fluid Mech. 838, 658689.Google Scholar
Yu, C., Hu, R., Yan, Z. & Li, X. 2022 Helicity distributions and transfer in turbulent channel flows with streamwise rotation. J. Fluid Mech. 940, A18.Google Scholar
Figure 0

Table 1. Computational descriptions of simulations.

Figure 1

Figure 1. Profile of mean helicity: (a) overall helicity $H^+$; (b) decomposed helicity $H_i^+$ of ST30 and the grey filled region shows the error bar of $H^+$.

Figure 2

Figure 2. Profile of fluctuating helicity: (a) overall helicity $\langle h \rangle$; (b) decomposed helicity $\langle h_i \rangle$ of ST30 and the grey filled region shows the error bar of $\langle h \rangle ^+$.

Figure 3

Figure 3. Relation between the peak $x_2^+ |_{max{[\langle h \rangle ^+]}}$ and the parameter $Re_\tau /Ro_\tau$. The black solid line is the fitted sigmoid function (2.4) and the black dashed line serves as a reference for the linear law.

Figure 4

Figure 4. Fluctuating helicity budget: (a) ST07; (b) ST30. The black solid lines of $x_2^+=23.4$ and $x_2^+=7.8$ give the zeros points of the helicity distribution in figure 2(a).

Figure 5

Figure 5. (a) $\langle G_R \rangle$, (b) $\langle C \rangle$ and (c) $\langle T \rangle$ of different cases in the helicity budget.

Figure 6

Figure 6. Near-wall behaviours of helicity budget of ST30.

Figure 7

Figure 7. Scale helicity distribution: (a) $\langle \delta h \rangle$ of ST30, and the pink filled region shows the error bar of $\langle \delta h \rangle$ in the buffer layer $x_2^+=10.5$; (b) $\langle \delta h \rangle$ in the buffer layer ($x_2^+=10.3$ for ST07R and ST15R, $x_2^+=10.0$ for ST07RR and $x_2^+=10.5$ for the other cases).

Figure 8

Figure 8. Scale distribution of the pressure and its decomposition of ST30 non-dimensionalized using the corresponding mean-square value in the buffer layer $x_2^+=10.5$. The grey filled region shows the error bar of $\langle \delta p^{2} \rangle /2/\langle p^{2} \rangle$.

Figure 9

Figure 9. DHGKE in the viscous sublayer ($x^+_2=3.5$): (a) ST07; (b) ST30.

Figure 10

Figure 10. DHGKE in the buffer layer ($x^+_2=10.5$): (a) ST07; (b) ST30.

Figure 11

Figure 11. (a) $\langle \varPi ^{S}\rangle$, (b) $\langle T^{SS} \rangle ^+$, (c) $\langle G^{S}_R \rangle ^+$ and (d) $\langle C^S \rangle ^+$ for different cases around the peak of the fluctuating helicity ($x_2^+=5.3$ for ST07R and ST15R, $x_2^+=5.4$ for the other cases).

Figure 12

Figure 12. DHGKE in the log-law layer ($x^+_2=80.0$): (a) ST07; (b) ST30.

Figure 13

Figure 13. (a) $G^{S+}_R$ and (b) $C^{S+}$ for different cases in the log-law layer ($x_2^+=81.6$ for ST07R and ST15R, $x_2^+=80.3$ for ST07RR, $x_2^+=80.0$ for the other cases).

Figure 14

Figure 14. Correlation factor of all terms in the DHGKE in the (a) viscous sublayer ($x_2^+=3.5$), (b,d) buffer layer ($x_2^+=10.5$) and (c) log-law layer ($x_2^+=80.0$). Panels (ac) present the results with the scale $r_1^+=47.1$ and panel (d) presents the results with the scale $r_1^+=164.9$.

Figure 15

Figure 15. Distribution of quantities on typical vortices in ST30 drawn with $Q>400$. The slices show the distribution of the quantities at $x_1^+=2147.4$. (a) Fluctuating helicity $h^+$. (b) Streamwise fluctuating helicity $h_1^+$. (c) Streamwise fluctuating vorticity $\omega _1^+$. (d) Rotation-induced pressure $p_R^+$.

Figure 16

Figure 16. Streaks and their lift angles of ST30. (a) Contour of $u_1^+$ at $x_2^+=20.0$. The grey transparent structures are obtained using the $Q$ criterion $Q>400$. (b) Distribution of $\delta h^+$ at $x_2^+=20.0$ with $r_1^+=47.1$. The black solid lines are the isolines of $u_1^+=-2$. (c) Contour of $U_1^+$ at $x_1^+=2757.6$. The black solid line shows the isoline of $U^+_1=9.0$. (d,e) P.d.f. of the streak lift angles $\theta _l$ at $x_2^+=10.5$ and $x_2^+=20.0$, respectively. The pink filled region in panel (e,f) shows the error bars of the p.d.f. of ST30.

Figure 17

Figure 17. Vortices in the log-law layer and the p.d.f. of the vortex angle $\theta _\omega$. (a,b) Vortices in the log-law layer ($x_2^+ \in [40.0, 180.0]$) coloured by $x_2^+$ with $Q>50$ of ST07 and ST30, respectively. (c) P.d.f of vortex angles $\theta _{\omega }$ at $x_2^+=80.0$ and the pink filled region shows the error bar of the p.d.f. of ST30.

Figure 18

Figure 18. Profile of mean velocity: (a) $\langle U_1 \rangle ^+$; (b) $\langle U_3 \rangle ^+$.

Figure 19

Figure 19. Profile of mean vorticity: (a) $\langle W_1 \rangle ^+$; (b) $\langle W_3 \rangle ^+$.

Figure 20

Figure 20. (a) Decomposed helicity $H_i^+$ of ST30 and the grey filled region shows the error bar of $H^+$. (b) Details about the error bars.

Figure 21

Figure 21. Error bars of DHGKE in the log-law layer of (a) ST07 with 81 slices, (b) ST30 with 41 slices, (c) ST07 with 41 slices and (d) ST07 of only one time slice.