In the above-mentioned article of Woodhead et al. (Reference Woodhead, Gazard, Hotopf, Rahman, Rimes and Hatch2016) there are errors in the tables. The correct versions of the tables and details of the corrections are given below. The author apologises for these errors.
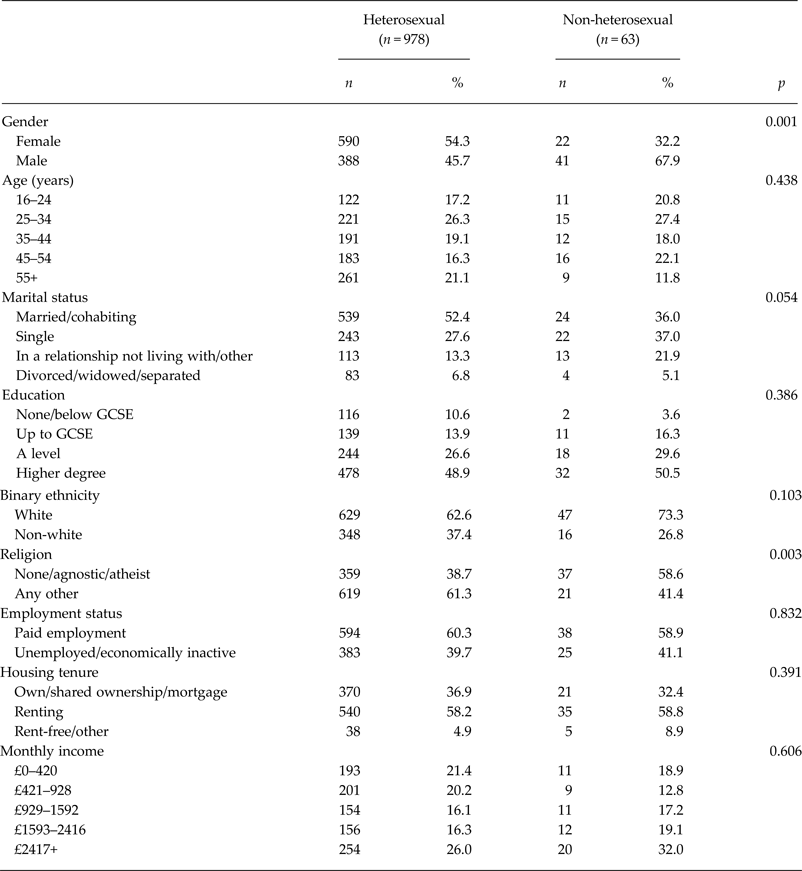
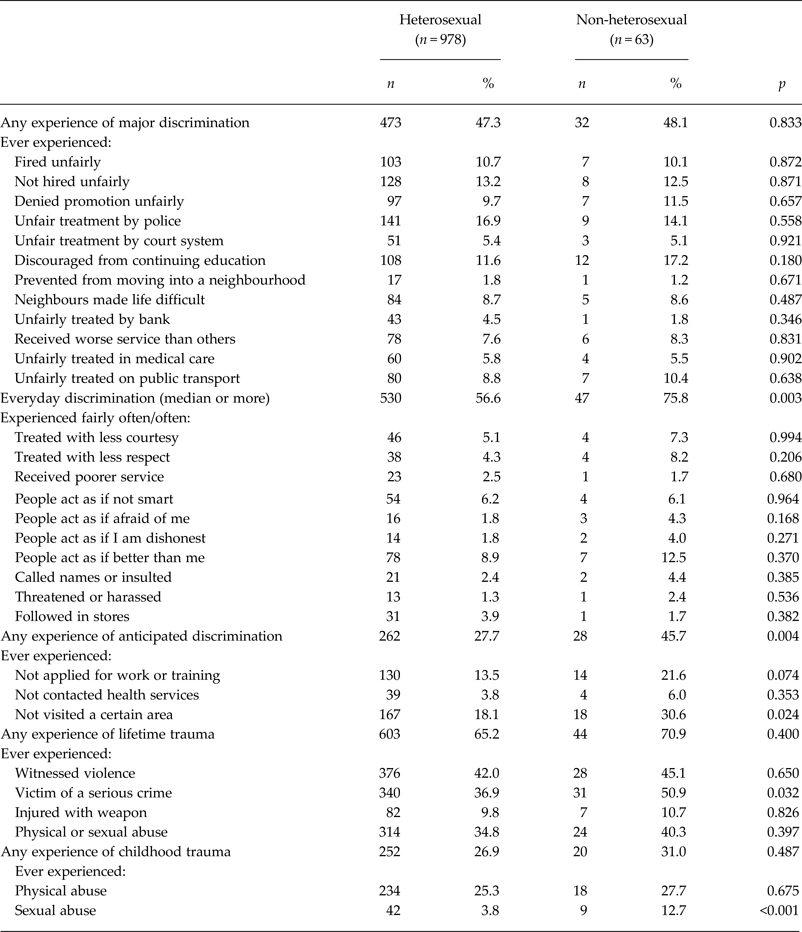
Due to a survey weight calculation correction to the South East London Community Health study (SELCoH) data, all weighted prevalence's, odds ratios and confidence intervals have been amended. The following describes the main relevant updated univariate data in Tables 1–3. Rather than 5.4, 6.6% identified as non-heterosexual (4.8% homosexual, 1.4% bi-sexual and 0.5% ‘other’). Marital status (p = 0.054); reporting having ever been discouraged from continuing education (p = 0.180); that people ever acted as if they were afraid (p = 0.168) and not applying for work or training for fear of discrimination (p = 0.074) was no longer associated with sexual orientation.
Table 1. Demographic and socio-economic characteristics by sexual orientation. Numbers (n), weighted percentages (%) and p-values are shown

Numbers may not add up due to missing data.
Table 2. Lifetime exposure to discrimination, lifetime and child trauma by sexual orientation. Numbers (n), weighted percentages (%) and p-values are shown

Table 3. Mechanisms used some/most of the time to cope with unfair treatment by sexual orientation. Numbers (n), weighted percentages (%) and p-values are shown

Associations with anticipated discrimination and everyday discrimination overall remained highly significant and were input into Model C in place of individual items, in analyses described in Table 4. The pattern of effect sizes in each adjustment model (Table 4) remains similar overall to those reported. For each outcome, adjustments for everyday and anticipated discrimination overall had the largest (though small to moderate) impact on effect sizes (Model C). Sexual orientation remained significantly associated with symptoms of common mental disorder (CMD) in each model, with effect sizes ranging from 2.97 (OR 1.69–5.24, p < 0.001) in Model A to 2.46 (OR 1.34–4.54, p < 0.01) in Model C. lifetime suicidal ideation remained highly significantly associated with sexual orientation in each model, with effect sizes ranging from 4.26 (OR 2.38–7.64, p < 0.001) in Model B to 3.52 (OR 2.03–6.09, p < 0.001) in Model C. similarly, past year drug use remained highly significantly associated with sexual orientation in each model, with effect sizes ranging from 3.41 (OR 1.67–6.94, p < 0.001) in Model D to 2.83 (OR 1.51–5.31, p < 0.001) in Model C. in contrast to reported data, harmful alcohol use was no longer significantly associated with sexual orientation following adjustments for childhood sexual abuse and whether ever been a victim of a serious crime (2.37, OR 1.00–5.64). Comparisons with national data (Table 5) indicated the same pattern of findings, with the exception that except SELCOH non-heterosexuals were no longer more likely than the national sample of non-heterosexuals to be harmful alcohol drinkers.
Table 4. Adjusted associations between sexual orientation and mental health, substance use and well-being. Odd ratios (OR) and 95% confidence intervals (CI) are shown

H, heterosexual; NH, non-heterosexual
Model A adjusted for age (continuous), gender, educational attainment, ethnicity, marital status. Model B as model A, additionally adjusted for major, everyday and anticipated discrimination and childhood and lifetime trauma overall. Model C as model A, additionally adjusted for everyday discrimination and any experience of anticipated discrimination. Model D as model A, additionally adjusted for childhood sexual abuse and whether ever been a victim of a serious crime.
a Shortened Warwick-Edinburgh Mental Well-being Scale (continuous).
b Revised Clinical Interview Schedule, cut-off 12+.
c Alcohol Use Disorders Identification Test, cut-off 16+.
d Includes: cannabis, cocaine, metamphetamine, Khat, amphetamines, crack, tranquilisers, heroin, ecstasy and LSD.
*p ≤ 0.05, **p ≤ .01, ***p ≤ 0.001.
Table 5. Comparison of substance misuse and mental health outcomes between South East London Community Health survey (SELCoH) and Adult Psychiatric Morbidity Survey 2007 (APMS) England/London samples by sexuality. Numbers (n), weighted percentages (%), odds ratios (OR) and 95% confidence intervals (CI) are shown.

* Adjusted model with combined comparable data from both studies; including gender, age (continuous), binary ethnicity, binary education, binary marital status.
a Revised clinical interview schedule, cut-off 12+.
b Alcohol use disorders identification test, cut-off 16+.
c Includes: cannabis, cocaine, amphetamines, crack, tranquilisers, heroin, ecstasy and LSD.
*p ≤ 0.05, ***p ≤ 0.001.


