A semi-quantitative food frequency questionnaire (FFQ) was developed to assess macronutrient intake in first generation Ghanaians in the UK to characterise habitual intake and for utilisation in an intervention study investigating the effectiveness of dietary education in Black Churches. The first generation Ghanaian migrants were recruited from a selection black majority churches with a predominantly large Ghanaian congregation in London. Churches were used because of the difficulty of access in this population, and have been used successfully in other similar intervention studies(Reference Resnicow, Campbell and Carr1). The Pastors from four Churches (Praise Chapel, Faith Baptist Church, Harvest Chapel International and Trinity Presbyterian Church of Ghana) gave permission to approach their congregation for participation in the study.
The FFQ was developed by compiling a food list of commonly consumed foods using repeated 24hr recalls in a small sub-sample (n 10) and then supplemented with data from other relevant studies(Reference Sharma and Cruickshank2) and with foods popular in the native British diet. Portion size was assessed using common units and household measures typically used in Ghanaian households. Frequency was assessed using four categories (per day, per week, per month or rarely). The FFQ was then piloted and then finalised with a total of 13 food groups, with an additional section for supplements, cooking methods and foods not listed. A sub-sample from the study population (n 68) agreed to participate in the validation study. An initial face-to-face 24-hr recall was conducted at the Church which was then followed-up with six randomly repeated 24hr over the telephone, which also included one weekend day. All interviews, coding and data entry were conducted by the same researcher.
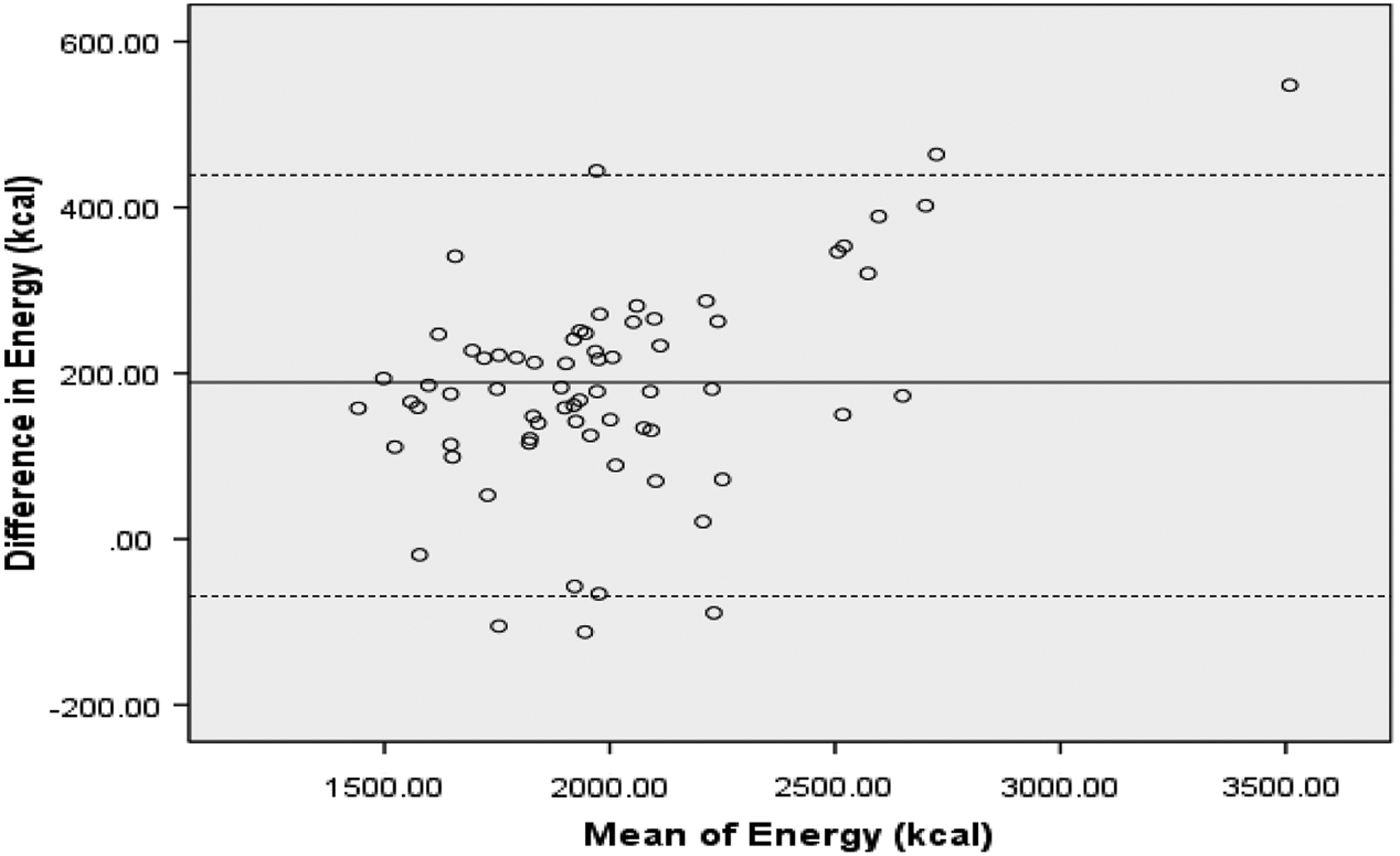
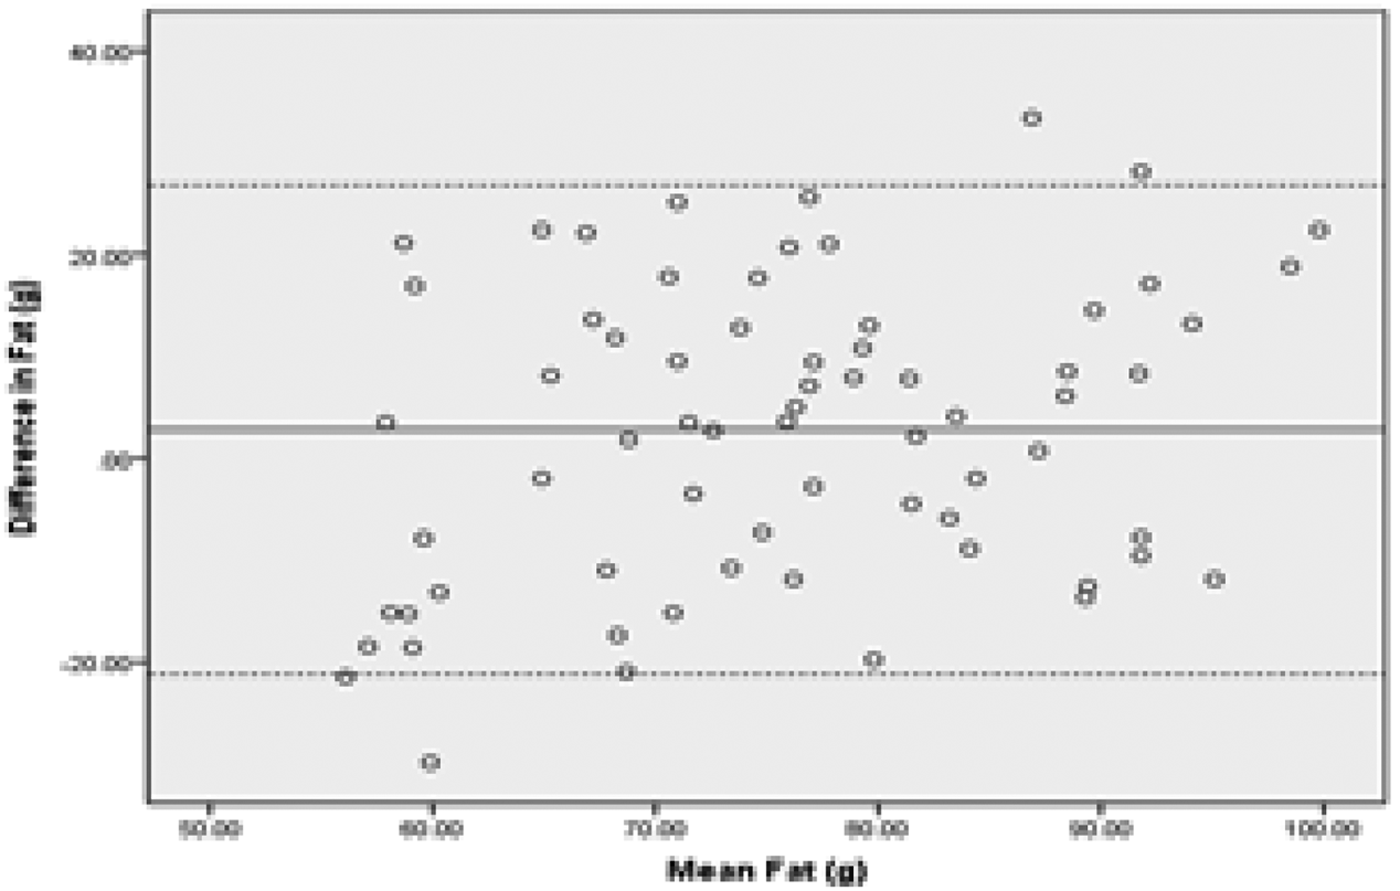
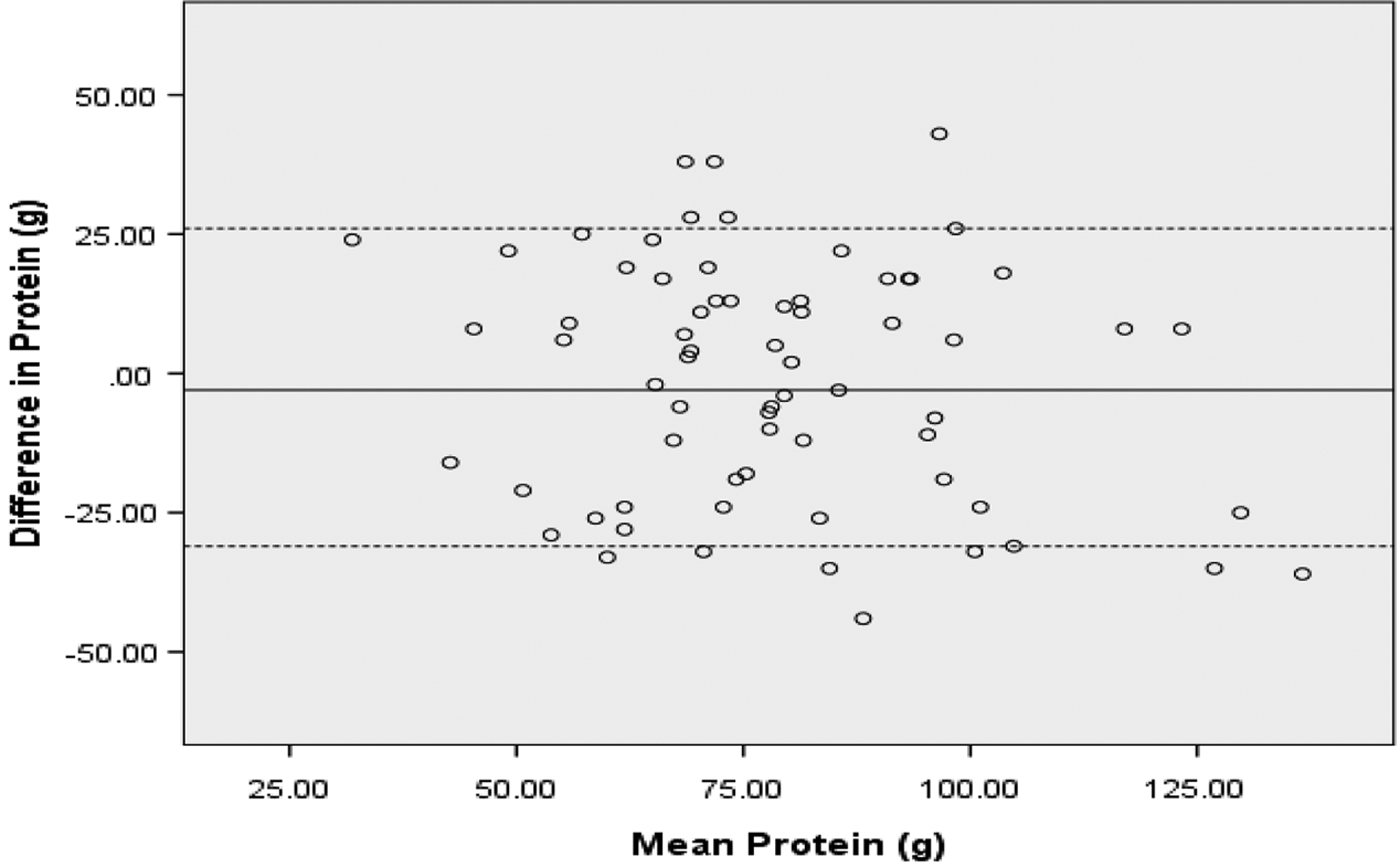
Spearman correlation for energy intake (kcal/d) (FFQ 2071 (360 SD), 24hr 1987 (291 SD), r 0·64) was within acceptable range r = 0·5–0·7(Reference Willett3), as were energy adjusted correlations for carbohydrate (g/d) (FFQ 259 (66 SD), 24hr 250 (59 SD) r 0·54), fat (g/d) (FFQ 81 (11 SD), 24hr 78 (21 SD), r 0·69), and protein g/d (77 (34 SD), 71 (23 SD), r 0·71). A comparison of ranking between the two dietary methods showed that most nutrients were either in the same (46–54%) or adjacent quartile (39–49%), with only 0–9% in the extreme quartile. Bland-Altman plots comparing the FFQ with the multiple 24hr recalls for energy (Fig. 1) fat (Fig. 2), protein (Fig. 3) and carbohydrate (Fig. 4) were within acceptable limits of agreement (±1·96 SD). The FFQ is therefore deemed a valid tool to assess dietary intake in this population.

Fig. 1. FFQ and 24hr recalls for energy

Fig. 2. FFQ and 24hr recalls for fat

Fig. 3. FFQ and 24hr recalls for protein

Fig. 4. FFQ and 24hr recalls for


