INTRODCUTION
In China, measles incidence decreased dramatically following the introduction of measles mass vaccination in the 1960s. The objective of the World Health Organization (WHO)–United Nations Children's Fund (UNICEF) 2012 strategic plan for global measles control of the Western Pacific Region is to achieve and maintain interruption of indigenous measles transmission in areas with elimination goals [1]. Because more than 80% of the population of the Western Pacific Region live in China, the progress of measles control in that country will contribute to the investigation of the feasibility of a regional and global measles elimination goal [Reference Lixia2]. Thus, the prevention and control of measles in China is a vitally important subject for epidemiology and social medicine.
For preventing and controlling measles epidemics, the inter-epidemic period (IEP), which corresponds to the interval between major epidemics of the disease, has been investigated with time-series analysis and mathematical models [Reference Sumi3–Reference Grenfell, Bjornstad and Kappey10]. The IEP represents the amount of time required to accumulate a cohort of susceptible individuals that is sufficiently large to allow measles virus to effectively spread over a community once it is introduced from outside. Our previous work was devoted to the investigation of the IEP of measles epidemics in Japan using spectral analysis [Reference Sumi3], and it confirmed that the IEP increases as the vaccination ratio increases. This result was supported by theoretical studies for a mathematical model of epidemics of infectious diseases [Reference Anderson and Grenfell4, Reference Anderson and May5, Reference Grenfell and Anderson11]. Based on the results obtained, it was concluded that the IEP of measles epidemics is useful for estimating quantitatively the effect of vaccination on disease incidence [Reference Sumi3].
With respect to measles epidemics in China, the lowest incidence in history was recorded in 1995, with incidence rising again thereafter. In 2005, the highest incidence was recorded in the past decade. Nowadays, the incidence is of still high prevalence in some provinces of China, including Wuhan. Wuhan is the capital city of Hubei province and the most populous city in central China, with a population of 7 680 000 in 2008, and has accumulated good-quality incidence data of measles through surveillance programmes. Investigation of temporal features of this data could be significant for estimation of the country's measles control programmes. In the present study, spectral analysis was employed for the incidence data of measles in Wuhan and the effectiveness of vaccination on the IEP in disease epidemics was investigated.
MATERIAL AND METHOD
Measles data
The present study is devoted to spectral analysis of the monthly number of measles cases per 100 000 in Wuhan from January 1953 to December 2008 (number of data=672). The incidence data were obtained from the National Infectious Diseases Reporting System, Wuhan Centre for Disease Prevention and Control, China.
Spectral analysis
Spectral analysis was employed for time-series data of measles incidence [Reference Armitage, Berry and Matthews12, Reference Cliff, Haggett and Smallman-Raynor13] and power spectral density (PSD) was obtained. The method of spectral analysis used in the present study is based on the maximum entropy method (MEM) [Reference Sumi14–Reference Seido and Ohtomo18].
RESULTS
Temporal variations of measles incidence data
Monthly measles incidence data for Wuhan from January 1953 to December 2008 were plotted (Fig. 1 a). In the incidence data, a large decreasing trend was observed at the beginning of mass vaccination, which started in 1966 in Wuhan. A biennial cycle of measles epidemics, usually observed in Japanese, European and USA data in the pre-vaccine range [Reference Sumi3, Reference Anderson and Grenfell4], was observed prior to 1966. The close-up of incidence data from 1978 to 1986 and from 1987 to 2008 is illustrated in Fig. 1 (b, c), respectively. In both panels, an annual cycle of epidemics was clearly observed, although the incidence peaks appeared to be clearly depressed compared to the case of the pre-vaccine range (1953–1965). This depression of the peaks might be largely due to the following measles control programmes in Wuhan: the establishment of the national Expanded Programme on Immunization (EPI) in 1978, the expansion of the cold chain campaign from 1983, and the introduction of measles, mumps, rubella (MMR) vaccination in 2000. The vaccination coverage during 1991–2008 ranged between 91% and 98% (Fig. 1 c).

Fig. 1. Monthly incidence data of measles in Wuhan, China from 1953 to 2008. (a) The original data; (a′) the histogram of the original data. (b) A close-up of the original data from 1978 to 1986. (c) A close-up of the original data from 1987 to 2008. (d) The logarithm-transformed data of the original data (—) and its optimum LSF curve (- - -). (e) Maximum entropy method-power spectral density (MEM-PSD) of the residual data in the low-frequency range (f<0·2). (f) The residual data which is obtained by subtracting the LSF curve from the log-data; (f′) the histogram of the residual data. The small vertical line in panel (f) indicates the boundary of the pre-vaccine (1953–1965) and post-vaccine (1966–2008) ranges.
Setting up the incidence data for analysis
Figure 1 a′ shows the frequency histogram for the incidence data (Fig. 1 a), which is separate from the normal distribution required for conventional spectral analysis. Logarithm transformation of the incidence data was then introduced. In the logarithm-transformed data (Fig. 1 d), the spikiness of the incidence observed in the original data (Fig. 1 a) was reduced, whereas a decreasing trend due to a large differences between the beginning and end parts of the log-data (Fig. 1 d) was observed.
To remove the long-term trend of the log-data (Fig. 1 d), MEM-PSD was calculated for the log-data, and the low-frequency range of PSD is shown in Figure 1 e. Therein, the long-term periodic mode was observed as the prominent peak at 92·2 years with a 92·2-year periodic mode, and the optimum least squares fitting (LSF) curve for the entire original log-data was obtained (Fig. 1 d). The LSF curve was removed from the original log-data and the residual time series were thus obtained (Fig. 1 f). The frequency histogram for the residual data (Fig. 1 f) approximated to the normal distribution required for conventional spectral analysis (Fig. 1 f′). The formulation of the LSF curve is described in the Appendix.
Periodic structure of measles incidence data
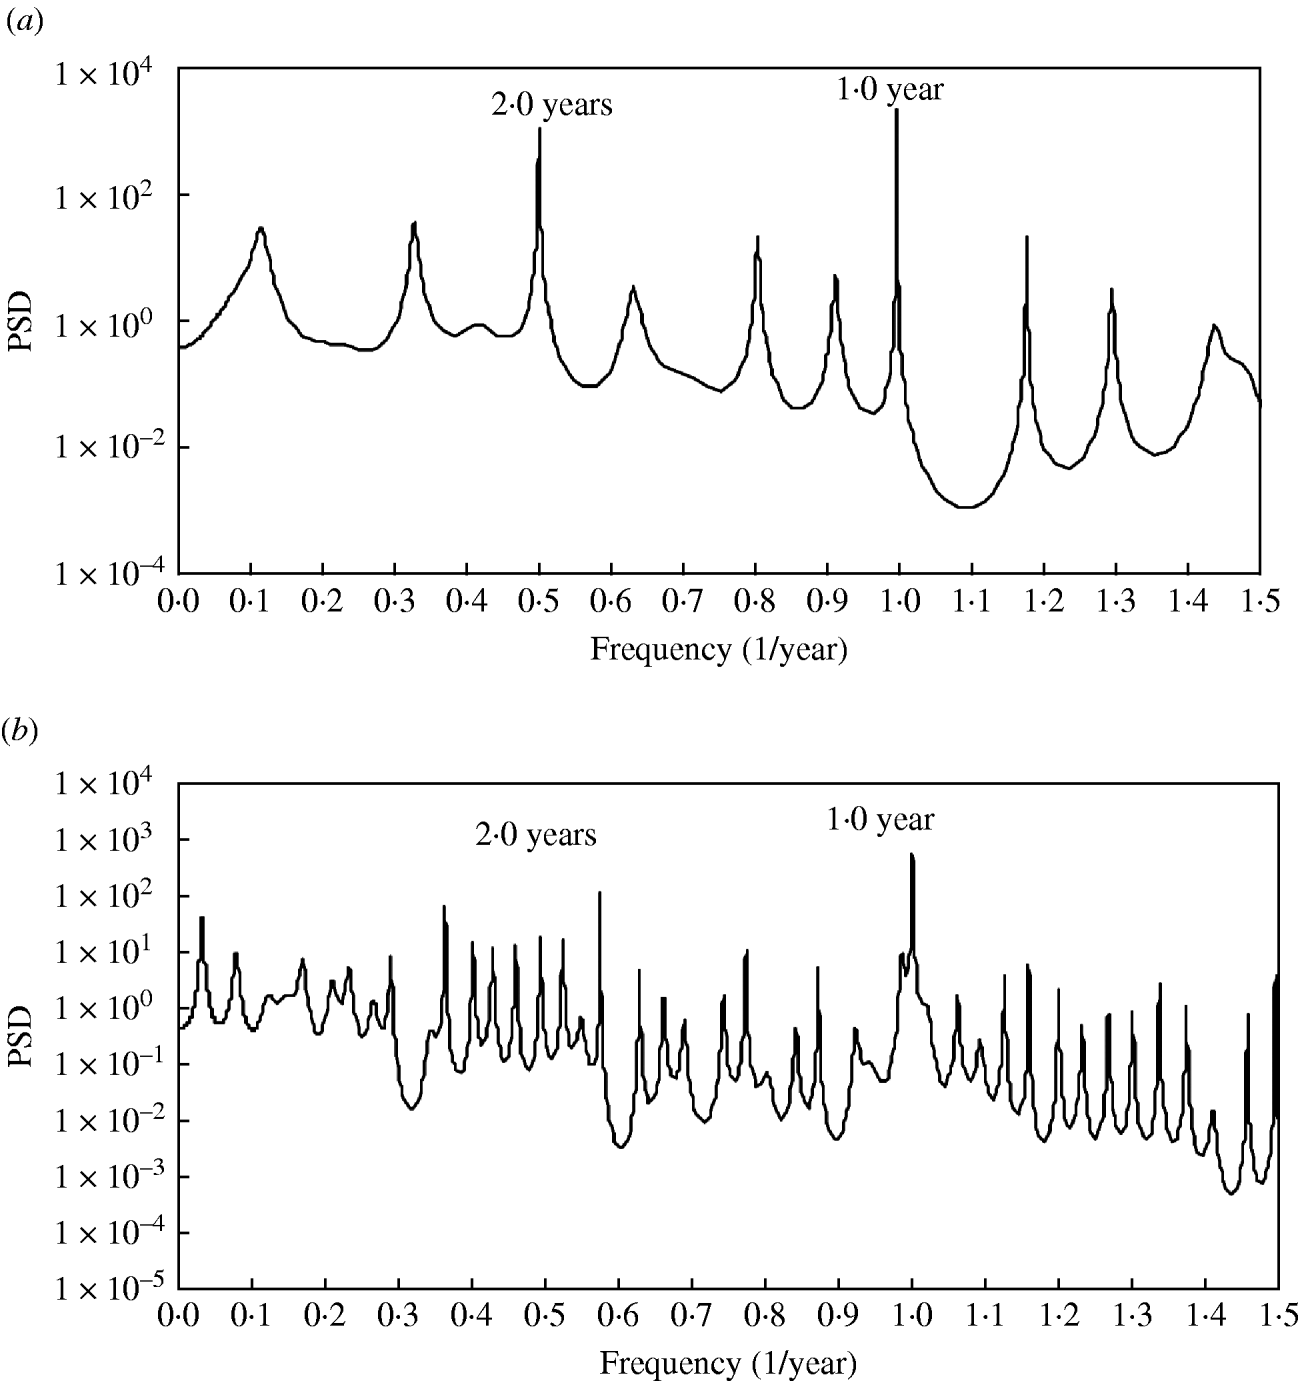
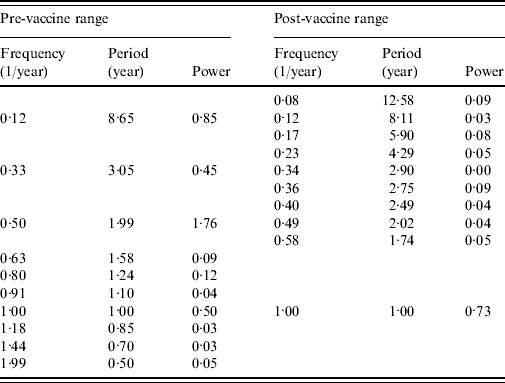
To investigate the effect of vaccination on the IEP of measles epidemics, the residual data (Fig. 1 f) was divided into two ranges in accordance with the starting points of the mass vaccination programme in Wuhan (1966): pre-vaccine range (1953–1965) and post-vaccine range (1966–2008). MEM-PSDs for the residual data in pre- and post-vaccine ranges were calculated. The semi-log plots of the PSD [f (frequency)⩽1·5] are shown in Fig. 2 (a, b) for the pre- and post-vaccine ranges, respectively. For both ranges, many well-defined spectral peaks were clearly observed. Ten spectral peak-frequency modes were selected in descending order of power of spectral peak, and were summarized with corresponding periods and intensities (powers) for spectral peaks (Table 1).

Fig. 2. Maximum entropy method-power spectral density (MEM-PSD) for two ranges of the residual data (f<1·5). (a) Pre-vaccine range (1953–1965). (b) Post-vaccine range (1966–2008).
Table 1. Ten dominant spectral peaks observed in Fig. 2

In both PSDs (Fig. 2, Table 1), common prominent peaks were observed at approximately f=1·0, corresponding to an annual cycle of epidemics. In the PSD for the pre-vaccine range (Fig. 2 a, Table 1), the most dominant spectral peak was observed at f=0·5, corresponding to a 2·0-year period. It could be considered that this 2·0-year period indicates the IEP of measles incidence in the pre-vaccine range.
In the case of post-vaccine range (Fig. 2 b, Table 1), many peaks with comparable intensities emerged so that the peak of the IEP could not be specified.
Segment time-series analysis
Periodic structures of the residual data (Fig. 1 f) were further investigated through segment time-series analysis. The whole residual data (Fig. 1 f) were divided into a subseries of 94: each segment had a time range of 120 months (10 years) and the beginning of the range was delayed 6 months. Then, the PSD was calculated for each segment. The 94 PSDs thus obtained were arranged in order of time sequence to construct the three-dimensional (3D) spectral array, as shown in Fig. 3. In the low-frequency range of the 3D spectral array (f<~0·1) in Figure 3, distinct and discrete peaks were observed, reflecting the wave form of the time-series data of definite data length.

Fig. 3. Three-dimensional spectral array for the residual data. PSD, Power spectral density.
In the 3D spectral array (Fig. 3), spectral peaks at frequency f=1·0, corresponding to a 1-year period were observed as a fine array over the whole time range. The behaviours of temporal variations of spectral peaks of f <1 (denoting a frequency lower than f 1), in pre-vaccine (1953–1965) and post-vaccine (1966–2008) ranges were different from each other with small fluctuations of spectral peak frequencies in the pre-vaccine range and large fluctuations in the post-vaccine range.
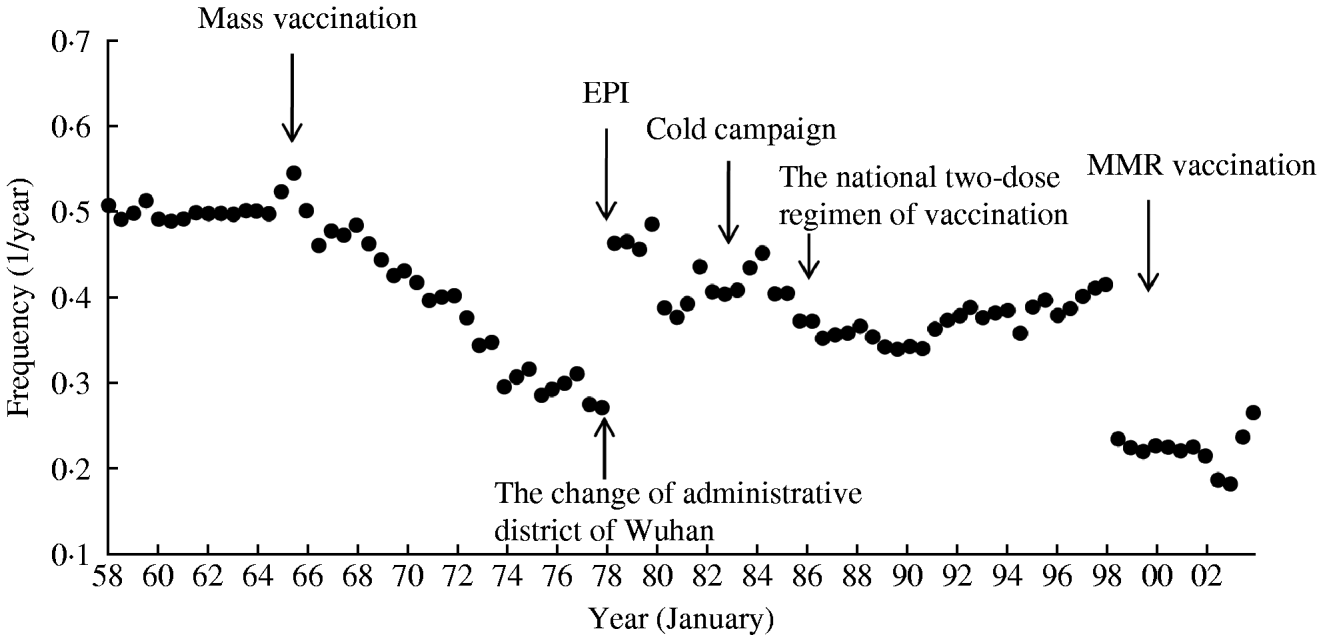
The temporal variations of the frequencies of dominant spectral peaks detected in f <1 in the 3D spectral array (Fig. 3) are plotted in Figure 4. As seen in the figure, in the pre-vaccine range (1953–1965), the spectral peaks of f <1 were observed around f=0·5 (2 years) and a slight fluctuation of f <1 occurred. In the post-vaccine range (1966–2008), f <1 gradually migrated to the low-frequency range from 0·5 (2 years) to 0·25 (4 years) until 1978. Thereafter, f <1 returned to the high-frequency range from 0·25 (4 years) to 0·5 (2 years) until 1980, and remained relatively constant around 0·4 (2·5 years) during 1980–1998. After 1998, the spectral peaks of f <1 were observed around 0·2 (5 years) until 2002, and then f <1 began to migrate to the high-frequency range.

Fig. 4. Temporal variations of the frequencies of dominant spectral peaks detected in the frequency range of 0·1⩽f⩽0·7. EPI, Expanded Programme on Immunization.
DISCUSSION
The present study indicates that periodic structures of the measles data of Wuhan changed temporally after the introduction of mass vaccination (Fig. 4). For the pre-vaccine range (1953–1965), the observed value of the dominant period assigned as 2·0 years (Figs 2 a, 4) is essentially in accord with the cases of Japan, England and Wales, and New York City [Reference Sumi3, Reference Anderson and Grenfell4]. This 2·0-year cycle is able to be well reproduced by the most widely used model to simulate measles dynamics, i.e. the Susceptible/Exposed/Infective/Recovered (SEIR) model with seasonal forcing, which is described by nonlinear differential equations [Reference Sumi, Ohtomo and Tanaka19, Reference Olsen and Schaffer20]. On the other hand, the nonlinear differential equations, in general, describe a self-organizational phenomenon. Therefore, measles epidemics in Wuhan are probably related to a self-organizational process due to a nonlinear effect of four categories (S, E, I, R).
With respect to the post-vaccine region (1966–2008), the temporal behaviour of periodic structures observed in Figure 4 warrants the following special mention regarding the effect of measles control programmes in Wuhan, based on the theoretical studies predicting that vaccination generates an increase in IEP of measles epidemics. First, the result observed in Figure 4 that the gradual migration of the spectral line to the low-frequency range from 0·5 (2 years) to 0·25 (4 years) during 1966–1978 might reflect the influence of an increase in vaccination rate after the introduction of mass vaccination in 1966. Second, the result that the spectral line returned to the high-frequency range from 0·25 (4 years) to 0·5 (2 years) during 1978–1980 might suggest a decrease in vaccination rate due to rapid growth of population because of the change of administrative district of Wuhan in 1978. Third, the result that the spectral line fluctuated around f=0·4 (2·5 years) during 1980–1998, might suggest that the vaccination rate remained constant at a relatively high rate after the establishment of EPI in 1978, the expansion of cold chain in 1983, and the national two-dose regimen of vaccination in 1986 in Wuhan. Fourth, the result that spectral peaks observed at around f=0·2 (5 years) after 1998 might be caused by the rapid increase in vaccination rate of both mass vaccination and MMR vaccination which were introduced in 2000 (Fig. 1 c). Fifth, the result of the migration of the spectral line to the high-frequency range from 2002 might reflect a sharp decrease in vaccination rate in 2002 (Fig. 1 c) resulting from personnel changes of a large number of professionals in children's vaccination management due to the institutional reform of the Chinese health system around the same year.
An important observation of measles epidemics in Wuhan (Fig. 1 a–c) is that vaccination appears to reduce the amplitude of incidence, whereas it does not eliminate the periodicity. Thus, in order to prevent and control the disease epidemics in Wuhan, it is necessary to investigate the effect of vaccination on periodicity. The result obtained in the present study (Fig. 4) indicates that the IEP of measles epidemics is useful for estimating the effect of vaccination on disease incidence quantitatively in Wuhan as well as for Japan [Reference Sumi3]. This result is supported by theoretical studies for a mathematical model of epidemics of infectious diseases [Reference Anderson and Grenfell4, Reference Anderson and May5, Reference Grenfell and Anderson11].
In general, many biological phenomena are non-stationary and nonlinear, and transit from one state to another in a complicated manner. It is possible that periodic structures of disease data are also altered temporally, as observed in the 3D spectral array (Fig. 3). It is not appropriate to entirely deal with the overall time series incorporating such states. Thus, in order to elucidate a temporal evolution of nonlinear phenomena, it is preferable to deal with segments of time series of shorter data length through the segment time-series analysis, as performed in the present study. It is anticipated that the investigation of the IEP of disease epidemics with segment time-series analysis will contribute to long-term and effective measles control programmes in Wuhan.
ACKNOWLEDGEMENTS
This study was supported by a Grant-in-Aid for Scientific Research (No. 20590609) from the Ministry of Education, Culture, Sports, Science, and Technology, Japan.
APPENDIX
LSF calculations are performed by using a suitable periodic function
where x(t) (t, time) is the original time-series data, f n (=1/T n; T n, the period) the frequency of the nth periodic component, a 0 a constant which indicates the average value of the time series, a n and b n are amplitudes of the nth component (n=1, 2, ..., N p), and N p the total number of components.
The optimum values of parameters a 0, a n and b n (n=1, 2, … , N p) in eq. (A1), except for N p, are exactly determined from the optimum LSF curve calculated using the periodic function [eq. (A1)] with the MEM-estimated periods (T n).
DECLARATION OF INTEREST
None.


