INTRODUCTION
Varicella is a highly contagious disease caused by the varicella zoster virus (VZV), a member of the herpes virus family which has a worldwide distribution and occurs typically as epidemics in children. VZV is capable of persisting in a latent form in the sensory ganglia and reactivation may occur many years after the first infection resulting in the onset of herpes zoster disease. The virus usually transmits via droplets or by direct contact with the skin lesions of persons suffering from varicella or herpes zoster.
Varicella vaccine was first licensed in Japan in 1989 and has thereafter acquired wide use. In some countries, e.g. USA and Canada, it is recommended for all children aged >1 year. The effectiveness of the vaccine in an immunization programme has been estimated to be 80% [Reference Seward1] for a one-dose programme, and 93% [Reference Kuter2, Reference Zhou3] for a two-dose programme, respectively. Due to significant burden of disease and occasionally difficult clinical disease (especially in immunocompromised children), universal varicella vaccination is being considered in several countries.
Mass vaccination with varicella vaccine may have emergent population-level consequences that are not easily derived from individual responses to the vaccine. Due to indirect protection (herd immunity), the incidence of disease can be expected to decrease faster than the proportion of vaccinated individuals increases. After the onset of a vaccination programme, the average age of disease cases would increase, but it might be difficult to predict whether such a change would be relative or whether the absolute number of cases would rise. There is also a risk of post-vaccination epidemics as a result of the nonlinear dynamics of transmission, caused by a gradual accrual of a pool of newly susceptible individuals in the population.
Specific to VZV, there is also a potential risk of an excess incidence of zoster due to decreasing population immunity, when the natural circulation of the virus decreases. The available evidence thus far seems inconclusive as to whether varicella vaccination will induce an increase in zoster incidence. In the USA, where mass vaccination has taken place since 1995, some sources indicate that no changes have occurred [Reference Jumaan4], while some authors have reported an increase in the incidence of zoster [Reference Yih5].
Mathematical models provide a coherent way to summarize the epidemiology of an infection and to predict likely outcomes of different interventions. A number of previous authors have modelled the population-level effects of mass vaccination on varicella [Reference Ikada, Kagami and Yamamoto6–Reference Goldman11]. All these studies indicate a substantial decrease in the incidence of varicella as a result of a vaccination campaign. The average age of varicella cases would increase, yet the absolute number of cases would not increase in any age group [Reference Brisson9]. The disease may not be eradicated, and post-vaccination epidemics may occur [Reference Brisson9]. Where the inter-linked dynamics of varicella and zoster is modelled [Reference Brisson9, Reference Garnett and Grenfell12–Reference Brisson14], the models suggest that a significant excess in the incidence of zoster may result from mass vaccination against varicella.
In our study, we built a new epidemiological model of varicella and zoster. Our main objective was to assess the impact of different vaccination policies against varicella on reactivation of varicella zoster. There are several differences to previous models. First, we generalized the previous approach of Wallinga et al. [Reference Wallinga15, Reference Wallinga, Teunis and Kretzschmar16] in combining survey data on social contacts and serological data to identify the pattern of varicella transmission. Specifically, we propose a new model to identify the force of infection (FOI) primarily on the basis of the serological data, still using the survey data to inform the source of infection. Second, reactivation of varicella zoster in VZV-positive individuals (those who have had primary varicella disease) is modelled in a new way. Specifically, boosting of immunity against zoster is allowed for all VZV-positive individuals with the same age-specific rate as varicella infection in VZV-negative individuals. Reactivation of the virus is modelled by using age and the time elapsed since the last varicella contact as independent risk factors. Finally, the vaccination programme in our model includes two doses and a potential catch-up programme.
We modelled the epidemiology of varicella and zoster in the context of Finland, using local data to calibrate the model. The demographic model is initialized with the current age distribution and mortality. This is relevant because the middle-aged group are over-represented in the current population of Finland, causing an increase in the burden of zoster irrespective of vaccination against varicella.
METHODS
Age-specific seropositivity for VZV infection
The data were collected in the Finnish arm of the European Seroepidemiological Network 2 (ESEN2) and have been described previously [Reference Nardone17]. Briefly, presence of antibodies to VZV was measured in 3214 Finnish individuals representing ages from 0 to 88 of years. Figure 1 presents the data as age-specific cumulative incidence of seropositivity. Because the estimation of the endemic (i.e. pre-vaccination) force of varicella infection depends primarily on these data, this per capita rate of exposure to varicella will refer to all clinical and subclinical infection that raises antibodies to varicella.
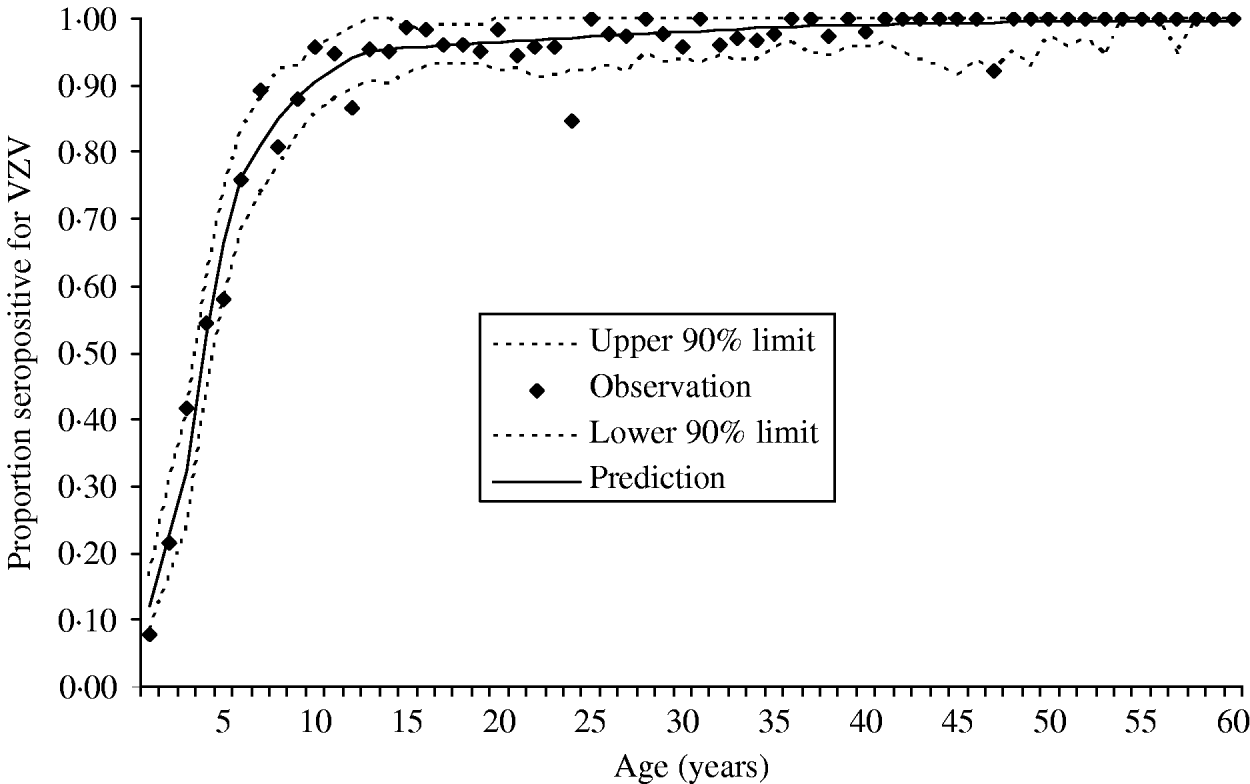
Fig. 1. Cumulative incidence of seropositivity for VZV antibodies as a function of age. The observed proportion of seropositivity is plotted for each annual age group (total n=3214). All individuals aged ⩾60 years of age were seropositive. The figure also shows the predicted cumulative incidence derived from the estimated age-specific force of infection (––––). The 90% point-wise upper and lower predictive intervals (- - -) were calculated from the predictive cumulative incidence and the actual sample size of each age group.
Case-notification data of herpes zoster
Outpatient visits due to zoster were collected from three healthcare centres (Tuusula 2000–2006, Salo 2001–2003 [18], Kangasala 2002–2003 [18]) to study reactivation of VZV, with a total number of 765 visits and a total person-time of about 440 000 person-years. Figure 2 shows the data as age-specific incidence of outpatient visits due to zoster. There appears to be little geographic variation within Finland. Up-scaling the total incidence in the catchment areas of the three healthcare centres implies some 10 900 visits per year in the current Finnish population (n=5 255 000 in 2006). Based on these data, cases of zoster will refer to visits to primary health care due to zoster.
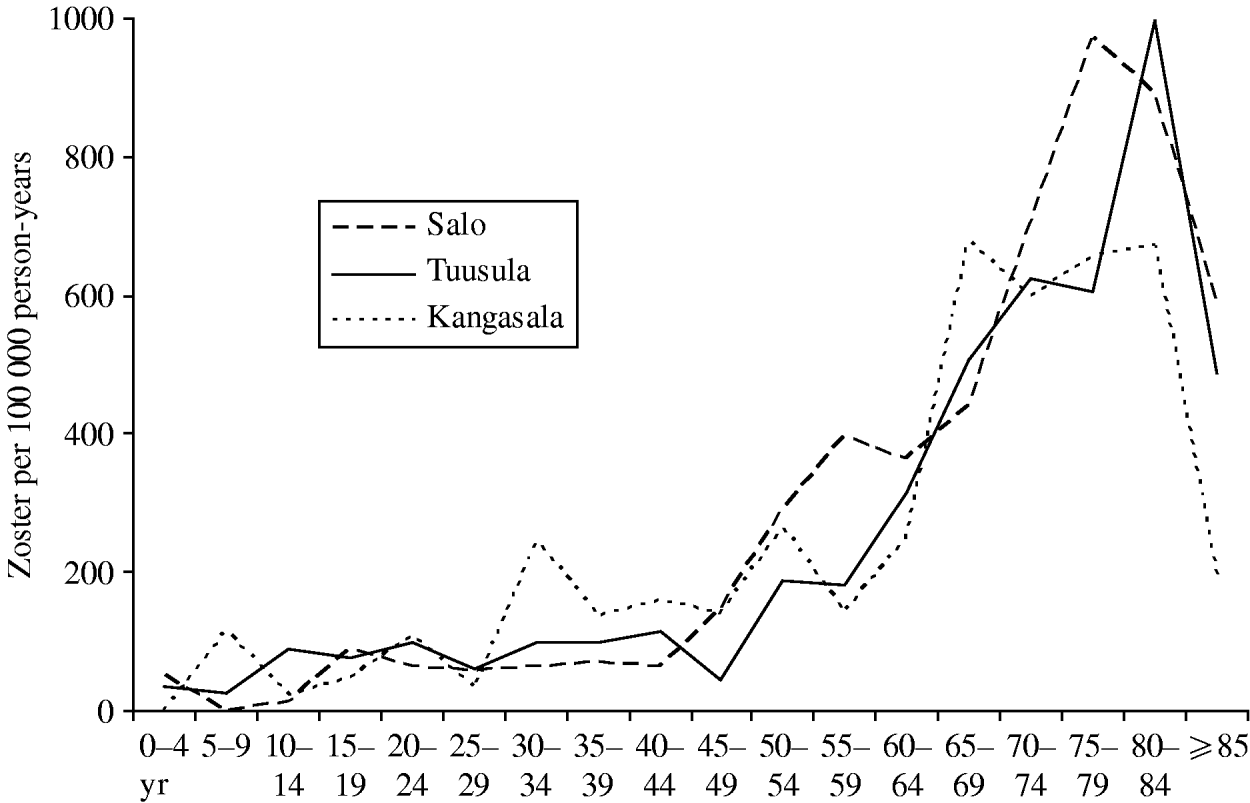
Fig. 2. Case-notifications of zoster by age group. The age-specific incidence of zoster per 100 000 person-years was calculated from the outpatient visits recorded at three healthcare centres and the respective age-specific base populations in the catchment areas. The decrease in the incidence in the ⩾85 years age group is probably an artefact since a large proportion of this age group is, for example, in nursing homes and they do not visit outpatient clinics in healthcare centres.
Contact pattern
The number and characteristics of daily conversational contacts were recorded by the participants of the Finnish arm of the POLYMOD Contact Survey [Reference Mossong19]. The relative numbers and the age of the contacts were used to identify the mixing pattern of potentially infectious VZV contacts in the population. In the current study, data from 890 individuals and their 4349 contacts involving physical touch were used. This was based on work by Mossong et al. [Reference Anderson and May20] who showed that presence of physical touch is clearly associated with the more intense contacts regarding frequency and duration, and thus likely to contribute most to varicella transmission.
The epidemiological model of varicella and zoster
We constructed a mathematical model of transmission of VZV, incidence of herpes zoster and the impact of vaccination on their epidemiology. The model is dynamic in the sense that the force of varicella infection is taken to depend on the prevalence of infectious cases of varicella and zoster in the population. Figure 3 presents the model diagram. The corresponding equations are presented in Appendix A. Appendix Table A1 summarizes values of the model parameters.

Fig. 3. The epidemiological model. In addition to transitions depicted in the diagram, the individual may die in any compartment with an age-specific rate irrespective of the compartment. (For transition rates, see Appendix Table A1.) Rates may depend on calendar time (t) and age (a). The reactivation rate of varicella zoster virus (VZV) [h(a, d) in the figure] depends on age, and the time (‘duration’) elapsed since previous exposure to VZV.
The upper part of Figure 3 presents the model of the natural history of varicella infection and the reactivation of the virus. Children are born susceptible. Susceptible (i.e. VZV negative) individuals acquire primary varicella disease with age-specific FOI. After primary infection, a varicella case is first latent and then infectious. After recovery, the individual remains VZV positive and may be exposed to VZV in contacts with infectious persons, which boosts the individual's immunity against reactivation of VZV. The rate of boosting is taken to be the same as the force of varicella infection. The virus may re-activate whence the individual develops zoster (see below). After recovering from zoster, the individual is considered permanently immune against varicella and zoster.
The lower part of Figure 3 (with dashed compartments) is relevant only after the onset of the mass vaccination. After the first dose, vaccination may result in failure or temporary protection. Where there is vaccine failure, the individual becomes a ‘vaccinated susceptible’. This may also happen if the temporary immunity wanes before the second dose. The second dose results in complete immunity to both varicella and zoster. In principle, some of the twice-vaccinated individuals might still develop breakthrough varicella, as a result of complete failure to respond to the vaccine. However, the possibility of this was omitted in the model as it was deemed that the number of such cases is negligible with respect of the total burden of disease.
Pattern of transmission
We used an age-structured compartmental model to describe the transmission pattern of varicella infection [Reference Anderson and May20]. The population was divided into seven age groups, based on the Finnish school system and expert opinion: 0–2, 3–5, 6–12, 13–19, 20–29, 30–49, and ⩾50 years. The pattern of transmission, i.e. the next-generation matrix, and the FOI were estimated jointly from the seroepidemiological data and the contact survey data. Briefly, the serological data were used to determine the endemic age-specific FOI where there was enough information in these data (<30 years age groups). The contact pattern from the contact survey was used to model the source of infection in all age groups, and the endemic FOI in the ⩾30 years age group where serological data were not informative (for details see Appendix B).
Rate of reactivation
Reactivation of VZV was modelled as a semi-Markov process. Specifically, the rate of reactivation in a VZV-positive individual was taken to depend on age and the time (‘duration’) elapsed since the previous exposure to the virus. The distribution of duration (d) at age a was calculated from the endemic FOI λ(a) using
This distribution was used to determine the age-specific size of the VZV-positive population. Combined with the case-notification data of zoster, the effects of age and duration on VZV reactivation were estimated by a log-linear model. Formally, the rate of reactivation in a VZV-positive individual was modelled as
The constant a 0 denotes the age from which age begins to have an effect on the rate of reactivation, and θa and θd denote the (log) relative rates for 1 year change in age and duration, respectively. The analysis of the case-notification data is explained in more detail in Appendix C.
Two scenarios regarding the effect of age on the rate of reactivation were considered. Under scenario A, age has effect in individuals aged ⩾45 years (i.e. a 0=45). Under scenario B, the effect of age only starts at 65 years (i.e. a 0=65). Scenario A seems appropriate on the basis of the case-notification data (Fig. 2). Up to 45 years of age, the small increase in incidence is attributable to the fact that the proportion of VZV positives, i.e. zoster susceptibles, increases with age. Beyond 45 years, it is likely that the incidence increases sharply because these age groups have a greater risk of VZV reactivation. Scenario B is justified by an a-priori idea that 65 years could be a threshold value representative of immunological ageing. This also is a typical starting age of universal influenza vaccination for the elderly.
Vaccination
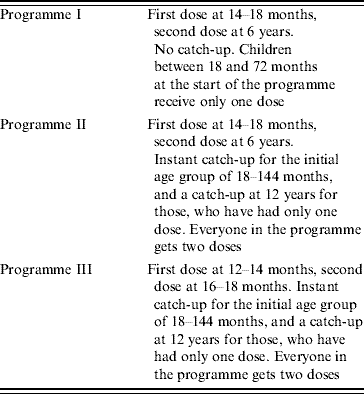
Following Brisson et al. [Reference Brisson14], vaccine efficacy was characterized by four parameters: probability of primary failure, the rate of waning immunity after the first dose, the relative susceptibility of vaccinated susceptibles, and the relative infectiousness of vaccinated cases of varicella. For these parameters, we use values estimated by Krause & Klinman [Reference Krause and Klinman21] and Brisson et al. [Reference Brisson14] (cf. Appendix Table A1).
Appendix Table A2 presents the three vaccination programmes that were compared with regard to their effectiveness in eliminating varicella transmission. All of these programmes involve two doses, but the age of vaccination varies. Two of the programmes include catch-up campaigns. The coverage of vaccination was taken to be 95%, corresponding to the current level in the national vaccination programme. In the epidemiological model, an individual was randomized to acquire either both doses of varicella vaccine, or neither. This means that 5% of each birth group remains completely unvaccinated.
RESULTS
Varicella transmission and FOI
The pattern of transmission and the force of varicella infection (rate of primary varicella infection per person-year) were jointly estimated from the seroepidemiological and contact data. The posterior mean estimate of the force of varicella infection in the endemic state was: 0·13 per year (in individuals aged 0–2 years), 0·35 (3–5 years), 0·23 (6–12 years), 0·04 (13–19 years), 0·06 (20–29 years), 0·08 (30–49 years), and 0·02 (⩾50 years). This is in good agreement with previous estimates from serological data alone [Reference Nardone17].
The pattern of transmission is characterized by the next-generation matrix. The posterior mean estimate of this matrix is presented in Appendix Table B1. This matrix corresponds to the basic reproduction number R 0=5·3 (Nardone et al. [Reference Nardone17] report R 0=4·85 from the same data).
Time elapsed since contact with varicella
Figure 4 shows how time (‘duration’) since previous exposure to VZV depends on age. It should be noted that the distribution refers to those who are VZV positive. In general, the time since exposure increases with age. In more detail, this is the case for the mean duration, whereas the shape of the distribution shows more variability. Specifically, a relatively high proportion of short durations are encountered in the 25–49 years age groups, because these age groups have school-aged children.

Fig. 4. Distribution of the time (‘duration’) since previous exposure to varicella zoster virus (VZV) in VZV-positive individuals by age group. For each age group, the distribution was derived from the estimated endemic force of infection (see Appendix B).
The rate of reactivation
Case-notification data were used to estimate the effects of age and time since previous exposure on the rate of varicella zoster reactivation in VZV-positive individuals (Appendix B). We considered two scenarios regarding the effect of age. Under scenario A, each additional year since age 45 years was estimated to increase the risk of zoster by 4·4% [interquartile range (IQR) 2·9%], and each year since previous exposure was estimated to increase the risk by 3·3% (IQR 1·9%). Under scenario B, in which the effect of age was confined to those aged ⩾65 years, the posterior mean of the age effect was 0% (IQR 0·3%), whereas each year since previous exposure was estimated to increase the risk by 8·4% (IQR 0·5%).
Under both scenarios, the estimated effects were found strongly dependent, there being a trade-off in attributing the increase in zoster incidence with age to either duration or to age itself. Despite more precise estimates being obtained under scenario B, the model under scenario A may be defended with model-choice statistics [Deviance Information Criterion (DIC) under A: 2833, vs. DIC under B: 3024]. These two scenarios are taken to be representative of a wider range of potential reactivation rates, scenario B being an extreme case (with an estimated effect of 0% for age), and scenario A being more conservative (with substantial effects estimated for both age and time elapsed since natural boosting).
The impact of mass vaccination on varicella
The predicted annual incidence of primary varicella decreases sharply after the onset of the vaccination programme (Fig. 5). Within a few years, varicella transmission would go to extinction, and the few remaining cases of varicella would be due to infection from cases of zoster. The main difference between different vaccination programmes is observed during the first few years after the onset of the programmes. Programmes with instant catch-up (II–III) are more successful than the programme with no catch-up at all (I).
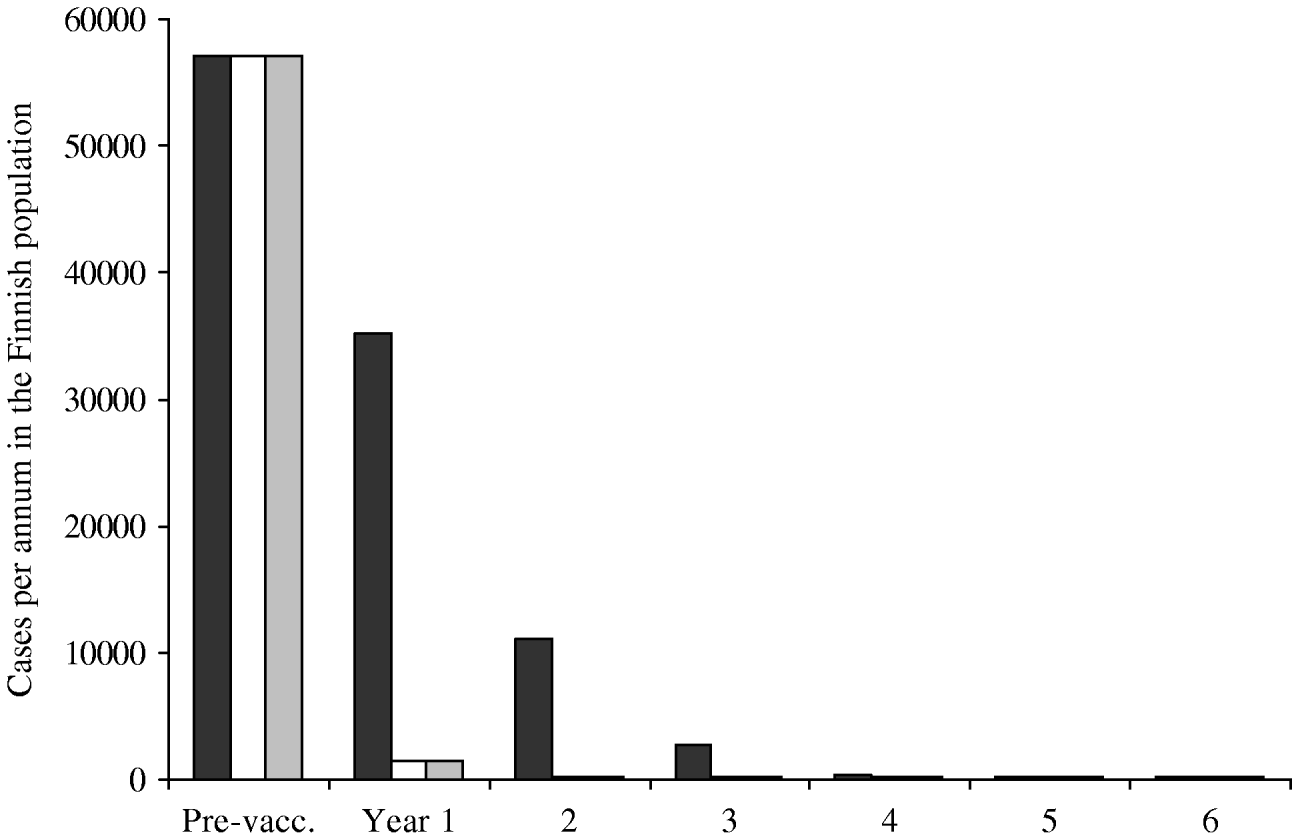
Fig. 5. Incidence of primary varicella after the onset of the vaccination programme. Three vaccination programmes are compared, all including two doses. Programmes II (□) and III (![]() ) include instant catch-ups during the first year, programme I (▪) does not. The residual incidence (onwards from year 5) is due to disease acquired from exposure to cases of zoster. The pre-vaccination incidence roughly corresponds to the size of the birth cohort in Finland.
) include instant catch-ups during the first year, programme I (▪) does not. The residual incidence (onwards from year 5) is due to disease acquired from exposure to cases of zoster. The pre-vaccination incidence roughly corresponds to the size of the birth cohort in Finland.
The average age of varicella cases was estimated to increase with the decreasing incidence of primary varicella. However, the absolute number of cases does not increase in any age group. For example, in year 7 of the vaccination programme I, the average age of cases is 11 years and their total number is ∼200. Without mass vaccination, the average age would be 4·8 years, the total number being some 58 000. In all age groups, the incidence is higher without mass vaccination.
The impact of demography on zoster
Because the Finnish population is still ageing, the incidence of zoster would increase from its current level of 10 900 primary health-care visits per year even without vaccination against varicella. Assuming no change in mortality and birth rate, the annual number of zoster visits will rise for some 30 years, peaking at 13 200 (scenario A). After this, incidence starts to decrease, levelling off at 9800 visits per year. The predictions under scenario B behave similarly, the annual case numbers being 0–10% lower than under scenario A. This reflects slight differences between the scenarios in the estimated age-specific incidences of zoster.
The impact of varicella vaccination on zoster
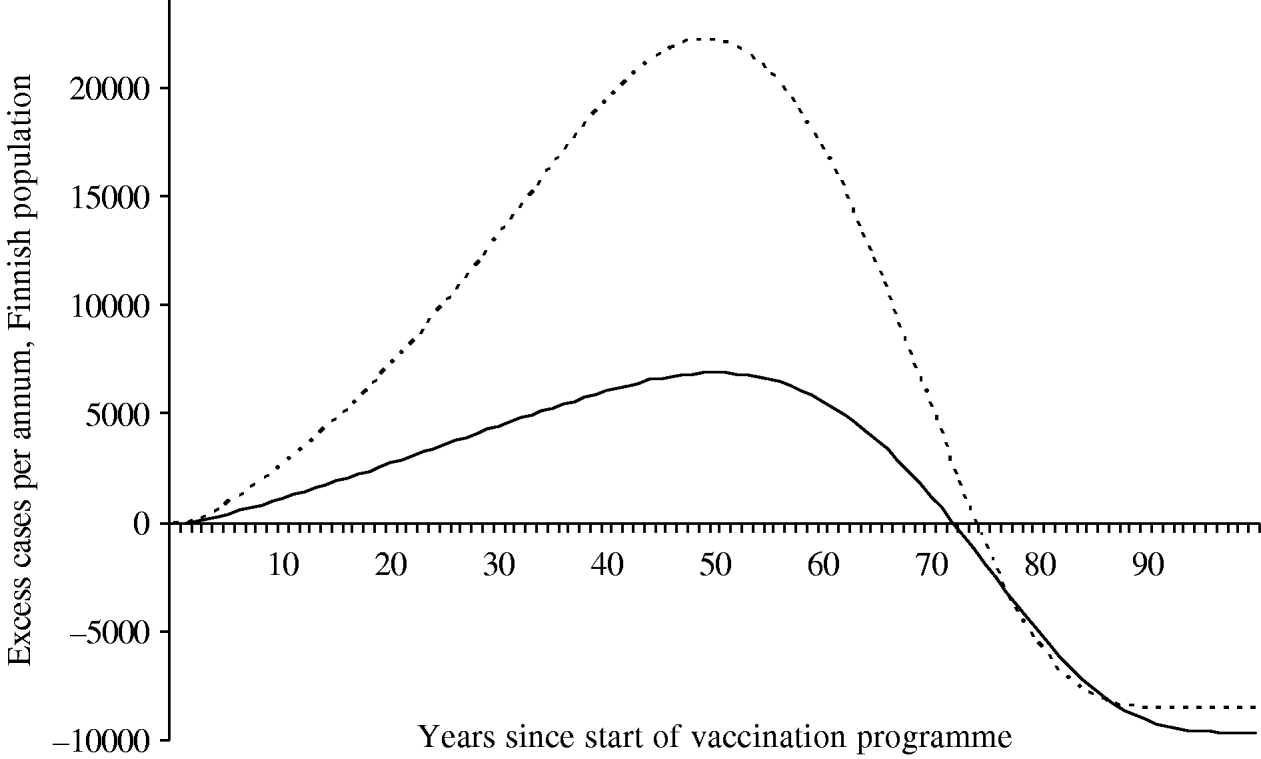
Because of changes in the baseline incidence of zoster over time, we calculated the annual number of excess visits that mass vaccination would induce. Under both scenarios the incidence of zoster first increases after onset of vaccinations (Fig. 6). The peak number of excess visits is larger under scenario B (22 000 per year under B vs. 6900 per year under A). This is because scenario B places more emphasis on time elapsed since exposure to varicella, and hence, prevention of the natural circulation affects viral reactivation more than under scenario A. Under both scenarios, it takes at least ∼75 years, until the incidence of zoster would be smaller than without mass vaccination.
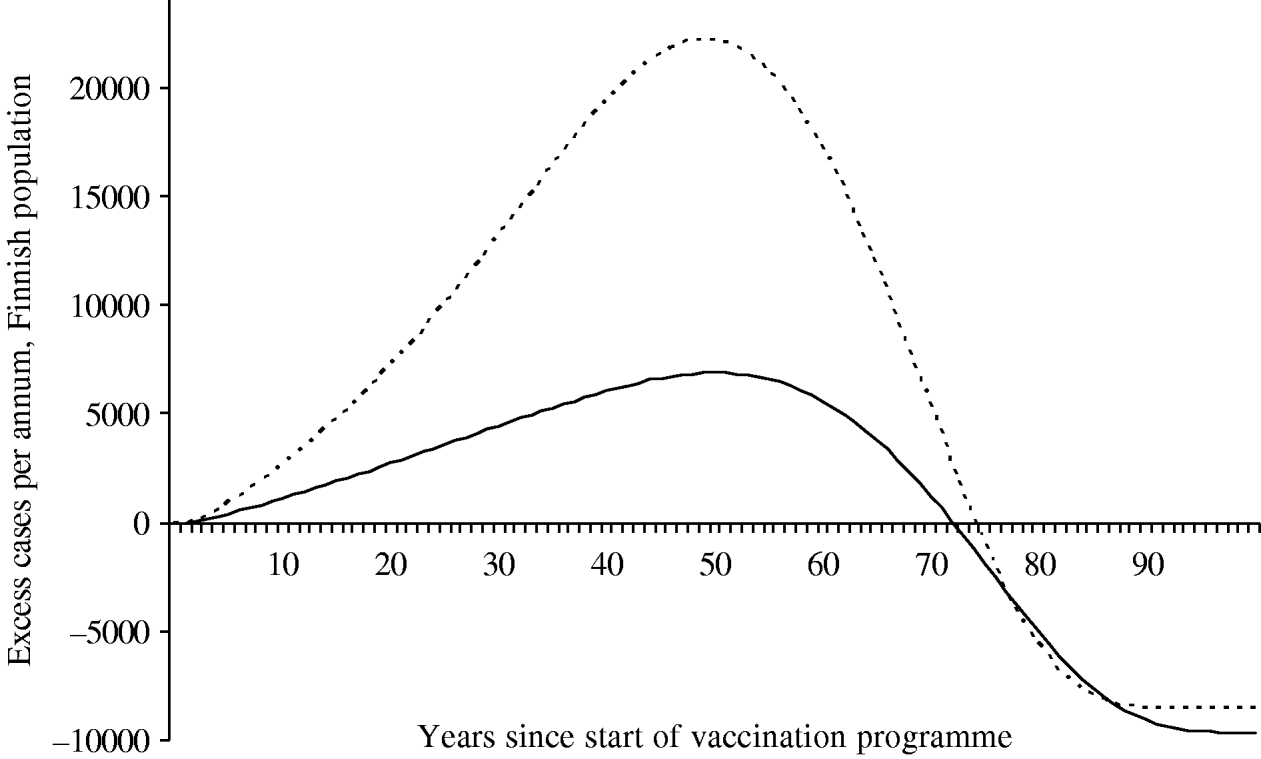
Fig. 6. Excess incidence of zoster after the onset of the vaccination programme I. To quantify the impact of mass vaccination, the incidence without a vaccination programme is subtracted. The number of cases is representative of the Finnish population (n=5 255 000 in 2006). In scenario A (–––), the age of the individual is an independent risk factor for zoster in the ⩾45 years age group. In scenario B (······), the age is an independent risk factor in the ⩾65 years age group.
Figure 7 compares the current age-specific incidence of zoster with predictions from the model for 30 years hence. If no vaccination programme is in place, the absolute incidence in the elderly will be higher in the future, because there will be more old people in Finland. If a vaccination programme is in place, this effect will be amplified by the lack of natural boosting by primary varicella cases, and the overall burden of zoster will be higher. However, in the <30 years age group there will be very few zoster cases, since up to 95% of these age groups will have received two doses of varicella vaccine which is assumed to prevent zoster.
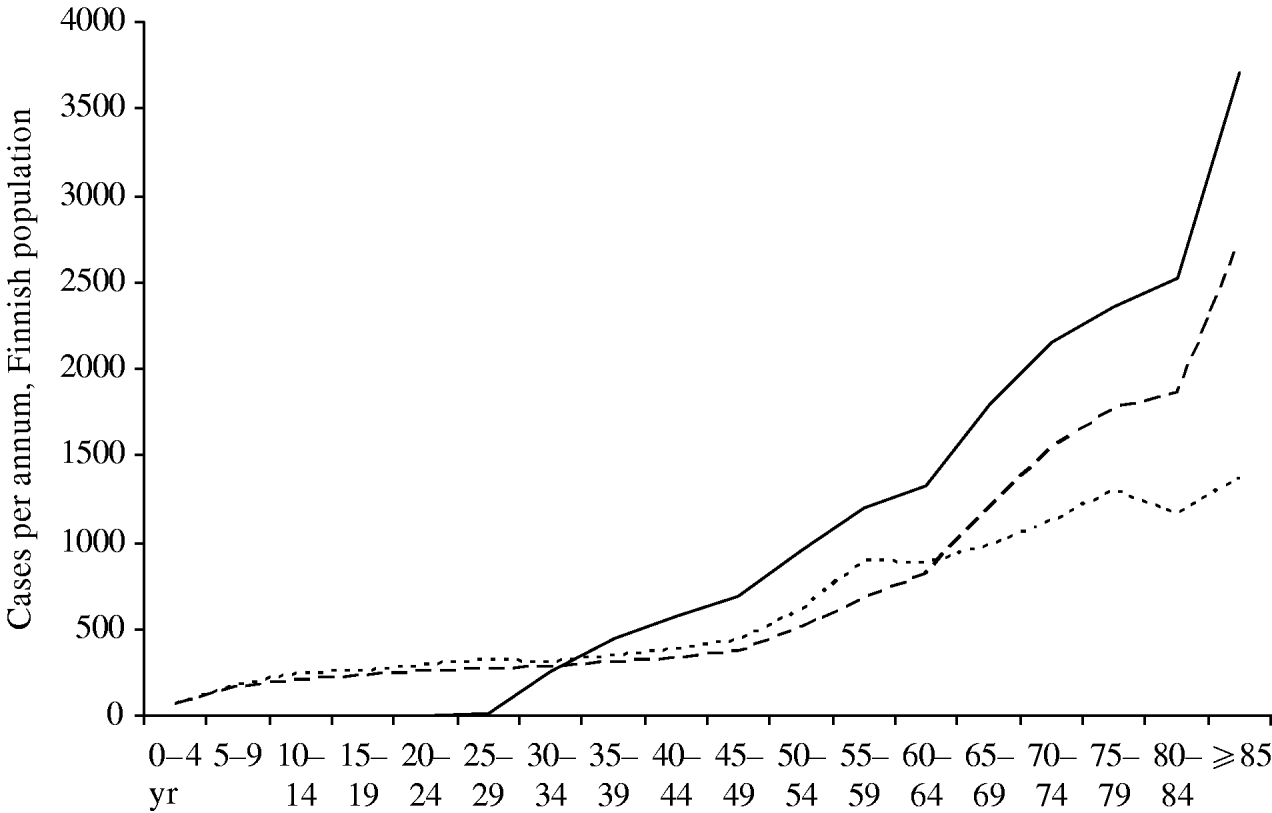
Fig. 7. Age distribution of zoster cases. Current age distribution (·······); distribution in year 30 without mass vaccination (- - -); distribution in year 30 with vaccination programme I (–––). For all curves, the reactivation scenario A is assumed (see text).
The rate of reactivation is clearly the key determinant of predictions concerning the future incidence of zoster. If natural boosting had no effect on zoster immunity, mass vaccination would not affect activation of zoster in current VZV positives, while it would stop the influx of new VZV positives. In this case, mass vaccination would decrease the incidence of both varicella and zoster right from the start of the programme. On the other hand, under scenarios A and B of the current study, the incidence of zoster increases substantially subject to mass vaccination (30% under scenario A, and 85% under scenario B, compared to the natural state over the next 50 years).
DISCUSSION
We constructed an epidemiological model to predict the incidence of both varicella and herpes zoster, subject to a mass-vaccination programme against varicella. The incidence of zoster will increase substantially as a result of the demographic change alone. In addition to that, we found that a childhood programme against varicella would create an excess of 30–85% in the incidence of zoster over the next 50 years. In contrast, the high vaccine coverage of the national vaccination programme in Finland and a two-dose programme were found very effective in preventing varicella.
Model-based predictions on disease transmission can be very sensitive to the assumed pattern of infectious contacts in the population. However, our analysis of the impact of vaccination on the incidence of varicella was not particularly sensitive to the assumed pattern of transmission. A two-dose vaccination programme would decrease the incidence of varicella to very low levels soon after the start of the vaccination programme, regardless of the assumed structure of the next-generation matrix. This was tested by running the epidemiological model with a next-generation matrix corresponding to the assumption of semi-assortative mixing described as the ‘worst plausible’ scenario [Reference Wallinga15] (data not shown).
The vaccine efficacy parameters did not have a major effect on predictions about post-vaccination varicella. This was confirmed by running the epidemiological model with the least effective vaccination programme (I) and two different sets of parameters of vaccine efficacy (‘baseline’ and ‘alternative’ values in Appendix Table A1). The total number of varicella cases in the first 7 years of the vaccination programme was only 11% more under the alternative scenario.
Our analysis thus shows that mass vaccination would be very effective in preventing varicella in the Finnish population. This is in contrast with results obtained with earlier models [Reference Gidding10, Reference Brisson14, Reference Edmunds and Brisson22]. The discrepancy is firstly attributable to the fact that we consider vaccination programmes with two doses which are widely recommended to obtain sufficient response in most children. Second, the effectiveness of the varicella vaccination is due to the high coverage of the vaccination (95%) which was assumed realistic for Finland.
In line with varicella, predictions about post-vaccination incidence of zoster were not sensitive to the pattern of transmission. In our approach, estimation of the FOI primarily depends on the serological profile of VZV-positive individuals. The FOI in turn determines the age-specific pattern of the time since exposure (Fig. 4), which is used in the estimation of the reactivation rate of VZV. The residual exposure to the wild-type virus in the post-vaccination era (which does depend on the pattern of transmission) has little effect on the incidence of zoster, compared to the fact that the transmission is practically stopped in a time-frame of 3–5 years. Consequently, the incidence of zoster depends primarily on the assumed model of reactivation.
Although the effects of age and time since previous exposure to varicella were poorly identifiable from case-notification data only, the data clearly support scenario A where both age and duration have substantial effects. The implications of the epidemiological model were similar under both scenarios, and the incidence of zoster was predicted to increase as a result of varicella vaccination. The almost double cumulative number of excess cases under scenario B marks the worst-case scenario. Although there are other scenarios that would not involve essential impact on zoster (i.e. those where immunity attributable to VZV exposure is very weak), it seems optimistic to postulate such assumptions in view of the lack of understanding of the mechanism of VZV reactivation.
Our analysis of zoster incidence was based on case-notifications collected from outpatient visits at primary healthcare. The incidence thus does not refer episodes of zoster treated at secondary healthcare. Although the incidence of the latter is only a fraction of that for primary healthcare (∼10% in Finland, data not shown), it constitutes a considerable burden of disease due to more severe disease and medical costs.
Moreover, demography plays a role in predicting post-vaccination incidence of zoster. The proportion of middle-aged people in Finland is high, and as they age, they produce more zoster cases than the present population with or without mass vaccination. Second, future longevity adds to the burden of disease. However, this effect is observed with or without mass vaccination; therefore, the number of excess cases attributable to vaccination is roughly independent of this risk factor.
Similarly to many previous studies [Reference Brisson9, Reference Garnett and Grenfell12–Reference Brisson14, Reference Edmunds and Brisson22], our model predicts that varicella vaccinations will lead to a substantial increase in the incidence of zoster. However, the magnitude and time scale of this effect depend on the age structure of the population and the way reactivation of VZV is modelled. The currently available epidemiological data seem insufficient to draw definitive conclusions about the mechanism of reactivation, and biomedical research should be carried out for a better understanding of this phenomenon. This ultimately determines the consequences of a varicella vaccination programme. In parallel, it is invaluable to continue detecting any changes in the epidemiology of zoster in countries that have adopted mass immunization against varicella.
APPENDIX A
The model equations
The model corresponds to the following system of partial differential equations:
![\eqalign{\tab S_{a} \plus S_{t} \equals \minus \left[ {\lambda \lpar a\comma t\rpar \plus v_{\setnum{1}} \lpar a\comma t\rpar \plus \mu \lpar a\comma t\rpar } \right]S\lpar a\comma t\rpar \cr \tab L_{a} \plus L_{t} \equals \lambda \lpar a\comma t\rpar S\lpar a\comma t\rpar \minus \left[ {\pi \plus \mu \lpar a\comma t\rpar } \right]L\lpar a\comma t\rpar \cr \tab I_{a} \plus I_{t} \equals \pi L\lpar a\comma t\rpar \minus \left[ {\rho \plus \mu \lpar a\comma t\rpar } \right]I\lpar a\comma t\rpar \cr \tab P_{a} \plus P_{t} \plus P_{d} \equals \minus \left[ {h\lpar a\comma d\rpar \plus \lambda \lpar a\comma t\rpar \plus \mu \lpar a\comma t\rpar } \right]P\lpar a\comma t\comma d\rpar \cr \tab H_{a} \plus H_{t} \equals \int\nolimits_{\setnum{0}}^{\infty } {h\lpar a\comma d\rpar P\lpar a\comma t\comma d\rpar dd} \minus \left[ {\gamma \plus \mu \lpar a\comma t\rpar } \right]H\lpar a\comma t\rpar \cr \tab R^{\lpar v\rpar }\hskip0.5pt _{a} \plus R^{\lpar v\rpar }\hskip0.5pt _{t} \equals \lpar 1 \minus \tau \rpar v_{\setnum{1}} \lpar a\comma t\rpar S\lpar a\comma t\rpar \minus \left[ {w \plus v_{\setnum{2}} \lpar a\comma t\rpar}\right.\cr \tab \left.{ \hskip55.5pt\plus \mu \lpar a\comma t\rpar } \right] R^{\lpar v\rpar } \lpar a\comma t\rpar \cr \tab S^{\lpar v\rpar }\hskip0.5pt _{a} \plus S^{\lpar v\rpar }\hskip0.5pt _{t} \equals \tau v_{\setnum{1}} \lpar a\comma t\rpar S\lpar a\comma t\rpar \plus wR^{\lpar v\rpar } \lpar a\comma t\rpar \minus \left[ {\theta \lambda \lpar a\comma t\rpar} \right.\cr \tab \left.{\hskip55.5pt\plus v_{\setnum{2}} \lpar a\comma t\rpar \plus \mu \lpar a\comma t\rpar } \right]R^{\lpar v\rpar } \lpar a\comma t\rpar \cr \tab L^{\lpar v\rpar }\hskip0.5pt _{a} \plus L^{\lpar v\rpar }\hskip0.5pt _{t} \equals \theta \lambda \lpar a\comma t\rpar S^{\lpar v\rpar } \lpar a\comma t\rpar \minus \left[ {\pi \plus \mu \lpar a\comma t\rpar } \right]L^{\lpar v\rpar } \lpar a\comma t\rpar \cr \tab I^{\lpar v\rpar }\hskip0.5pt _{a} \plus I^{\lpar v\rpar }\hskip0.5pt _{t} \equals πL^{\lpar v\rpar } \lpar a\comma t\rpar \minus \left[ {\rho \plus \mu \lpar a\comma t\rpar } \right]I^{\lpar v\rpar } \lpar a\comma t\rpar \cr \tab R_{a} \plus R_{t} \equals \gamma H\lpar a\comma t\rpar \plus \rho I^{\lpar v\rpar } \lpar a\comma t\rpar \plus v_{\setnum{2}} \lpar a\comma t\rpar \left[ {R^{\lpar v\rpar } \lpar a\comma t\rpar} \right.\cr \tab \left.{\hskip38.5pt \plus S^{\lpar v\rpar } \lpar a\comma t\rpar } \right] \minus \mu \lpar a\comma t\rpar R\lpar a\comma t\rpar. \cr}](https://static.cambridge.org/binary/version/id/urn:cambridge.org:id:binary:20160921000337274-0678:S0950268809990768:S0950268809990768_eqnU3.gif?pub-status=live)
Above, S(a, t) is the population density of susceptibles of age a at time t, L(a, t) is the population density of the unvaccinated varicella cases in the latent phase, I(a, t) is the population density of infectious, unvaccinated varicella cases, and P(a, t, d) is the population density of VZV positives who have age a and duration d at time t. Variable H(a, t) is the population density of zoster cases, R(a, t) is the population density of completely immune individuals (that are removed from the model), R (v)(a, t) is the population density of the individuals protected by the first dose, S (v)(a, t) is the population density of the vaccinated susceptibles, L (v)(a, t) is the population density of vaccinated latent varicella cases, and I (v)(a, t) is the population density of vaccinated infectious varicella cases. Notation X i (i=a, t, d) denotes a partial derivative of X.
The model comprises the following transition rates: λ(a, t) is the FOI in age a at time t, v 1(a, t) is the rate of vaccination (first dose) for age a at time t (calibrated so that it produces the 95% vaccine coverage in a time appropriate for each vaccination programme), μ(a, t) is the mortality in age a at time t, π is the rate of progression from latent varicella to infectious disease, ρ is the rate of recovery from varicella, h(a, d) is the rate of viral reactivation for an individual of age a and duration d, γ is the rate of recovery from zoster, v 2(a, t) is the rate of vaccination (second dose) for age a at time t, τ is the rate of primary vaccine failure, w is the rate of waning immunity after the first dose, θ is the relative susceptibility of the vaccinated susceptibles.
The FOI at age a is defined as a functional
where β(a, u) is the transmission rate from an individual of age u to an individual of age a. Parameter α is the relative infectiousness of varicella in vaccinated individuals, and ϕ is the rate of varicella infection due to zoster. The estimation of transmission rates β(a, u) is explained in Appendix B. Appendix Table A1 summarizes the model parameters, and Appendix Table A2 explains the three vaccination programmes that were tested.
Table A1. The parameters in the epidemiological model that have values in the literature
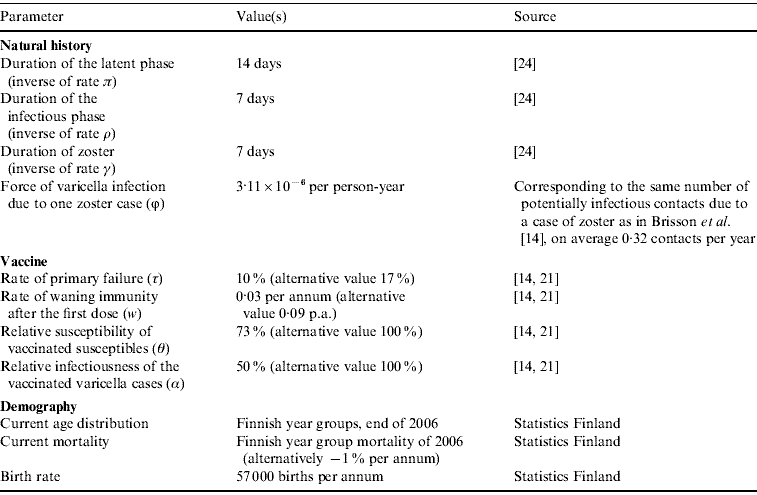
Table A2. The vaccination programmes
The system of differential equations was solved using the method of characteristics and a simple discretization. Different time steps were tried, and one day seemed to be a sufficiently small.
APPENDIX B
The pattern of transmission
FOI and the next-generation matrix
Denote the next-generation matrix by K=(k i,j) where the (i, j)th entry is defined as the mean number of secondary cases that an infectious individual of age group j would produce in an entirely susceptible subpopulation of age group i. In the epidemiological model, the transmission rate β(a, u) is calculated from the next-generation matrix so that
where i a and j u are the age groups corresponding to ages a and u, ![]() is the total number of individuals in age group i a, and 1/ρ is the mean duration of infectious phase in varicella cases.
is the total number of individuals in age group i a, and 1/ρ is the mean duration of infectious phase in varicella cases.
In the endemic equilibrium, the relation between the per capita rate of exposure to varicella and the next-generation matrix [Reference Wallinga15, Reference Greenhalgh and Dietz23] is given by
Here, a i-1 and a i are the lower and upper limits of age group i, and σ(a)=exp(−Λ(a)) where ![]() , is the probability of still being seronegative at age a. Given the next-generation matrix, equation (B1) can be solved for a piece-wise constant FOI λ(a).
, is the probability of still being seronegative at age a. Given the next-generation matrix, equation (B1) can be solved for a piece-wise constant FOI λ(a).
The social contact hypothesis and the use of survey data
Denote the contact rate matrix by M=(m i,j), where the (i, j)th entry is the average number of contacts an individual of age group j makes with individuals of age group i during one day. As a natural symmetry condition, it must hold that m i,jn j=m j,in i for subpopulation sizes n j and n i [Reference Wallinga, Teunis and Kretzschmar16]. Based on the ‘social contact hypothesis’ [Reference Wallinga, Teunis and Kretzschmar16], we write K as a function of M so that
where the proportionality factors q i (i=1, …, 7) scale the rate of social contacts into potentially infectious contacts. The proportionality factor may be different in different age groups, because the same exposure may lead to different risk of infection in different age groups. This parametrization also allows estimation of a next-generation matrix that closely reproduces the FOI implied by the serological data.
Parameter estimation
The contact matrix M and vector q=(q i) were estimated from empirical data. Let Y 1 and Y 2 denote the serological data and the social contact data, respectively. Thus, Y 1=(y 1k) where y 1k is the binary observation on presence of VZV antibodies in individual k of age a k. The binomial likelihood of the serological data then is
Here the probability of seropositivity is determined by the cumulative rate of infection σ(a)=exp(−Λ(a)). This in turn depends on parameters q and M through equations (B1) and (B2).
The survey data are Y 2=(y 2k) where y 2k=(j k, y 2k,1, …, y 2k,7) so that j k is the age group parameter of responder k, and y 2k,i (i=1, …, 7) is the number of contacts with age group i the responder has reported. The likelihood of contact data is taken to be
where d is shorthand for ![]() , and μ is shorthand for
, and μ is shorthand for ![]() . The model assumes that the number of contacts an individual of age group j makes with individuals in age group i has a negative binomial distribution with mean m i,j and variance m i,j+m i,j2/d i,j. The negative binomial distribution was applied to account for over-dispersion (extra-Poisson variation) in the number of contacts [Reference Wallinga, Teunis and Kretzschmar16, Reference Mossong19]. The dispersion parameters d i,j (i, j=1, …, 7) are taken as free (nuisance) parameters to be estimated from the data.
. The model assumes that the number of contacts an individual of age group j makes with individuals in age group i has a negative binomial distribution with mean m i,j and variance m i,j+m i,j2/d i,j. The negative binomial distribution was applied to account for over-dispersion (extra-Poisson variation) in the number of contacts [Reference Wallinga, Teunis and Kretzschmar16, Reference Mossong19]. The dispersion parameters d i,j (i, j=1, …, 7) are taken as free (nuisance) parameters to be estimated from the data.
Finally, parameters q, M and D were estimated by using a Bayesian approach. They were given independent, uniform priors on constraint that q 5,q 6=q 7. This constraint was added to ensure identifiability. In the older age groups, the serological data does not contain very much information about the endemic FOI; therefore, it is be very difficult to estimate an independent q i for these age groups (see Fig. 1). The joint posterior distribution can thus be written as:
The posterior distribution was analysed by using a step-wise Metropolis–Hastings algorithm. The mean contact numbers (m i,j) were estimated subject to the symmetry condition. Using this, the posterior mean of the next-generation matrix (Appendix Table B1) and the corresponding endemic FOI were calculated, and they were used in the epidemiological model.
Table B1. The next-generation matrix
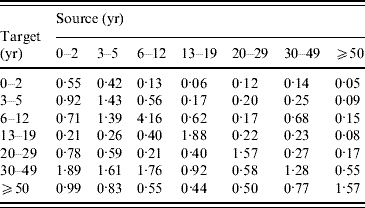
The proportionality factors q i (i=1, …, 7) were estimated jointly with the next-generation matrix, with point estimates 0·76 (0–2 years), 1·11 (3–5 years), 1·11 (6–12 years), 0·55 (13–19 years), and 1·44 (⩾20 years).
APPENDIX C
The reactivation rate
The effect of age, θa, and the effect of duration since previous contact with VZV, θd, were estimated using a log-linear model for the rate h(a, d) of VZV reactivation:
The catchment populations of Tuusula, Salo and Kangasala districts were stratified into 17 five-year age groups. Each stratum of person-time was further stratified into 17 five-year groups, based on the distribution of duration d:
A (17×17) matrix Y=(Y k,j) of person-time at risk was thus obtained. The data in the ⩾85 years age groups were judged unreliable and were excluded from the analysis. The data from the three healthcare centres were clearly similar and were pooled in the analysis.
The numbers of case-notifications of zoster were counted in the 17 age groups [N=(n k), k=1, … , 17]. Although the case-notifications could not be stratified by duration, it follows from the properties of the Poisson process that each n k is a Poisson variate with expectation
where a k and d j are the midpoints of the kth and jth strata of age and duration, respectively. Assuming independent, uniform priors, the posterior distribution of parameters θa, and θd is
This distribution was analysed by using a step-wise Metropolis–Hastings algorithm. In the actual model predictions point estimates of the effects of age and duration were used: exp(θa)=1.044 and exp(θd)=1.033 under scenario A; exp(θa)=1.000 and exp(θα)=1.084 under scenario B.
ACKNOWLEDGEMENTS
The study benefited from discussions held as part of POLYMOD, a European Commission project funded within the Sixth Framework Programme, Contract number: SSP22-CT-2004-502084.
DECLARATION OF INTEREST
None.


